Episodic X-ray Emission Accompanying the Activation of an Eruptive Prominence: Evidence of Episodic Magnetic Reconnection
Abstract
We present an X-ray imaging and spectroscopic study of a partially occulted (N16W93) C7.7 flare on 2003 April 24 observed by RHESSI that accompanied a prominence eruption observed by TRACE. (1) The activation and rise of the prominence occurs during the preheating phase of the flare. The initial X-ray emission appears as a single coronal source at one leg of the prominence and it then splits into a double source. Such a source splitting happens three times, each coinciding with an increased X-ray flux and plasma temperature, suggestive of fast reconnection in a localized current sheet and an enhanced energy release rate. In the late stage of this phase, the prominence displays a helical structure. These observations are consistent with the tether-cutting and/or kink instability model for triggering solar eruptions. (2) The eruption of the prominence takes place during the flare impulsive phase. Since then, there appear signatures predicted by the classical CSHKP model of two-ribbon flares occurring in a vertical current sheet trailing an eruption. These signatures include an EUV cusp and current-sheet-like feature (or ridge) above it. There is also X-ray emission along the EUV ridge both below and above the cusp, which in both regions appears closer to the cusp at higher energies in the thermal regime (20 keV). This trend is reversed in the nonthermal regime. (3) Spectral analysis indicates thermal X-rays from all sources throughout the flare, while during the impulsive phase there is additional nonthermal emission which primarily comes from the coronal source below the cusp. This source also has a lower temperature ( vs. ), a higher emission measure ( vs. ), and a much harder nonthermal spectrum (electron power-law index vs. ) than the upper sources.
Subject headings:
Sun: flares—Sun: prominences—Sun: UV radiation —Sun: X-rays, gamma rays1. Introduction
Eruptions of solar prominences (or filaments) are frequently associated with and physically related to coronal mass ejections (CMEs) and flares (Tandberg-Hanssen, 1995). Investigation of prominence eruptions can provide critical clues not only to prominence activity in its own right, but also to the physics of CMEs and flares. Several proposed mechanisms of prominence eruptions fall into two categories: (1) an ideal magnetohydrodynamic (MHD) process, such as the kink instability of a flux rope (e.g., Fan & Gibson, 2003; Török & Kliem, 2005; Williams et al., 2005), that does not require magnetic reconnection, and (2) a nonideal MHD process in which magnetic reconnection plays an important role. The latter category includes the flux cancellation (van Ballegooijen & Martens, 1989) or tether-cutting (Moore & Roumeliotis, 1992) model in which reconnection occurs below the filament, and the breakout model (Antiochos, 1998; Low & Zhang, 2002) in which reconnection takes place above the filament and removes the confinement from the overlying field lines. On occasions when a filament eruption is accompanied by a flare, the flare X-ray emission provides important timing and spatial information about magnetic reconnection. Such information, especially during the early stage of the filament activation or the flare precursor (van Hoven & Hurford, 1984; Harrison et al., 1985; Harrison, 1986), is very useful in distinguishing between the above models.
With soft and hard X-ray data from the Yohkoh satellite, observational evidence has been found in support of the tether-cutting model (Moore et al., 2001), the breakout model (Wang et al., 2002; Sterling & Moore, 2004a), or both models (Sterling & Moore, 2004b). Using data from the Reuven Ramaty High Energy Solar Spectroscopic Imager (RHESSI), Ji et al. (2003) found simultaneous X-ray emission above and below a filament prior to its failed eruption during which the filament became kinked. They interpreted the higher altitude X-ray source as evidence of the breakout model. In the same event, Alexander et al. (2006) found additional X-rays emitted from the crossing of the two legs of the kinked filament. Chifor et al. (2006, 2007) examined RHESSI X-ray sources during the early stages of filament eruptions that favored the tether-cutting model. At the same time, Sui et al. (2006) reported possible signatures of the breakout model in an event involving multiple-loop interactions. In brief, evidence from these observations does not seem to converge on any one model, and which mechanism is predominant remains an open question.
In previous studies of filament eruptions accompanied by flares (except Liu & Alexander 2009), due to instrumental or observational limitations on imaging spectroscopy, very little attention was paid to the combined morphology and spectra of X-ray sources, which can provide crucial constraints for theoretical models. Instrumental limitations include the energy resolution (e.g., only four broad bands from 14 to 93 keV for the Yohkoh Hard X-ray Telescope vs. 1 keV FWHM for RHESSI) and dynamic range (e.g., 50:1 for RHESSI) of X-ray imagers. Unfavorable observational conditions include coronal sources being too weak to allow for imaging spectroscopy (e.g., Sui et al., 2006), especially in the presence of bright footpoint sources because of the limited dynamic range. In an attempt to fill this gap, we report here a detailed investigation of both morphology and spectra of the X-ray sources in a partially occulted flare observed by RHESSI, which accompanied a prominence eruption observed by the Transition Region and Coronal Explorer (TRACE). The occultation of the footpoint X-rays enabled us to detect the relatively faint emission high in the corona. The location near the limb helped minimize projection effects, which are a concern for events occurring on the solar disk.
One of our significant findings is that there are episodic morphological changes from a single coronal X-ray source to a double coronal source during the filament activation. Each occurrence of the double source structure coincides with an increased X-ray flux and plasma temperature, thus suggestive of an increased reconnection or energy release rate. Most of the time, the X-ray sources are located below the prominence apex, more in favor of the tether-cutting model than the breakout model. We present the observations in § 2, and conclude this paper with a summary and discussion in § 3.
2. Observations and Data Analysis
The event under study occurred at 15:30 UT on 2003 April 24 in AR 10339, which was very active, producing 10 C-class flares within two days from April 23 to 24. At the time of this event, AR 10339 had just rotated over the west limb. Its center is estimated to be at N16W93, whose occulted position on the sky plane is below the limb, according to the solar rotation and the AR location in a magnetogram taken one day earlier by the Solar and Heliospheric Observatory (SOHO) Michelson Doppler Imager (MDI). This event involved a prominence eruption accompanied by a C7.7 flare whose X-ray emission from the footpoints is occulted by the limb. There was no CME in a hour window according to the SOHO LASCO catalog. This event was well observed by RHESSI and TRACE. Complimentary data with lower cadence and/or spatial resolution were recorded by the SOHO Extreme Ultraviolet (EUV) Imaging Telescope (EIT) in EUV, by the Improved Solar Observing Optical Network (ISOON) in H, and by the Geostationary Operational Environment Satellite (GOES) Solar X-ray Imager (SXI) in soft X-rays.
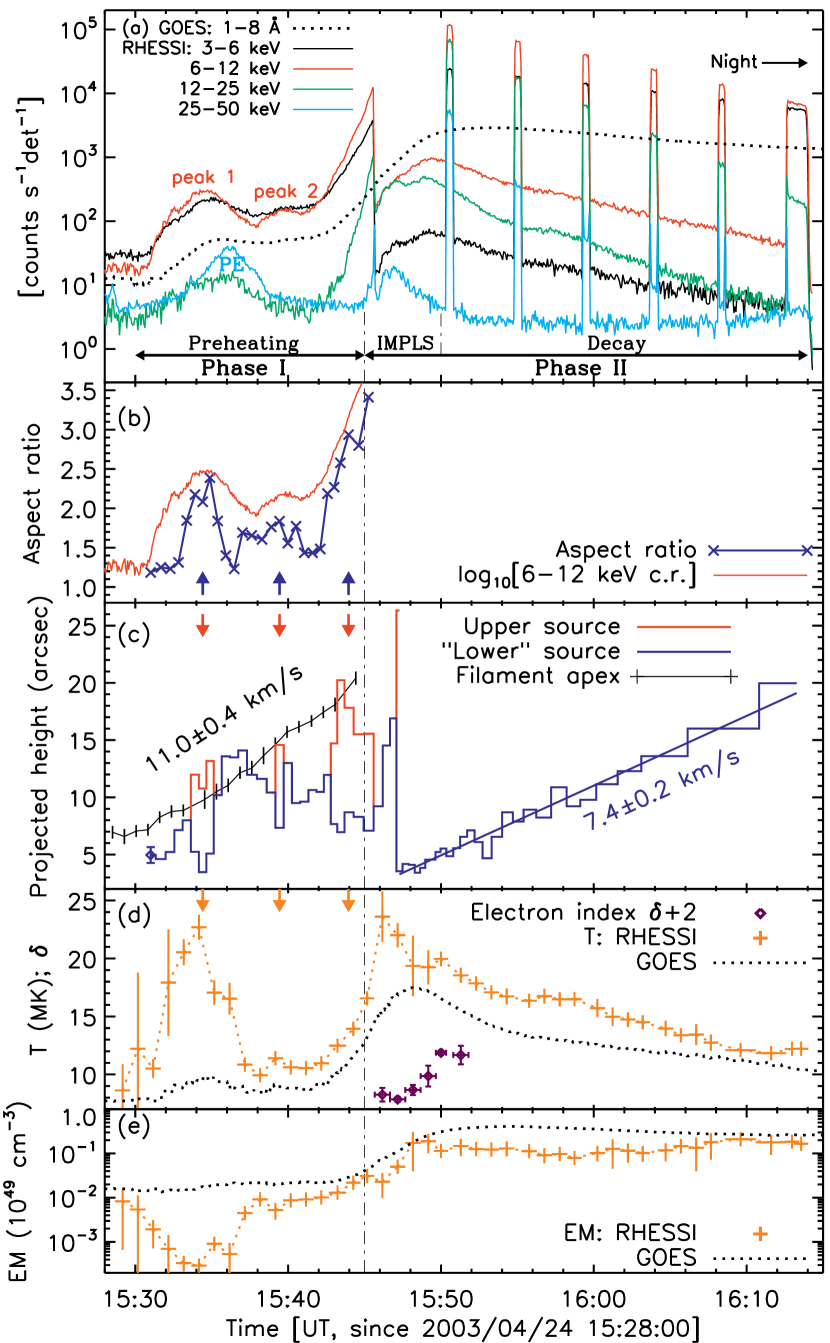
Figure 1a shows RHESSI and GOES X-ray light curves for this event. The interval of 15:45–15:50 UT with significant signal in the 25–50 keV channel above the background111The hump in the 25–50 keV curve peaking at 15:36 UT indicates a particle event (PE) from Earth’s radiation belt, which usually has a negligible contribution at low energies. When fitting spectra before 15:42 UT, we thus restricted ourselves to , above which the spectra flatten due to particle contamination. Particles have no effect on images other than adding noise, since they are not modulated by the grids. The method using the count rate ratio between the front and rear segments to remove particle counts (Liu et al., 2009) is generally good for 20–150 keV or large (M–X class) flares, and is not attempted here. is referred to as the impulsive phase (labeled “IMPLS”). The preceding interval (15:30–15:45 UT) is the preheating phase (e.g., Harrison, 1986), which we call Phase I and, according to the 6–12 keV count rate, includes two peaks and the rapid rise leading to the impulsive phase. As we will see later, this event exhibits various distinctions before and after the onset of the impulsive phase, and thus we call the combination of the impulsive and decay phases Phase II (15:45–16:14 UT).
We reconstructed RHESSI images in wide energy bands, 3–6, 6–10, and 10–15 keV, throughout the flare with the integration time (of integer numbers of the spacecraft spin period, 4 s) ranging from 24 s to 158 s, depending on the count rates. We used the front segments of detectors 3–8 giving a FWHM resolution of . Shortly into the impulsive phase, RHESSI’s thin attenuator moved in at 15:45:36 UT, raising the lower end of the measurable energy range from 3 to 6 keV, except for those short intervals in the open attenuator state (appearing as narrow steps in Fig. 1a). We primarily used the computationally expensive PIXON (Metcalf et al., 1996) and faster CLEAN (Hurford et al., 2002) algorithms for times before and after 15:45:36 UT, respectively. We cross-checked both algorithms in all cases.
We analyzed spatially integrated RHESSI spectra throughout the flare following the procedures detailed in Liu et al. (2008, see their Appendix A1). One important step was to fit the spectra of individual detectors (excluding detectors 2, 5, and 7) separately,222Treating detectors separately allows us to take advantage of statistically independent measurements of the same incident photon spectrum made by RHESSI’s nine nominally identical detectors. This also helps avoid the energy smearing inherent in the default procedure of averaging counts from different detectors that have slightly (10%) different energy bin edges and sensitivities. Detectors 2, 5, and 7 were not used for this analysis because of their higher energy thresholds and/or degraded energy resolution (Smith et al., 2002). and then average the results to obtain the best-fit parameters and use the standard deviations of the results as uncertainties. We also applied the pileup correction (pileup_mod) recently developed by R. Schwartz in the SolarSoft (SSW) package. In the attenuator open state before 15:45:36 UT, the spectra were fitted with two isothermal components, with the lower-temperature component representing the emission from a preceding flare elsewhere (N17W39) on the Sun whose hot plasma still undergoes cooling. When the thin attenuator is in (after 15:45:36 UT), we fitted the spectra with an isothermal plus nonthermal power-law mean electron flux (Brown et al., 2003, equivalent to the thin-target function in OSPEX) model.
TRACE had generally good coverage at 195 Å during this event except two 7 minute data gaps before and after 15:52 UT. TRACE data were processed with the standard SSW routines and radiation spikes were removed. To correct for the pointing offset, all TRACE images were shifted by and in the solar east-west () and south-north () directions, respectively, according to the cross-correlation between two neighboring TRACE (16:00:59 UT) and EIT (16:00:02 UT) 195 Å images (Gallagher et al., 2002). This coalignment is good to in both directions.
In the following two subsections we scrutinize the spatial and spectral evolution of the X-ray sources and the associated prominence activity during Phases I and II individually.
2.1. Phase I (15:30–15:45 UT): Flare Preheating and Prominence Activation
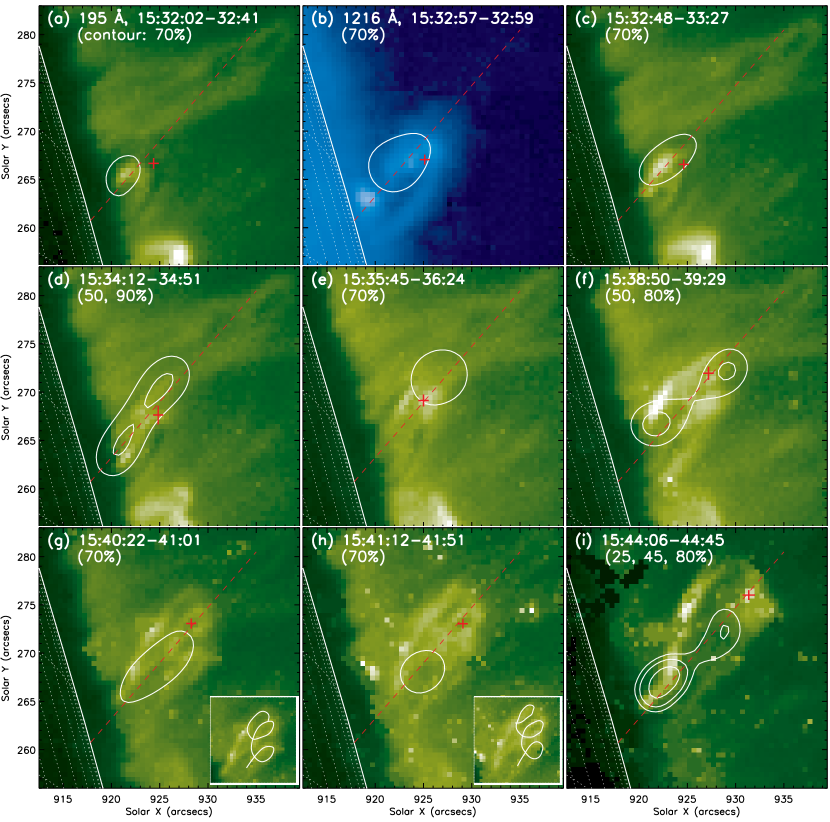
Phase I is the preheating period of the flare during which the prominence undergoes activation. Figure 2 shows the evolution of the prominence during this phase as seen by TRACE in EUV and of the X-ray emission seen by RHESSI. We find that simultaneous and cospatial X-ray and EUV brightenings appear at the northern leg of the prominence as early as 15:31:16 UT (e.g., Fig. 2a). Both emissions rapidly become elongated along the leg (Fig. 2c), and meanwhile the prominence apex, marked by the plus sign, gradually moves upward. At 15:34:12 (Fig. 2d) the X-ray emission splits into a double source, which we call the lower and upper coronal sources, the latter of which extends above the prominence apex. The X-ray emission then reverts back to a single source (Fig. 2e), located above the apex of the prominence, while the EUV emission spreads from the northern leg to other parts of the prominence. Through the rest of the preheating phase, the morphological transition of X-ray emission from a single source to a double source happens twice more (Figs. 2f and 2i). During its evolution, the prominence gradually unveils a helical structure in its top portion, which is best seen as three bright coils (Figs. 2g and 2h). (This is similar to that reported by Liu & Kurokawa (2004) and Li et al. (2005), except that the helical feature in their case appears during the flare impulsive phase and is located significantly below the erupting filament.) The prominence was last seen at 15:44:06–15:44:45 UT (Fig. 2i) just before the TRACE data gap.
We tracked emission centroids to investigate X-ray source motions. Before and after the thin attenuator came in at 15:45:36 UT, images at 3–6 and 6–10 keV were used, respectively. We utilized contours at 50% of the image maximum to locate the centroids, except that on occasions of a double source before 15:45:36 UT we employed two independent contours at within 5% of the minimum between the two sources. The resulting centroid locations are plotted in Figure 3c and fitted with a straight line (dashed). This line, at from the local vertical on the limb, defines the fiducial direction or main direction of motion of all features discussed in this paper. Here we define “projected height” of any feature as the projection in the fiducial direction of the distance from “S”, the crossing of the fiducial line with the limb. The projected heights of the centroids of the lower and upper coronal sources are shown in Figure 1c, and the standard deviation of the distance (perpendicular) to the fiducial line is used as the uncertainty shown on the first data point. Note that, at times of a single source, the centroid is assigned to the “lower” source in Figure 1.
There are three episodes of the splitting of a single source into a double source during Phase I, as marked by the vertical arrows (Fig. 1c, see also Fig. 2). This splitting can also be represented by an increase in the aspect ratio of the entire X-ray emission, defined as the maximum of the ratio of the standard deviation (or second moment) of the source region along any two orthogonal directions. The aspect ratio averaged between the results obtained from 3–6 and 6–10 keV images before 15:45:36 UT is shown in Figure 1b (while this analysis was not attempted after 15:45:36 UT due to complex source morphology as we will see later). We find a positive temporal correlation between the aspect ratio and X-ray flux. Specifically, the three episodes (marked by three arrows) of large values of the aspect ratio coincide with the first two X-ray peaks and the rapid rise leading to the impulsive phase. Spectral analysis indicates high temperatures at these times (Fig. 1d), and particularly the temperature at the first two X-ray peaks reaches its local maxima of (15:33:40–15:34:40 UT) and (15:38:40–15:39:40 UT). These observations suggest higher magnetic reconnection rates or energy release rates occurring at times of the morphological transition from a single source to a double source. A more extensive discussion on this is offered in § 3.
To quantify the motion of the prominence, we tracked the center of the absorption feature at the prominence apex or its best estimate based on morphological interpolation between the two legs. In the late stage (since 15:37 UT) when the absorption is obscure but the helical structure is more evident, we followed the center of the central coil. We repeated this with four independent measurements and used their average as the final result. The square root of the quadrature sum of the standard deviation of the measurements and the TRACE FWHM is used as the uncertainty in each of the and directions. The resulting apex locations and their uncertainties are shown as plus signs in Figure 2. They were then projected onto the fiducial direction defined above (shown also in Fig. 2) to find their projected heights above the limb, whose history is shown in Figure 1c. As can be seen, the prominence shows no significant motion until the onset (15:30 UT) of the flare preheating phase. A linear fit to the projected filament height between 15:30 and 15:44 UT indicates a velocity of , similar to those () observed in the filament slow-rise phases of other events (e.g., Moore & Sterling, 2006; Chifor et al., 2007).
Finally, we compare the positions of the X-ray sources relative to the prominence in greater detail as shown in Figure 1c. The X-rays are initially emitted below the prominence apex. The projected height of the apex then resides between the two X-ray sources during the first double-source episode (15:33:38–15:35:07 UT), followed by a period (15:35:40–15:37:17 UT) when the apex is located below the single source (by at 15:36 UT). During the rest of Phase I when the prominence has risen well above the limb (), the X-ray sources, in either a single or a double source morphology, are primarily below the prominence apex. We discuss the implications of these observations in § 3.
2.2. Phase II (15:45–16:14 UT): Flare Impulsive and Decay Phases and Prominence Eruption
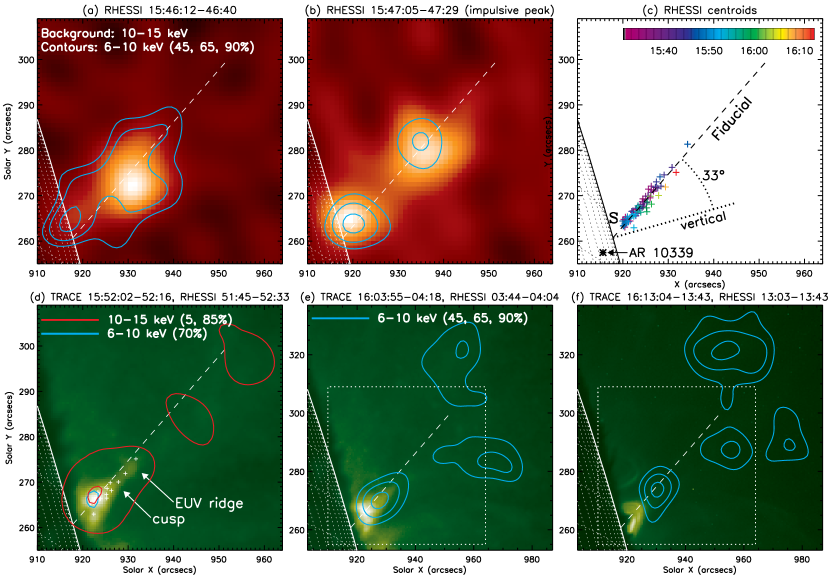
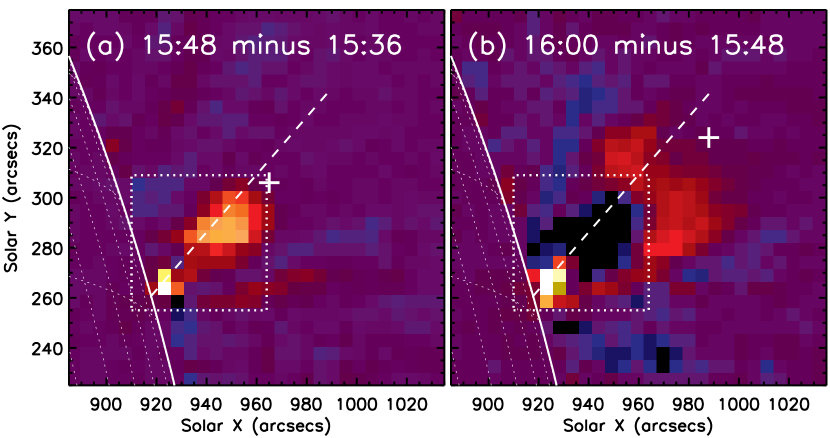
Phase II consists of the impulsive (15:45–15:50 UT) and decay (15:50–16:14 UT) phases of the flare, during the former of which the prominence undergoes eruption. As mentioned above, the prominence is last seen by TRACE at 15:44 UT (Fig. 2i) just before the data gap. At the end of the gap (15:52 UT), a post-eruption cusp (Fig. 3d) already appears at the original location of the prominence. Meanwhile, the prominence is last imaged in H by ISOON (resolution: vs. TRACE’s , cadence: 5 minutes) at 15:40 UT, beyond which it is presumably too faint to be detected. Beyond the TRACE and ISOON coverage, we located the leading edge of the eruption from SOHO EIT 195 Å running difference images (Fig. 4). This edge is last detected at 16:00 UT at a projected height of above the limb. Differencing the heights at 15:48 and 16:00 UT gives a velocity of , roughly consistent with the final velocity of at 15:44 UT inferred from TRACE data. After another data gap (15:53-16:00 UT), we find in TRACE 195 Å images a series of post-flare loops (with a cusp on the top) which appear to grow to larger loops at higher altitudes (e.g., Figs. 3e and 3f). This is consistent with the classical flare model (CSHKP, Carmichael, 1964; Sturrock, 1966; Hirayama, 1974; Kopp & Pneuman, 1976). These observations indicate that the prominence erupts during the flare impulsive phase.
We now examine the spatial and spectral evolution of flare X-rays. Early (15:45:40–15:47:05 UT) during the impulsive phase after the thin attenuator moves in, the X-ray emission displays a complex morphology (e.g., Fig. 3a) from which well-defined individual sources cannot be identified. For this period of time, we used the centroid of the overall X-ray emission to represent the source location (Fig. 1c). At the peak (15:47:05–15:47:29 UT, Fig. 3b) of the impulsive phase, two coronal sources are clearly imaged and their centroid positions are shown in Figure 1c. Beyond this time, there are either multiple upper coronal sources (e.g., Figs. 3d–3f) or a single upper source much dimmer than 50% of the image maximum, and thus we only show the centroid position of the lower source, which gradually moves upward at a velocity of indicated by the linear fit.
RHESSI spectral analysis indicates that the hot X-ray emitting plasma is rapidly heated at the beginning of the impulsive phase and then undergoes gradual cooling. The temperature decreases from at 15:45:40–15:46:40 UT to at 16:10:36–16:12:36 UT (Fig. 1d), while the emission measure increases by about 10 times from to at 15:48:40–15:49:40 UT and then remains roughly constant within a factor of 2 (Fig. 1e). As expected, GOES data yield a lower temperature and higher emission measure, because GOES is more sensitive to cooler plasma than RHESSI. In addition to the thermal emission, RHESSI spectra indicate a nonthermal component during the impulsive phase. The spectral index of the power-law mean electron flux shows the usual soft-hard-soft evolution, with the minimum (hardest) occurring at the impulsive peak.
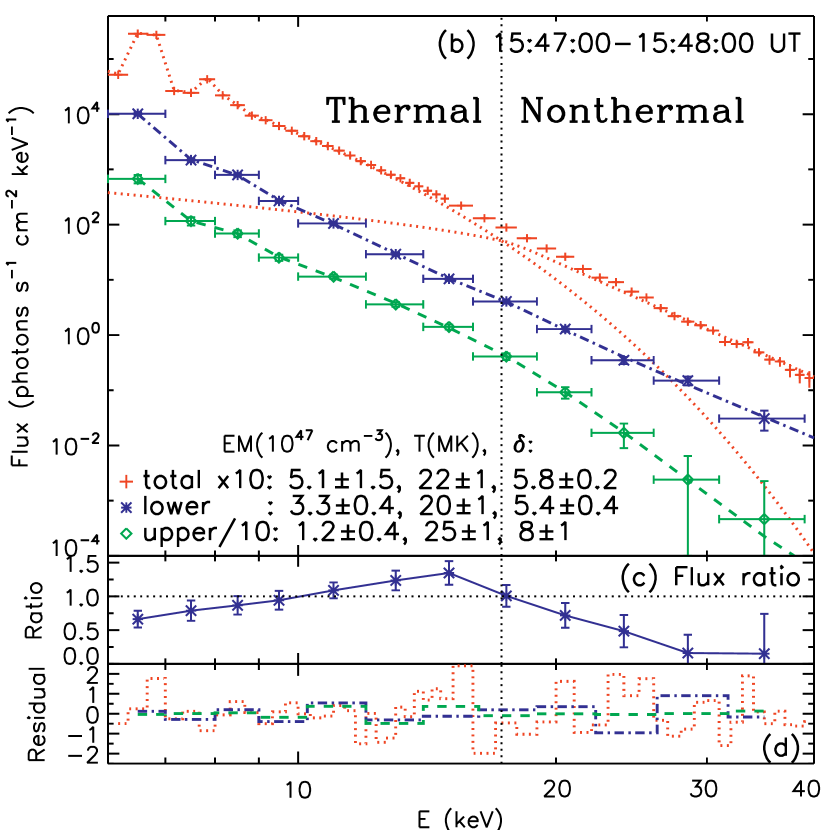
We also conducted imaging spectroscopic analysis for the interval of 15:47:00–15:48:00 UT that covers the peak of the impulsive phase. To do this, we first made PIXON images in 13 progressively wider energy bins (from 1 to 11 keV) in the 6–50 keV range. A sample of these images is shown in Figure 5a as contours superimposed on a later (15:52 UT) TRACE 195 Å image. There is a strong source located in the low corona and two weak sources333Note that photons from the two upper sources, primarily emitted during the second half of the integration time 15:47:00–15:48:00 UT, dominate over photons from the single upper source mostly emitted during the first half. Therefore the overall integration yields a structure of two upper sources, while the image shown in Fig. 3b indicates only one upper source. higher up. As an independent confirmation, neighboring GOES SXI images show a teardrop-shaped soft X-ray source, which is consistent with the convolution of the multiple RHESSI sources and SXI’s gross resolution ( FWHM, pixels). We integrated the photon fluxes enclosed in the two white-dotted circles for the lower and upper coronal sources. The resulting spectra (see Fig. 5b) were fitted with the same model (isothermal plus power-law mean electron flux) as used for the spatially integrated spectra. We find that the upper sources have a higher temperature ( vs. ) but a lower emission measure than the lower source, and the temperature () obtained from the spatially integrated spectrum of the same interval sits in between. On the other hand, the upper sources have a softer nonthermal component ( vs. ). These spectral differences can also be seen from the upper-to-lower flux ratio of the two spectra shown in Figure 5c.
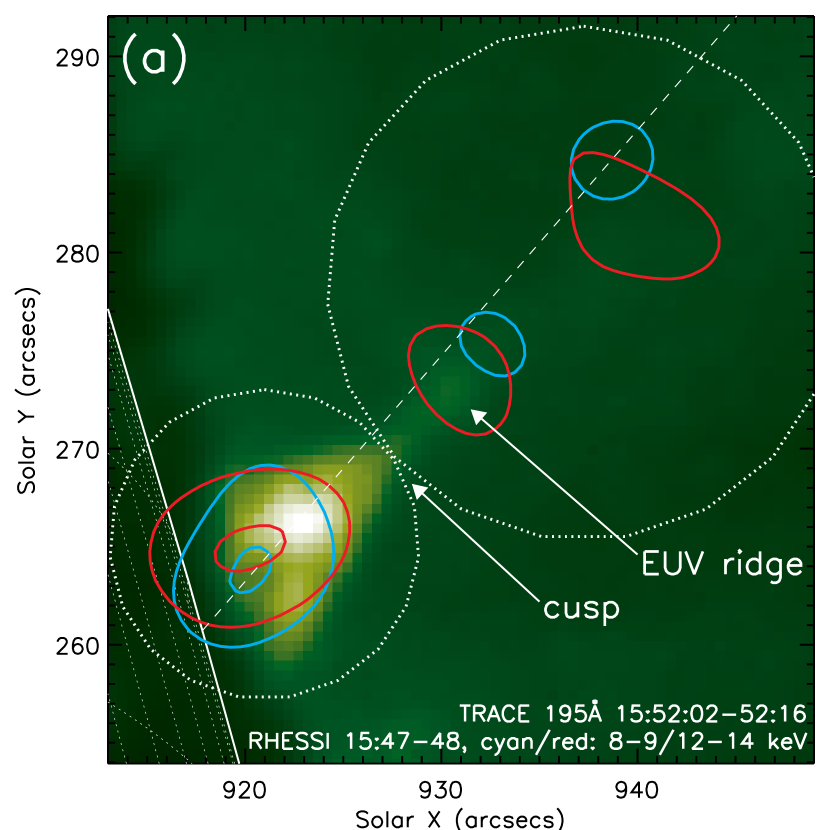
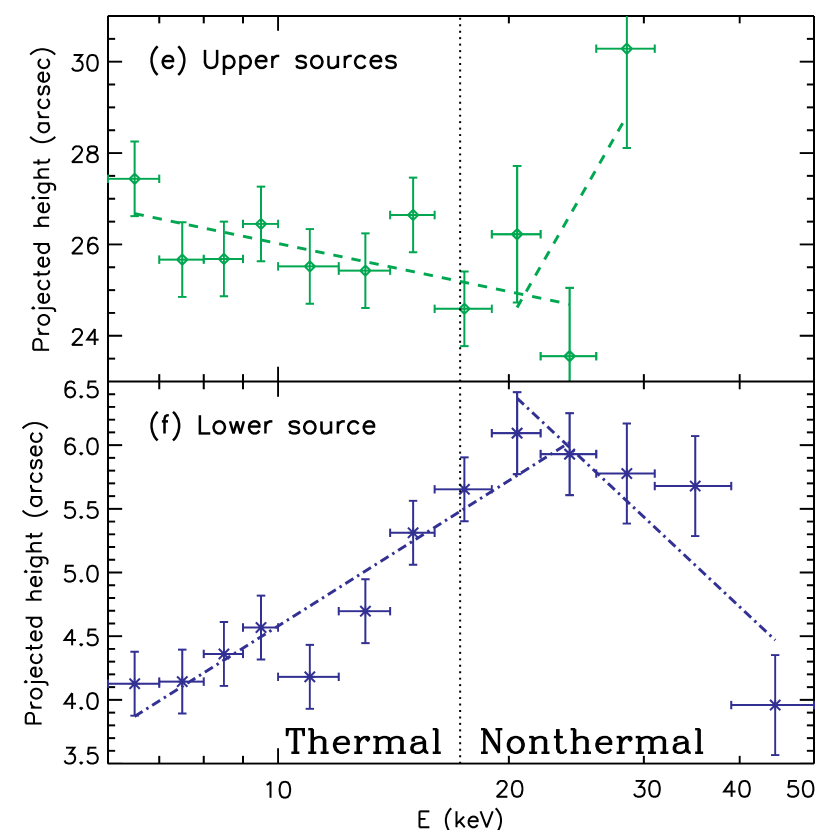
Close scrutiny of the images obtained above reveals an energy dependent source structure. That is, the lower coronal source shifts to higher altitudes with increasing energies, while the upper coronal sources shift to lower altitudes (e.g., Fig. 5a). At even higher energies this trend is reversed (see § 3 for a discussion). To be quantitative, the projected heights of the centroids of the two regions are shown in Figures 5e and 5f as a function of energy. We further applied linear fits to the data in two energy ranges, 6–26 and 19–50 keV, in which the overlap of 19–26 keV is considered as the transition in between. The RMS deviations of the data from the fits are used to estimate the uncertainties. The linear fits indicate that, from 6 to 26 keV, the projected heights of the lower centroid increases by , while that of the upper centroid decreases by . These observations are very similar to those of Liu et al. (2008, see their Fig. 4) and of Sui & Holman (2003), and suggest that magnetic reconnection occurs between the two regions, presumably in a current sheet which is oriented along the line connecting the two centroids. This scenario is further supported by our new observation of the cusp and the current-sheet-like feature or ridge444 Sui et al. (2006) found a coronal X-ray source at the location where an EUV ridge (above a cusp) appeared later. That source, however, was too weak to allow detailed imaging or spectral analysis. above it seen at 195 Å by TRACE 4 minutes later555There is no simultaneous TRACE image during the impulsive phase due to the data gap noted earlier. (Fig. 5a). (The width of the ridge is or 2200 km.) In addition, the three RHESSI X-ray sources are nearly in a straight line along the EUV ridge.
Nearly simultaneous RHESSI and TRACE images (see Fig. 3d) taken around 15:52 UT, 2 minutes after the impulsive phase, show a similar situation except that all RHESSI sources have shifted to higher altitudes and the upper sources have become even weaker. We find that the centroid of the lower coronal source at 6–10 keV is located below the cusp and cospatial with the EUV brightening, while the upper sources are above the cusp and dispersed along the extended EUV ridge. (Earlier at the impulsive peak during the TRACE data gap, we speculate that an EUV cusp and ridge also exist at similar positions relative to the X-ray sources, but at lower altitudes.) According to the spatially integrated spectrum at this time, the X-ray emitting plasma has a temperature of . The cospatial 195 Å emission can be explained by the high-temperature response of this TRACE channel due to Fe XXIV line (peak at 16 MK) emission (Phillips et al., 2005). Later in the decay phase (Figs. 3e and 3f), the lower (hot) X-ray source is located above the cooler EUV post-flare loops as seen in many other flares (e.g., Gallagher et al., 2002). There are also multiple X-ray sources (Figs. 3e and 3f) at significantly higher altitudes that are located away from the direction of the EUV current-sheet-like feature and from the fiducial direction of motion. We speculate that these sources are at the tops of hot post-flare loops. They are heated either in-situ as a result of local magnetic reconnection induced by the prominence eruption, or from chromospheric evaporation in response to electron beam or conductive heating at the footpoints.
3. Summary and Discussion
We have presented RHESSI X-ray and TRACE EUV observations of a C7.7 flare accompanying a prominence eruption. This event exhibits two distinct phases whose characteristics are summarized as follows:
1. Phase I is marked with the preheating of the flare and the activation and rise of the prominence. Phase II includes the flare impulsive phase, which accompanies the prominence eruption, and the flare decay phase (Fig. 1a). Thermal X-rays are present in both Phases I and II with peak temperatures of and , respectively. There is nonthermal emission during the impulsive phase with the minimum (hardest) power-law index of the mean electron flux (Fig. 1d).
2. During Phase I there are three episodes of morphological changes of the X-ray emission from a single source to a double source (Figs. 1c and 2). Each episode coincides with an increased X-ray flux and plasma temperature (Figs. 1b and 1d), suggestive of faster magnetic reconnection or a larger energy release rate. However, the prominence motion does not show an obvious corresponding episodic behavior, except that its eruption occurs during the flare impulsive phase.
3. Most of the time, the X-ray emission is located primarily below the apex of the prominence. Only for 4 minutes (15:33–15:37 UT) during the middle stage of Phase I, some or all X-rays are emitted from above the apex (Fig. 1c). In particular, the initial X-ray emission occurs at the northern leg of the prominence (Fig. 2a). Since X-rays at this time are primarily thermal emission, a signature of hot plasma presumably heated as a consequence of magnetic reconnection, these observations support the tether-cutting model (Moore & Roumeliotis, 1992) over the breakout model (Antiochos, 1998) for triggering solar eruptions.
4. During the impulsive phase, the X-ray sources display an energy-dependent structure (Figs. 5e and 5f). That is, higher energy emission is closer together toward the EUV cusp in the thermal regime (20 keV), with a reversed trend in the nonthermal regime (see the discussion below). In addition, there is a bright EUV ridge extending from the cusp to higher altitudes, which is aligned with the multiple X-ray sources (Fig. 5a). These observations suggest the existence of a current sheet, most likely trailing the erupting prominence, as predicted by the classical CSHKP flare model. Compared with previously reported X-ray signatures of current sheets (e.g., Sui & Holman, 2003; Sui et al., 2006; Liu et al., 2008), the combination of these X-ray and EUV observations represents another example with additional information.
5. During the impulsive phase, the upper coronal sources have a higher temperature ( vs. ) but lower emission measure ( vs. ) than the lower coronal source (Fig. 5b). This is expected and consistent with the finding of Liu et al. (2008), who proposed differences in magnetic connectivity to be the primary cause. On the other hand, the nonthermal spectra of Liu et al. (2008) show similar power-law indexes in the two regions. However, the upper sources in our case show much softer ( vs. ) nonthermal emission, suggestive of a particle acceleration rate or efficiency different from that of the lower source. An alternative explanation is that the lower source is thick-target emission, while the upper sources are thin-target. This is because the difference () of the electron power-law indexes of the two regions equals that () of the photon indexes, since the functional forms of the fits are identical for both regions. It then follows , which is consistent with the predicted value of between the thin- and thick-target cases (e.g., Brown, 1971; Lin & Hudson, 1971; Petrosian, 1973). This interpretation qualitatively agrees with the inferred higher emission measure and possibly higher density for the lower source.
In what follows, we further discuss the implications of some of our observations:
1. The elongation and splitting of a single X-ray source into a double source was previously observed near the onset of the impulsive phase (Sui & Holman, 2003; Veronig et al., 2006; Wang et al., 2007; Liu et al., 2008), similar to what happens near 15:47 UT in this flare. This was interpreted as the signature of the formation of a large-scale current sheet through the transformation from an X null point to a double-Y shaped magnetic topology (Sui & Holman, 2003), or as evidence of the development of fast reconnection occurring in a pre-existing current sheet (Liu et al., 2008). It is likely that, in this event, the three episodes of source splitting during the flare preheating and prominence activation phase reflect the same signature of reconnection in a current sheet. However, in the previously reported events, such splitting occurs around the onset of the impulsive phase and occurs only once, while in this event it happens prior to the impulsive phase and it happens three times. Possible reasons behind this difference are as follows.
In this and the previously reported larger (M–X class) events, the source splitting at the beginning of the impulsive phase takes place in a simple, large-scale current sheet at the onset of fast reconnection as predicted in the classical CSHKP picture. Once it happens, reconnection goes into a runaway situation, leading to explosive energy release. This scenario is supported by the observations (see Fig. 1c) of this event that (1) the impulsive phase does not start until the erupting prominence is significantly high ( or 15 Mm) above the limb and thus presumably until a large-scale current sheet is created in its wake; and (2) early in the impulsive phase the X-ray emission (presumably near the reconnection site) is located below the prominence apex and thus possibly situated in the large-scale current sheet.
In contrast, it is likely that the source splitting prior to the impulsive phase in this event takes place episodically in localized, small-scale current sheets located in the prominence or its vicinity. Each episode occurs in a different current sheet, which is shortly dissipated away by reconnection, giving rise to moderate energy release, an increased plasma temperature, and an enhanced X-ray flux during the preheating phase. Such episodic reconnection could happen as: (1) tether-cutting reconnection in small-scale current sheets between oppositely aligned field lines in a sheared core (Moore & Roumeliotis, 1992), or (2) reconnection in curved current sheets around a kinked, pre-existing twisted flux rope (Kliem et al., 2004; Fan, 2005). In the former case, a flux rope could be formed via reconnection (van Ballegooijen & Martens, 1989), which, at the same time, can increase the twist or helicity of the rope. The helical structure seen in the late stage of the filament activation (e.g., Fig. 2g) is a possible indicator of the increased twist. In the latter case, the kink instability converts the twist helicity into the writhe helicity of the flux rope. The observed helical feature may be the manifestation of the writhe. (3) There is a third possibility that the above two scenarios are both present, but in different stages of the evolution. That is, early in the preheating phase, tether-cutting reconnection could episodically develop and increase the twist of the flux rope. Once the twist exceeds a threshold, the flux rope becomes kink unstable, leading to the transition to the impulsive phase. Our observations do not allow us to differentiating between these three possibilities, partly because of loss of information of activity in the lower atmosphere behind the limb. After the initiation, however, the interlaced periods of X-ray emission being below and above the prominence apex (Fig. 1c) suggest a circular chain of positive feedback from both reconnection and prominence activity (Moore & Sterling, 2006; Chifor et al., 2006).
2. The reversal of the trend in the energy dependence of the centroid heights (Fig. 5c) confirms the result discovered by Liu et al. (2008). According to the spatially integrated spectrum shown in Figure 5b, the thermal and nonthermal components intersect at . (1) Below this energy, thermal emission dominates and thus the energy-dependent source structure simply implies X-ray emitting plasma of higher temperatures (but lower emission measures) being closer to the reconnection site located between the lower and upper sources (Sui & Holman, 2003). This was interpreted and generalized by Liu et al. (2008) in the framework of stochastic acceleration by turbulence or plasma waves (Petrosian & Liu, 2004). Such a scenario for the lower coronal (loop-top) source alone was also modeled with a collapsing trap (Karlický & Kosugi, 2004) by Veronig et al. (2006). (2) Above , the emission is mainly nonthermal and the reversal of the trend at 20 keV indicates a transition from thermal to nonthermal dominance. It may further imply increasing importance of transport effects of nonthermal electrons (Liu et al., 2008). That is, higher energy electrons have larger stopping column densities and they tend to produce bremsstrahlung at greater distances from their acceleration site. This is more likely to be true for the lower source, given its stronger signature of the trend reversal (Fig. 5f) and the possibility of thick-target emission noted above (Item 5). Sui & Holman (2003) also found a jump of the centroid position at 17 keV and interpreted it as a thermal-to-nonthermal transition.
We are currently analyzing data from the SOHO Solar Ultraviolet Measurements of Emitted Radiation (SUMER) for this and other events from this active region. The inferred temperatures and Doppler velocities may shed light on the nature of the high coronal X-ray sources mentioned earlier (see Figs. 3e and 3f), and will be presented in a separate publication. The observations presented here also point to a promising direction for future investigations, that is, to closely follow the evolution of the morphology and spectra of the X-ray emission and of the accompanied prominence activity. We look forward to carrying out such studies using better data from current and future missions such as the Solar Dynamics Observatory (SDO).
References
- Alexander et al. (2006) Alexander, D., Liu, R., & Gilbert, H. R. 2006, ApJ, 653, 719
- Antiochos (1998) Antiochos, S. K. 1998, ApJ, 502, L181
- Brown (1971) Brown, J. C. 1971, Sol. Phys., 18, 489
- Brown et al. (2003) Brown, J. C., Emslie, A. G., & Kontar, E. P. 2003, ApJ, 595, L115
- Carmichael (1964) Carmichael, H. 1964, in The Physics of Solar Flares, ed. W. N. Hess, 451
- Chifor et al. (2006) Chifor, C., Mason, H. E., Tripathi, D., Isobe, H., & Asai, A. 2006, A&A, 458, 965
- Chifor et al. (2007) Chifor, C., Tripathi, D., Mason, H. E., & Dennis, B. R. 2007, A&A, 472, 967
- Fan (2005) Fan, Y. 2005, ApJ, 630, 543
- Fan & Gibson (2003) Fan, Y. & Gibson, S. E. 2003, ApJ, 589, L105
- Gallagher et al. (2002) Gallagher, P. T., Dennis, B. R., Krucker, S., Schwartz, R. A., & Tolbert, A. K. 2002, Sol. Phys., 210, 341
- Handy et al. (1999) Handy, B. N., Tarbell, T. D., Wolfson, C. J., Korendyke, C. M., & Vourlidas, A. 1999, Sol. Phys., 190, 351
- Harrison (1986) Harrison, R. A. 1986, A&A, 162, 283
- Harrison et al. (1985) Harrison, R. A., Waggett, P. W., Bentley, R. D., Phillips, K. J. H., Bruner, M., Dryer, M., & Simnett, G. M. 1985, Sol. Phys., 97, 387
- Hirayama (1974) Hirayama, T. 1974, Sol. Phys., 34, 323
- Hurford et al. (2002) Hurford, G. J., Schmahl, E. J., Schwartz, R. A., Conway, A. J., Aschwanden, M. J., Csillaghy, A., Dennis, B. R., Johns-Krull, C., et al. 2002, Sol. Phys., 210, 61
- Ji et al. (2003) Ji, H., Wang, H., Schmahl, E. J., Moon, Y.-J., & Jiang, Y. 2003, ApJ, 595, L135
- Karlický & Kosugi (2004) Karlický, M. & Kosugi, T. 2004, A&A, 419, 1159
- Kliem et al. (2004) Kliem, B., Titov, V. S., & Török, T. 2004, A&A, 413, L23
- Kopp & Pneuman (1976) Kopp, R. A. & Pneuman, G. W. 1976, Sol. Phys., 50, 85
- Li et al. (2005) Li, J., Mickey, D. L., & LaBonte, B. J. 2005, ApJ, 620, 1092
- Lin & Hudson (1971) Lin, R. P. & Hudson, H. S. 1971, Sol. Phys., 17, 412
- Liu & Alexander (2009) Liu, R. & Alexander, D. 2009, accepted by ApJ
- Liu et al. (2009) Liu, W., Petrosian, V., Dennis, B. R., & Holman, G. D. 2009, ApJ, 693, 847
- Liu et al. (2008) Liu, W., Petrosian, V., Dennis, B. R., & Jiang, Y. W. 2008, ApJ, 676, 704
- Liu & Kurokawa (2004) Liu, Y. & Kurokawa, H. 2004, PASJ, 56, 497
- Low & Zhang (2002) Low, B. C. & Zhang, M. 2002, ApJ, 564, L53
- Metcalf et al. (1996) Metcalf, T. R., Hudson, H. S., Kosugi, T., Puetter, R. C., & Pina, R. K. 1996, ApJ, 466, 585
- Moore & Roumeliotis (1992) Moore, R. L. & Roumeliotis, G. 1992, in Lecture Notes in Physics, Berlin Springer Verlag, Vol. 399, IAU Colloq. 133: Eruptive Solar Flares, ed. Z. Svestka, B. V. Jackson, & M. E. Machado, 69
- Moore & Sterling (2006) Moore, R. L. & Sterling, A. C. 2006, AGU Geophys. Monog. Series: Solar Eruptions and Energetic Particles, Eds. N. Gopalswamy, R. Mewaldt, & J. Torsti (Washington DC), 165, 43
- Moore et al. (2001) Moore, R. L., Sterling, A. C., Hudson, H. S., & Lemen, J. R. 2001, ApJ, 552, 833
- Petrosian (1973) Petrosian, V. 1973, ApJ, 186, 291
- Petrosian & Liu (2004) Petrosian, V. & Liu, S. 2004, ApJ, 610, 550
- Phillips et al. (2005) Phillips, K. J. H., Chifor, C., & Landi, E. 2005, ApJ, 626, 1110
- Smith et al. (2002) Smith, D. M., Lin, R. P., Turin, P., Curtis, D. W., Primbsch, J. H., Campbell, R. D., Abiad, R., Schroeder, P., et al. 2002, Sol. Phys., 210, 33
- Sterling & Moore (2004a) Sterling, A. C. & Moore, R. L. 2004a, ApJ, 602, 1024
- Sterling & Moore (2004b) —. 2004b, ApJ, 613, 1221
- Sturrock (1966) Sturrock, P. A. 1966, Nature, 211, 695
- Sui & Holman (2003) Sui, L. & Holman, G. D. 2003, ApJ, 596, L251
- Sui et al. (2006) Sui, L., Holman, G. D., & Dennis, B. R. 2006, ApJ, 646, 605
- Tandberg-Hanssen (1995) Tandberg-Hanssen, E. 1995, The nature of solar prominences (Dordrecht; Boston: Kluwer)
- Török & Kliem (2005) Török, T. & Kliem, B. 2005, ApJ, 630, L97
- van Ballegooijen & Martens (1989) van Ballegooijen, A. A. & Martens, P. C. H. 1989, ApJ, 343, 971
- van Hoven & Hurford (1984) van Hoven, G. & Hurford, G. J. 1984, Advances in Space Research, 4, 95
- Veronig et al. (2006) Veronig, A. M., Karlický, M., Vršnak, B., Temmer, M., Magdalenić, J., Dennis, B. R., Otruba, W., & Pötzi, W. 2006, A&A, 446, 675
- Wang et al. (2007) Wang, T. J., Sui, L., & Qiu, J. 2007, ApJ, 661, L207
- Wang et al. (2002) Wang, T. J., Yan, Y., Wang, J., Kurokawa, H., & Shibata, K. 2002, ApJ, 572, 580
- Williams et al. (2005) Williams, D. R., Török, T., Démoulin, P., van Driel-Gesztelyi, L., & Kliem, B. 2005, ApJ, 628, L163