\runauthorC. Gwenlan
Combined HERA Deep Inelastic Scattering Data and NLO QCD Fits
Abstract
Previously published data on inclusive neutral and charged current and deep inelastic scattering from HERA have been combined. The new, model-independent method of combining the measured cross sections takes full account of correlated systematics in a coherent way, leading to significantly reduced uncertainties in the combined measurement across the plane. The combined cross section data have been used as the sole input for a new next-to-leading order QCD fit to extract the parton distribution functions (PDFs) of the proton. The PDFs extracted have greatly reduced experimental uncertainties, compared to separate QCD analyses on data from H1 and ZEUS. Model uncertainties, including those arising from the parameterisation dependence, have also been carefully considered. The resulting HERA PDFs have impressive precision.
1 Introduction
The deep inelastic lepton-nucleon scattering (DIS) process, in which a point-like lepton probes a single, initial state hadron, is an ideal environment in which to study quantum chromodynamics (QCD), and constrain the parton distribution functions (PDFs) of the proton.
The HERA collider ceased running in June 2007, following 15 years of successful operation. During HERA I running (1992-2000), the H1 and ZEUS experiments each collected approximately of and of data. This has allowed precision measurements of inclusive neutral (NC) and charged (CC) current DIS cross sections, which have already proved fundamental to the rapid development in understanding of QCD and the structure of the proton.
In these proceedings, a joint H1 and ZEUS analysis is presented, in which previously published NC and CC inclusive DIS cross section measurements from the two collider experiments are combined. The combination method [1] uses an iterative minimisation, which carefully takes into account the correlations within the data that result from different sources of uncertainty. The key assumption is that the measurements from H1 and ZEUS represent a common truth. Thus, forcing them to agree results in a strong constraint which cross-calibrates the measurements, resulting in significantly reduced overall uncertainties. The combined HERA data have subsequently been used as the sole input to a next-to-leading (NLO) QCD fit to determine the proton PDFs. This analysis is also discussed in the present contribution.
The results on the combined HERA data, as presented here, were first released to the LP Conference in 2007 [2], and the NLO QCD analysis was first presented at DIS 2008 [3]. Both analyses should be seen as part of a mid-term strategy. They will be followed by future data combinations, including even more accurate data from both HERA I and HERA II, and by further QCD analyses to extract the proton PDFs.
2 HERA physics and kinematics
Lepton-proton DIS can proceed either via the neutral current (NC) interaction (through the exchange of a or ), or via the charged current (CC) interaction (through the exchange of a ). The kinematics of lepton-proton DIS are described in terms of the Bjorken scaling variable, , the negative invariant mass squared of the exchanged vector boson, , and the fraction of energy transferred from the lepton to the proton system (in the rest frame of the proton), . The three quantities are related by , where is the centre-of-mass energy squared.
At leading order (LO) in the electroweak interaction, the reduced cross section, , for the NC DIS process can be expressed in terms of proton structure functions,
where is the fine structure constant and describes the helicity dependence of the electroweak interaction. The structure functions, which depend on , are directly related to PDFs of the proton, and their dependence is predicted by perturbative QCD. In particular, and depend directly on the quark distributions. For , dominates the scattering cross section and for , itself is dominated by sea quarks while the dependence is driven by gluon radiation. has been measured over 4 orders of magnitude in , to a precision of at HERA I. Therefore, HERA data have already provided vital information on the sea-quarks and gluon at low . At high , the contribution from becomes increasingly significant and gives information on the valence quarks.
At LO, the CC cross sections are given by,
so that a measurement of the and cross sections provides information on the - and -valence quarks, respectively, thereby allowing the separation of flavour.
3 Combination of HERA DIS data
In this section, the joint H1 and ZEUS combined data analysis is described. The goal of the study is to obtain DIS cross sections of best possible accuracy in order produce precise extractions of the proton PDFs. A new NLO QCD analysis, in which the results of the combination are used as the sole input, is described in Sec. 4.
3.1 Combination Method
The averaging procedure uses the Lagrange Multiplier (or Hessian) method [4]. The only theoretical input to the combination is that there is a true value of the cross section for each process, at each value [2, 5]. The correlated systematic uncertainties are floated coherently such that each experiment calibrates the other one. This results in a significant reduction of the correlated systematic uncertainty over much of the kinematic plane.
In the combination procedure, the following probability distribution of a measurement quantity, , represented as a function, is minimised:
| (1) |
Here, are the measured central values, and are the statistical and uncorrelated systematic uncertainties of the quantity . The are their true values; are parameters for the sources of systematic uncertainty and denotes the sensitivity of point to source . For the cross section measurements, the index labels a particular measurement at a given . Equation 3.1 represents the correlated probability distribution function for the quantity and for the systematic uncertainties .
The defined in Eq. 3.1 has, by construction, a minimum for and . The total uncertainty for determined from the formal minimisation of Eq. 3.1 is equal to the quadratic sum of the statistical and systematic uncertainties. The covariance matrix cov() quantifies the correlation between experimental points.
In the analysis of more than one data set, a total function, , is constructed from the sum of the functions for each data set. The function can be minimised with respect to and : this minimisation corresponds to a generalisation of the averaging procedure which takes account of correlations between different data sets.
| data set | range | range () | () | comment | ref. | |||
|---|---|---|---|---|---|---|---|---|
| H1 NC min. bias | 97 | 0.00008 | 0.02 | 3.5 | 12 | 1.8 | GeV | [6] |
| H1 NC low | 96-97 | 0.000161 | 0.20 | 12 | 150 | 17.9 | GeV | [6] |
| H1 NC | 94-97 | 0.0032 | 0.65 | 150 | 30000 | 35.6 | GeV | [7] |
| H1 CC | 94-97 | 0.013 | 0.40 | 300 | 15000 | 35.6 | GeV | [7] |
| H1 NC | 98-99 | 0.0032 | 0.65 | 150 | 30000 | 16.4 | GeV | [8] |
| H1 CC | 98-99 | 0.013 | 0.40 | 300 | 15000 | 16.4 | GeV | [8] |
| H1 NC | 99-00 | 0.00131 | 0.65 | 100 | 30000 | 65.2 | GeV | [9] |
| H1 CC | 99-00 | 0.013 | 0.40 | 300 | 15000 | 65.2 | GeV | [9] |
| ZEUS NC | 96-97 | 0.00006 | 0.65 | 2.7 | 30000 | 30.0 | GeV | [10] |
| ZEUS CC | 94-97 | 0.015 | 0.42 | 280 | 17000 | 47.7 | GeV | [11] |
| ZEUS NC | 98-99 | 0.005 | 0.65 | 200 | 30000 | 15.9 | GeV | [12] |
| ZEUS CC | 98-99 | 0.015 | 0.42 | 280 | 30000 | 16.4 | GeV | [13] |
| ZEUS NC | 99-00 | 0.005 | 0.65 | 200 | 30000 | 63.2 | GeV | [14] |
| ZEUS CC | 99-00 | 0.008 | 0.42 | 280 | 17000 | 60.9 | GeV | [15] |
The function of Eq. 3.1 is most suitable for absolute or additive uncertainties, i.e. those which do not depend on the central value of the measurement. However, for cross sections, many uncertainties are proportional to the central value (so-called multiplicative uncertainties). This proportionality can be approximated by a linear dependence. In such cases, the data combination using Eq. 3.1 will introduce a bias towards lower cross sections since the measurements with smaller central values will have smaller absolute uncertainties. An improved can be defined by replacing, in Eq. 3.1, and which translates the multiplicative uncertainties for each measurement to the absolute ones. Unlike Eq. 3.1, however, this is not a simple quadratic function with respect to ,. Therefore, the minimum is found by an iterative procedure: first, Eq. 3.1 is used to find an initial approximation for , then the uncertainties are re-calculated using , and finally the minimisation is repeated. For the HERA data averaging, convergence was observed after two iterations.
3.2 Data input and treatment
The data used for the combination consist of the published double differential NC and CC cross sections from H1 and ZEUS, taken in the years , and are listed in Tab. 1. During this period, HERA operated with an electron beam energy, , of 27.5 GeV and a proton beam energy, , of 820 GeV (until 1997) and 920 GeV (from 1998 onwards). The measurements span the kinematic region and , and are the most precise data published by the H1 and ZEUS collaborations to date111 Note that there are also data available for , both from shifted vertex operation and from ZEUS using a dedicated detector near the beam pipe. These data have not been considered here, but will be included in subsequent combined data analyses..
The double differential cross section measurements are published with their statistical and systematic uncertainties. The statistical uncertainties are uncorrelated between different data points. The systematics are classified into three sub-groups: (i) point-to-point uncorrelated systematics, (ii) point-to-point correlated (e.g. energy scale calibrations), (iii) an overall normalisation uncertainty of various data sets. Sources of point-to-point correlated uncertainties are often common for NC and CC cross section measurements and sometimes can be considered to be correlated for different data sets of the same experiment. They are treated as independent between H1 and ZEUS, since uncertainties of beam energies are negligible. Similarly, the normalisation uncertainties are correlated for all cross section measurements by a given experiment from a common data-taking period.
All the NC and CC cross section data from H1 and ZEUS are combined in one simultaneous minimisation. Therefore, resulting shifts of correlated systematic uncertainties and global normalisations propagate coherently to both NC and CC data.
3.2.1 Extrapolation to common
Prior to the combination, the H1 and ZEUS data were transformed to a common grid of points using a simple interpolation:
The H1 PDF parameterisation [16] of the double differential NC and CC cross sections was used to calculate the theoretical ratios. The sensitivity of the data combination to the choice of parameterisation was checked using the ZEUS PDFs [17]. The resulting correction factors were found to agree to within a few permille for the NC data and to within for the CC data (i.e. in both cases, much less than the experimental uncertainties).
3.2.2 Centre-of-mass energy correction
The data sets listed in Tab. 1, include samples from both GeV and GeV running. Since the NC and CC DIS cross sections depend weakly on the energy, via terms involving the inelasticity , a choice must be as to whether to keep the two beam-energy samples separate, or to correct to a single, common proton beam energy. For the present combination, the latter choice was made such that the NC and CC data at GeV were transformed to GeV and then combined with the genuine measurements at the higher proton beam energy.
For the CC data , the correction was calculated as:
For the NC data, the correction was performed additively:
where the correction term is the difference between H1 PDF [16] based predictions of the DIS cross sections, with and . The corrections were found to only be sizable at large . To estimate the uncertainty on the combined data due to this procedure, another average was calculated assuming as an extreme assumption. The difference between these results and those using the standard choice were at the permille level across most of the kinematic plane, and reached for only a very few points at . This uncertainty was added in quadrature to the combined data.
3.2.3 Additive vs multiplicative errors
As mentioned in Sec. 3.1, uncertainties on cross section measurements may be additive or multiplicative. Within the community it is generally agreed that normalisation uncertainties are multiplicative. However, for the other systematic uncertainties the situation is less clear. To assess the sensitivity of the average HERA data set to this issue, various different treatments of the systematic uncertainties were considered. The extreme assumptions treat all uncertainties as multiplicative, or all as additive, apart from the normalisation uncertainties. Therefore, an additional systematic uncertainty was estimated, based on the difference between these two error treatments. The typical size of this uncertainty was for the low data, reaching at larger .
3.2.4 Correlations between experiments
The H1 and ZEUS collaborations use similar methods to reconstruct the event kinematics, employ similar techniques for the detector calibration, use common Monte Carlo simulation models for the hadronic final state simulation as well as for photoproduction background subtraction. This similarity of approaches and techniques may lead to correlations between H1 and ZEUS measurements.
A detailed investigation has shown that the results of the combination are rather insensitive to the assumptions on correlations between the two experiments. The largest effect on the average derives from differing assumptions on the photoproduction background (a change at for low ) and on the hadronic energy calibration ( at low ). For these sources the measurements rely more on the simulation of the hadronic final state which is similar for the two experiments. These variations are therefore introduced as additional point-to-point correlated systematic sources of uncertainty on the averaged cross sections.
3.3 Results
In the minimisation procedure, 1153 individual NC and CC measurements were averaged to 584 unique points. This yielded a good quality of fit with the = . The distribution of pulls did not show any significant tension across the kinematic plane. A total of 43 sources of correlated systematic uncertainty were considered in this analysis. In the combined data, almost all systematic uncertainties were reduced, with the most significant reduction observed for the H1 backward calorimeter energy scale (by a factor of 3), and the ZEUS uncertainty in modelling the forward hadronic energy flow (by a factor of 4). The errors which result from the combination process (centre-of-mass energy correction, additive versus multiplicative error treatment, correlations in the background subtraction and on hadronic energy calibration) were introduced as additional point-to-point correlated systematic sources of uncertainty on the average cross section.
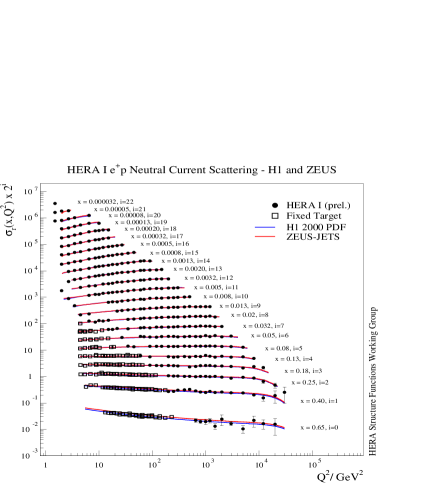
Figure 1 shows the complete set of combined NC data, spanning the entire and range. The scaling violations are clearly visible at both low and high . The data are compared to two previously published QCD fits performed by the H1 and ZEUS collaborations on their own data. As expected, the fits provide an excellent description of the HERA combined data.
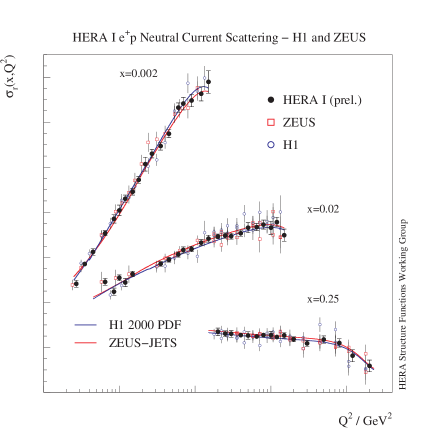
Figure 2 shows a close up, with a linear scale, of three selected bins, as a function of . The combined data are compared to the individual measurements from H1 and ZEUS (shifted for clarity). At low , where the data are limited by systematic uncertainties, the improvement in the total uncertainty is visible. At higher , the combined data have significantly reduced uncertainties, and exhibit far smaller fluctuations, which is driven by the increase in statistical accuracy, which dominates the measurement.
The combined NC and CC HERA data have subsequently been included in a NLO QCD fit to extract the proton PDFs. Details of this analysis are described in the next section.
4 QCD analysis of the combined data
Previously, the H1 and ZEUS collaborations have both used their own data in NLO QCD fits [16, 17]. These data sets have very small statistical uncertainties, so that the contribution from systematics becomes dominant and consideration of point-to-point correlated systematic uncertainties is essential. The ZEUS analysis takes account of correlated experimental systematics by the Offset method (see e.g. [17]), while H1 uses the Hessian method [jphys:g28:2669]. In an attempt to improve the determination of the PDFs from HERA data, the combined H1 and ZEUS measurements have been used as the sole input for a new, NLO QCD analysis. In Sec. 4.1, the QCD analysis, model assumptions and treatment of uncertainties are discussed. In Sec. 4.2, the results are presented.
4.1 NLO QCD analysis
For the QCD analysis presented here the predictions for the structure functions were obtained by solving the DGLAP evolution equations at NLO, in the scheme, with the renormalisation and factorisation scales taken to be . The DGLAP equations yield the PDFs at all values of provided they are input as functions of at some input scale . For this analysis, the input scale was chosen to be . The resulting PDFs were then convoluted with NLO coefficient functions to give the structure functions which enter into the expression for the cross sections. The choice of the heavy quark masses were GeV and GeV. For this preliminary analysis, the heavy quark coefficient functions have been calculated in the zero-mass-variable-flavour-number scheme. The strong coupling constant was fixed at [18].
The fit was performed at leading twist. Since the HERA data have a minimum invariant mass squared of the hadronic system, , of and a maximum of , they are in a kinematic region where there is no sensitivity to target mass and large- higher twist contributions. However, a minimum cut of has been imposed on the data included in the fit, in order to remain in the kinematic regime where perturbative QCD should be applicable.
4.1.1 Choice of parameterisation
The PDFs were parameterised using the form:
and the number of parameters was chosen such that , and were only varied if this resulted in a significant improvement to the . Otherwise, these parameters were set to zero.
For the present analysis222Note that the choice of parameterisation described in Sec. 4.1.1 has been inspired by both the H1- and the ZEUS-style parameterisations. It attempts to combine the best features of both, in that it has fewer assumptions concerning than the ZEUS-style and less model dependence than the H1-style since it does not assume equality of all -parameters., the following PDFs were parameterised: , , , and such that:
The normalisation parameters, and were constrained to satisfy the number sum rules and was constrained to satisfy the momentum sum rule. The parameters, and were set equal, , as were the and , , such that a single -parameter was used for the valence quarks and another, different single -parameter was used for the sea distributions. A further constraint was provided by assuming that the strange and charm quark distributions can be expressed as dependent fractions, and , of the and type sea, such that . The value of was chosen to be consistent with determinations of this fraction from neutrino induced dimuon production. The charm fraction was set to be consistent with dynamic generation of charm from the start point of in a zero-mass-variable-flavour-number scheme. In total, there were 11 free parameters in the fit.
| model variation | central value | lower | upper |
|---|---|---|---|
| 1.4 | 1.35 | 1.5 | |
| 4.75 | 4.3 | 5.0 | |
| 3.5 | 2.5 | 5.0 | |
| 4.0 | 2.0 | 6.0 | |
| 0.33 | 0.25 | 0.40 | |
| 0.15 | 0.12 | 0.18 |
4.1.2 Treatment of experimental data
The HERA combined NC and CC inclusive data, described in Sec. 3, have been used as the experimental input to the present QCD analysis333Note that the version of the combined data used for the QCD analysis is slightly different to that described in Sec. 3 in that only data with were transformed in .. The consistency of the combined HERA data set, as well as its small systematic uncertainties, allow the experimental uncertainties on the PDFs to be calculated using a tolerance of . This is compared to previous global fits where increased tolerances of have been used in order to account for data inconsistencies.
For the present QCD fit, the role of correlated systematics is no longer crucial since the uncertainties are relatively small. In particular, this means that similar results are obtained whether the correlated systematic uncertainties are treated using the Offset or Hessian method in the QCD fit, or by simply combining statistical and systematic uncertainties in quadrature. For the central fit the choice was made to combine the 43 systematic uncertainties (resulting from the separate H1 and ZEUS data sets) in quadrature and to Offset the 4 sources of uncertainty which arise from the combination procedure. This was found to result in the most conservative uncertainty estimate on the extracted PDFs.
4.1.3 Model uncertainties
Despite the conservative procedure adopted, as mentioned above, the experimental uncertainties on the resulting PDFs were still found to be impressively small. Therefore, a thorough consideration of further uncertainties due to model assumptions was necessary. For the present analysis, six sources of model uncertainty were considered, as listed in Tab. 2. The parameters were varied up and down from the central value, and the differences in the resulting PDFs from the central fit were added in quadrature to the total experimental PDF uncertainty.
Further cross checks were also performed. In particular, the dependence on the choice of parameterisation was investigated by repeating the fit using the H1-style [16] and ZEUS-style [17] parameterisations. All fits gave acceptable and were found to be consistent with each other. Note, however, that the parameterisation chosen for the central fit (described in Sec. 4.1) gave the best as well as the most conservative experimental uncertainties.
4.2 Results
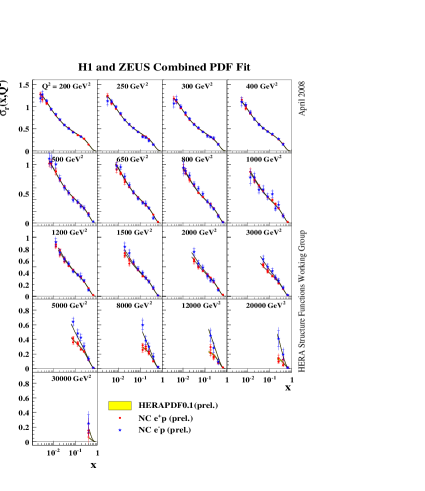
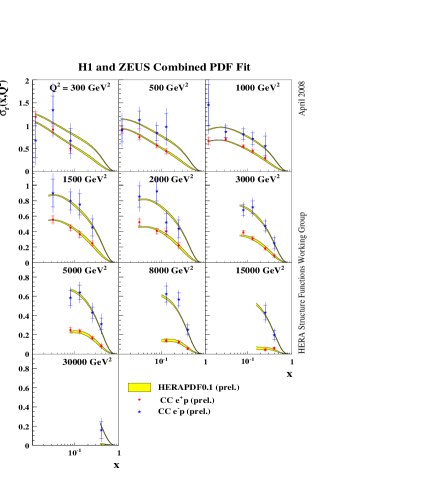
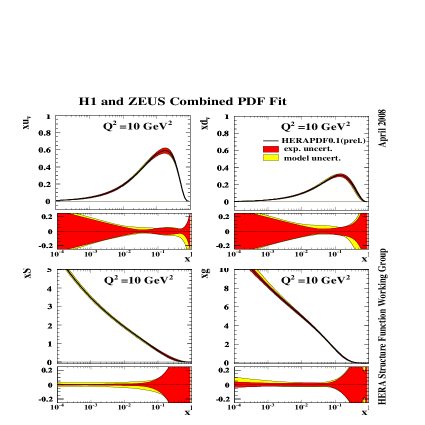
The NLO QCD analysis described above has been named the HERAPDF0.1 fit. Figure 3 shows the results of the HERA fit superimposed on the combined high- NC and CC data sets, showing the excellent description of the data by the HERA PDFs.
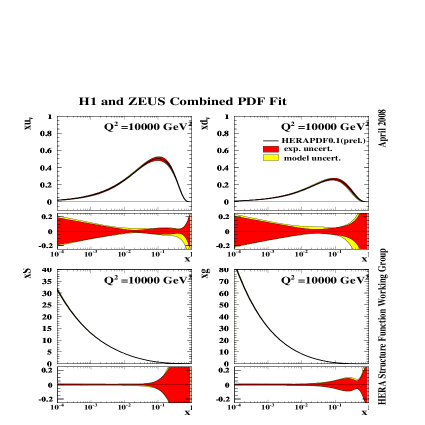
Figure 4 shows the HERAPDF0.1 PDFs , , (total sea) and as a function of at and . Fractional uncertainty bands are shown beneath each plot, with the experimental and model uncertainties being shown separately. The variation of the strange fraction, , dominates the model uncertainty on the sea, while variations of and dominate those on the gluon and valence quarks. Comparison of the results for and shows that, as increases, the PDF uncertainties become impressively small.
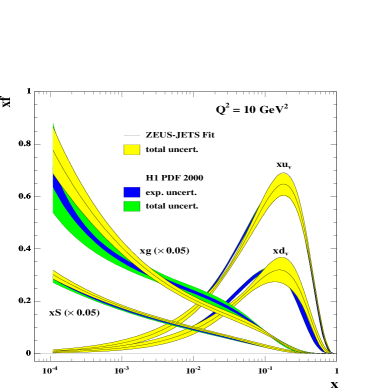
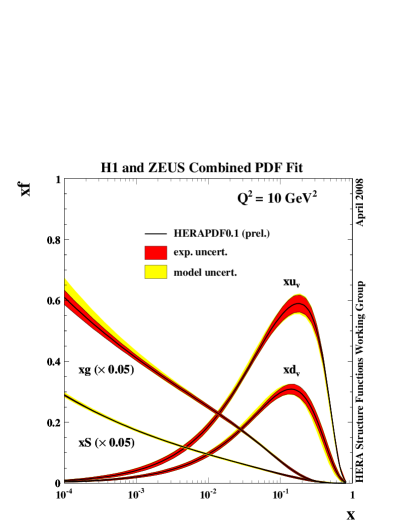
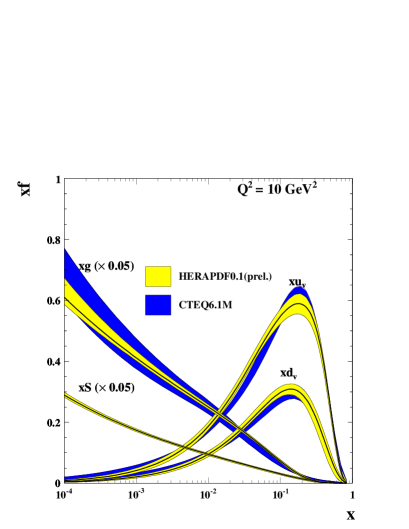
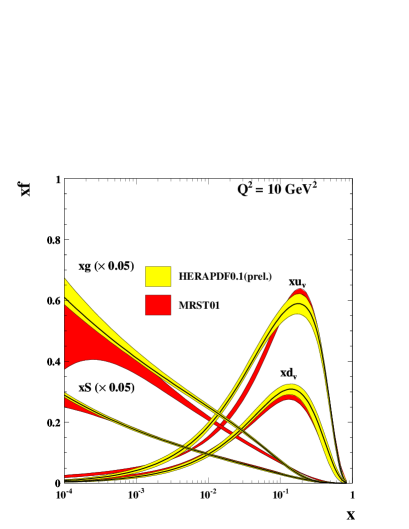
The summary plots shown in Fig. 5 illustrate that the total uncertainty of the PDFs obtained from the HERA combined data set is much reduced compared to the those of the PDFs extracted from separate analyses of the H1 and ZEUS data sets. The dramatic improvement is a result of the data combination. Figure 6 compares the HERAPDF 0.1 PDFs to those of the CTEQ6.1 [19] and MRST01 [20] global fits444Note that the HERAPDF0.1 uncertainty band represents a confidence level, while the global fits show a confidence level band.. The results indicate that the precision of the HERAPDF0.1 PDFs for the low sea and gluon is impressive.
5 Summary
A new, model-independent method of combining cross section measurements has been presented, in which a coherent treatment of systematics results in a substantial reduction in the overall uncertainties. The method has been demonstrated on the complete set of published HERA I NC and CC inclusive DIS data.
The combined HERA data have subsequently been included in a new NLO QCD analysis. The consistent treatment of systematic uncertainties in the combined data set ensures that the experimental uncertainties on the PDFs can be calculated without need for an increased tolerance. This results in PDFs with greatly reduced experimental uncertainties compared to separate analyses of data from the H1 and ZEUS experiments. Model uncertainties have also been carefully considered. The resulting PDFs (called HERAPDF0.1) have impressive precision. They are now publicly available in LHAPDF [21] (v5.6 onwards).
High statistics data from the HERA II running period are being analysed by the two collaborations and will be included in subsequent analyses devoted to precision determinations of the proton parton densities.
6 Acknowledgements
I would like to thank the organisers of Ringberg 2008 for a very productive and enjoyable workshop, the members of the HERA Combined Structure Function Working Group for useful information and comments, and the UK Science and Technology Facilities Council for support.
References
- [1] S. Glazov, Proceedings of DIS 2005, AIP Conf. Proc. 792, 237 (2005).
- [2] H1 and ZEUS Collaboration, H1prelim-07-007, ZEUS-prel-07-036.
- [3] A. M. Cooper-Sarkar, Proceedings of DIS08, doi:10.3360/dis.2008.25.
- [4] C. Pascaud and F. Zomer, LAL preprint, LAL/95-05 (1995), C. Pascaud and F. Zomer, hep-ph/0104013.
- [5] J. Feltesse, Proceedings of DIS 2008, doi:10.3360/dis.2008.24.
- [6] H1 Coll., C. Adloff et al., Eur. Phys. J. C 21, 33 (2001).
- [7] H1 Coll., C. Adloff et al., Eur. Phys. J. C 13, 609 (2000).
- [8] H1 Coll., C. Adloff et al., Eur. Phys. J. C 19, 269 (2001).
- [9] H1 Coll., C. Adloff et al., Eur. Phys. J. C 30, 1 (2003).
- [10] ZEUS Coll., S. Chekanov et al., Eur. Phys. J. C 21, 443 (2001).
- [11] ZEUS Coll., J. Breitwig et al., Eur. Phys. J. C 12, 411 (2000) [Erratum-ibid. C 27, 305 (2003)].
- [12] ZEUS Coll., S. Chekanov et al., Eur. Phys. J. C 28, 175 (2003).
- [13] ZEUS Coll., S. Chekanov et al., Phys. Letts. B 539, 197 (2002).
- [14] ZEUS Coll., S. Chekanov et al., Phys. Rev. D 70, 052001 (2004).
- [15] ZEUS Coll., S. Chekanov et al., Eur. Phys. J. C 32, 1 (2003).
- [16] H1 Coll., C. Adloff et al., Eur. Phys. J. C 30, 32 (2003).
- [17] ZEUS Coll., S. Chekanov et al., Eur. Phys. J. C 42, 1 (2005).
- [18] W.-M. Yao et al., J. Phys. G 33, 1 (2006)
- [19] J. Pumplin et al., JHEP 0207, 012 (2002)
- [20] A.D. Martin et al., Eur. Phys. J. C 23, 73 (2002).
-
[21]
M. R. Whalley, D. Bourilkov and R. C. Group,
Proceedings of the HERA-LHC workshop;
http://hepforge.cedar.ac.uk/lhapdf/.