Disentangling the system geometry of the Supergiant Fast X-ray Transient IGR J112155952 with Swift
Abstract
IGR J11215-5952 is a hard X–ray transient source discovered in 2005 April with and a member of the new class of High Mass X–ray Binaries, the Supergiant Fast X–ray Transients (SFXTs). While and observations have shown that the outbursts occur with a periodicity of days, Swift data have recently demonstrated that the true outburst period is days. IGR J11215–5952 is the first discovered SFXT displaying periodic outbursts, which are possibly related to the orbital period. The physical mechanism responsible for the X-ray outbursts in SFXTs is still debated. The main hypotheses proposed to date involve the structure of the companion wind or gated mechanisms related to the properties of the compact object. We test our proposed model which explains the outbursts from SFXTs as being due to the passage of the neutron star inside the equatorially enhanced wind from the supergiant companion. We performed a Guest Investigator observation with Swift that lasted 20 ks and several follow-up Target of Opportunity (ToO) observations, for a total of ks, during the expected “apastron” passage (defined assuming an orbital period of 330 days), between 2008 June 16 and July 4. The characteristics of this “apastron” outburst are quite similar to those previously observed during the “periastron” outburst of 2007 February 9. The mean spectrum of the bright peaks can be fit with an absorbed power law model with a photon index of 1 and an absorbing column of cm-2. This outburst reached luminosities of erg s-1 (1–10 keV), comparable with the ones measured in 2007. The light curve can be modelled with the parameters obtained by Sidoli et al. (2007) for the 2007 February 9 outburst, although some differences can be observed in its shape. The properties of the rise to this new outburst and the comparison with the previous outbursts allow us to suggest that the true orbital period of IGR J11215–5952 is very likely 164.6 days, and that the orbit is eccentric, with the different outbursts produced at the periastron passage, when the neutron star crosses the inclined equatorial wind from the supergiant companion. Based on a ToO observation performed on 2008 March 25–27, we can exclude that the period is 165/2 days.
Subject headings:
X-rays: binaries - stars: neutron - accretion - X-rays: stars: individual: IGR J11215–59521. Introduction
IGR J11215–5952 (catalog ) (Lubinski et al., 2005) is an accreting pulsar ( s, Swank et al. 2007) and a member of the new class of High Mass X-ray Binaries (HMXBs) of the Supergiant Fast X–ray Transients (SFXTs), which we define as transient and flaring X–ray sources with a firm association (via optical spectroscopy) with an O or B supergiant. In particular, this X-ray transient has a B1 supergiant companion (Negueruela et al., 2005; Masetti et al., 2006; Steeghs et al., 2006) located at a distance of about 6 kpc.
The analysis of archival observations of the source field led to the discovery of a recurrence period of 330 days in the X–ray activity (Sidoli, Paizis, & Mereghetti, 2006, hereafter Paper I), probably linked to the orbital period of the binary system, with the outbursts triggered near the periastron passage. This periodicity was later confirmed with /PCA in 2006, which observed a new outburst 329 days after the previous one (Smith et al., 2006). The X–ray spectrum (5–100 keV) observed with was well fitted by a hard power-law with a high energy cut-off around 15 keV (Paper I), with peak luminosity of 1036 erg s-1 (Paper I).
Exploiting the unique predictability of the outbursts, we performed a target of opportunity (ToO) observation with Swift with the main aim of monitoring the source behavior around the time of the fifth outburst, expected on 2007 February 9. This led to the most complete observation of a SFXT outburst (Romano et al., 2007b, hereafter Paper II), that lasted 23 days for a total on-source exposure of ks. These Swift observations constitute a unique data-set, thanks to the combination of sensitivity and time coverage, and they allowed a study of IGR J11215–5952 from outburst onset to almost quiescence. We found that the accretion phase lasts longer than previously thought on the basis of lower-sensitivity instruments observing only the brightest flares, and that short outbursts (the flares lasting minutes to few hours) are actually part of a much longer outburst event (lasting several days). We also found that the spectrum during the brightest flares is described well by an absorbed power law with a photon index of 1 and cm-2 and derived a 1–10 keV peak luminosity of 1036 erg s-1.
A second monitoring ToO with Swift/XRT, performed around the supposed apastron passage (predicted on 2007 July 24), led to the discovery of a new unexpected outburst, after days from the latest outburst (Romano et al. 2007a; Sidoli et al. 2007, hereafter Paper III). In Paper III we discussed the different implications of these findings and the possible geometries for this binary system and for the SFXTs in general.
Here we report the results of a 20 ks observation with Swift, planned to cover the onset of the new outburst (an “apastron” outburst), 329 days from the 2007 July 24 outburst. We also report on two Target of Opportunity Observations with Swift/XRT at a quarter of the period reported in Paper I (defined assuming an orbital period of days).
2. Observations and Data Reduction
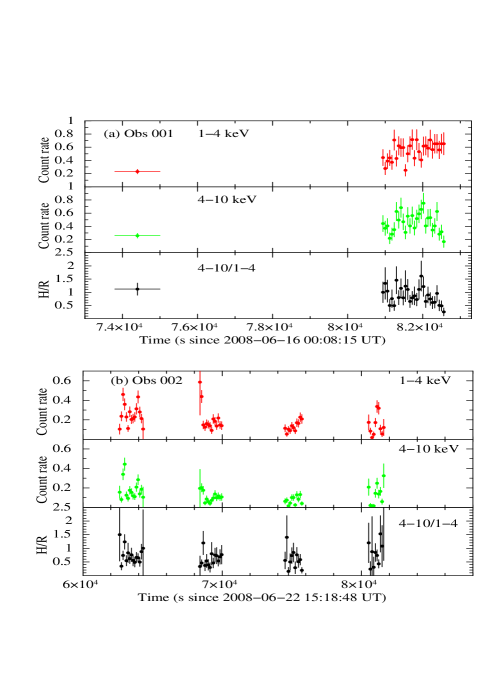
Table 1 reports the log of the Swift/XRT observations used for this work. The first set of observations were obtained as a ToO to investigate the length of the outburst period, at a quarter of the period reported in Paper I ( days). The first observation (00030881033) lasted 1.8 ks, starting on 2008-03-25 at 00:16:42 UT, the second (00030881034) lasted 1.9 ks, starting on 2008-03-27 at 00:26:47 UT, for a total of 3.8 ks. The second set of observations were obtained as part of the Guest Investigation program, (00090005001, hereafter 001, 20 ks) and as follow-up ToOs (00090005002 and 00090005003, hereafter 002 and 003, and 00030881035), for a total of 32 ks.
The XRT data were processed with standard procedures (xrtpipeline v0.11.6), filtering and screening criteria by using FTOOLS in the Heasoft package (v.6.4). Given the low rate of the source during the whole campaign, we only considered photon counting (PC) data and further selected XRT event grades 0–12 (Burrows et al. 2005). Pile-up correction was necessary in observation 001, hence we adopted an annular source extraction region with radii 3 and 30 pixels. Since the source Cen X-3, located 45.7 arcmin from IGR J11215–5952 produced single reflection rings in the XRT images, the background was chosen as a circular region at the same radial distance as IGR J11215–5952 from the center of the rings, and with a 60-pixel radius. The source was not detected in the third segment (003), with a 3- upper limit on the unabsorbed flux (for , cm-2, see Paper II) of erg cm-2 s-1, or erg s-1 (at 6.2 kpc, 1–10 keV). Nor was it detected in observation 00030881035 (3- upper limit at erg cm-2 s-1, or erg s-1). The remainder of the in-depth analysis therefore only refers to observations 001 and 002. Ancillary response files were generated with xrtmkarf, and they account for different extraction regions, vignetting, and PSF corrections. We used the latest spectral redistribution matrices (v010) in CALDB. For timing analysis, the arrival times of XRT events were converted to the Solar System barycentre with the task barycorr and source events were extracted from a circular region (20 pixels radius).
The BAT always observed IGR J11215–5952 simultaneously with XRT, so survey data products, in the form of Detector Plane Histograms (DPH) with typical integration time of s, are available. Furthermore, event data were captured as part of the GI proposal requests up to the maximum of minutes per orbit (15 orbits total) allowed by the large telemetry bandwidth required. The BAT data were analyzed using the standard BAT analysis software distributed within FTOOLS. We never detected the source above a signal-to-noise ratio (S/N) threshold of 5, and we obtained 5- flux upper limits of erg cm-2 s-1 (15–25 keV), erg cm-2 s-1 (15–30 keV), and erg cm-2 s-1 (15–50 keV). These were obtained with a comparison with a Crab on axis observation. This is consistent with the extrapolation at the high energies of the XRT data fit with an absorbed power-law with a high energy cutoff at 15 keV (and ) drawn from the INTEGRAL/ISGRI 2003 July data fit (Paper I).
All quoted uncertainties are given at 90% confidence level for one interesting parameter unless otherwise stated. The spectral indices are parameterized as , where (erg cm-2 s-1 Hz-1) is the flux density as a function of frequency ; we also use as the photon index, (ph cm-2 s-1 keV-1).
3. Analysis and Results
3.1. The 2008 March observations ()
The source was not detected in either observation. The 3- upper limit on the unabsorbed flux of the cumulative observation (obtained assuming the spectral parameters based on the 2007 February outburst reported in Paper II; , cm-2) is erg cm-2 s-1 (1–10 keV), which translates into a 1–10 keV luminosity of erg s-1 at 6.2 kpc. The 3- upper limit on the unabsorbed flux can be compared with the detections at , , and erg cm-2 s-1 obtained during the 2007 February outburst at hours, hours hours, respectively.
3.2. The 2008 June observations (“apastron”)
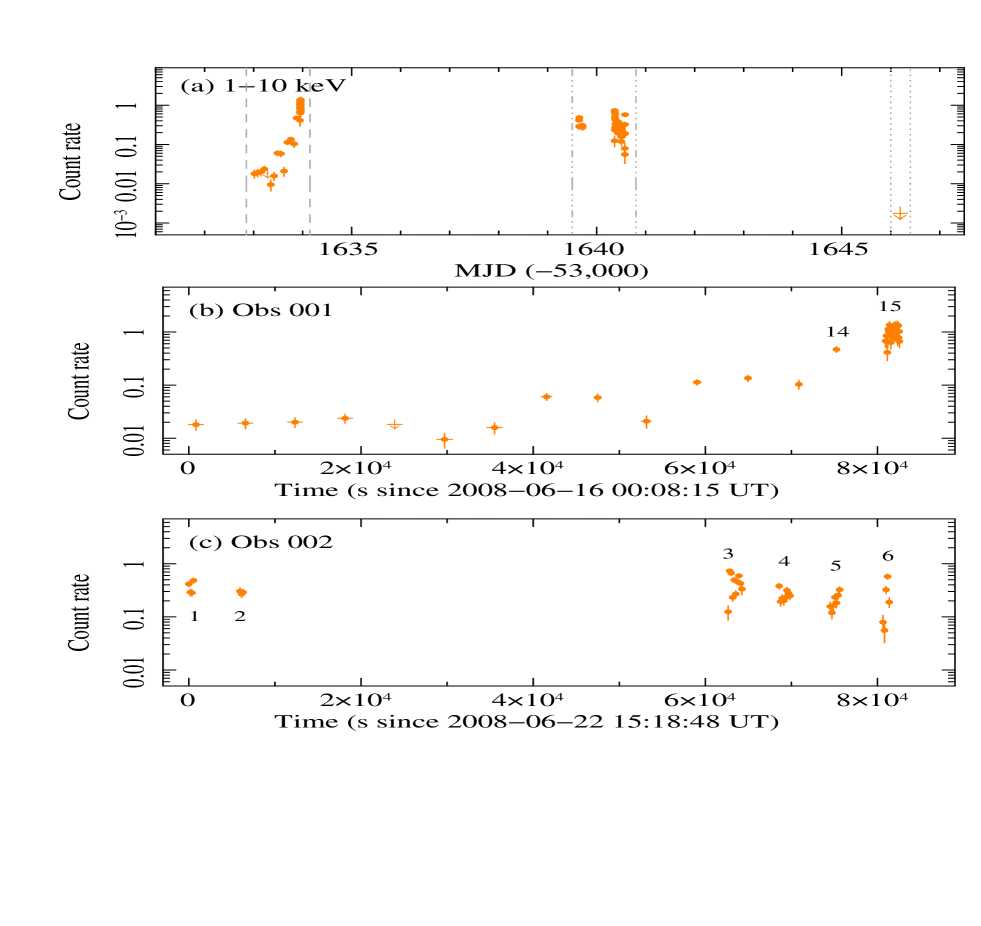
As done in Paper II, we extracted light curves in the 1–10 keV, 1–4 keV, and 4–10 keV bands, but discarded the 0.2–1 keV band because of its significantly lower signal with respect to the other bands. The light curves were corrected for Point-Spread Function (PSF) losses, due to the extraction region geometry, bad/hot pixels and columns falling within this region, and for vignetting, by using the task xrtlccorr, which generates an orbit-by-orbit correction based on the instrument map. We then subtracted the scaled background rate in each band from their respective source light curves and calculated the 4–10/1–4 hardness ratio.
Figure 1a shows the complete light curve of IGR J11215–5952 throughout our GI program and follow-up ToOs in MJD units. Panels (b) and (c) show a detail of observations 001 and 002, respectively, in seconds since the start of the observation. Panel (b), in particular, shows the rise to the outburst, with an increase in count rate by a factor of in less than 8 hours (orbit 10 with respect to orbit 15), by a factor of in 1.7 hours (orbit 14 with respect to 15). However, no significant variation in the hardness ratio (Fig. 2) can be evidenced. Indeed, fitting the hardness ratio as a function of time to a constant model we obtain a value of ( for 28 degrees of freedom, d.o.f.) for orbit 14 and 15 of observation 001 (Fig. 2a), and a value of ( for 49 d.o.f.) for orbits 3–6 of observation 002 (Fig. 2b).
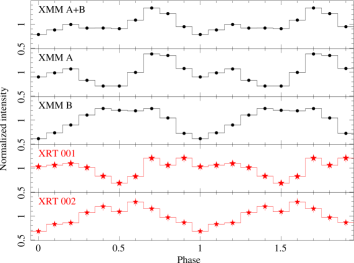
We sought for the IGR J11215–5952 spin periodicity by using epoch folding techniques, on the combined 001 and 002 observations, finding a period of s, which is consistent with that derived from /PCA data (Swank et al., 2007, s) and by XMM–Newton data in Paper III ( s,). We folded the data of observation 001 and 002 (separately) at the period of 186.78 s and obtained the 0.2–10 keV light curves shown in Fig. 3. For ease of comparison, we also report the folded light curve in the bright (A) and faint (B) parts of the XMM–Newton light curves reported in Paper III. We note that the early (and brighter) part of the XRT 001 observation shows a folded profile in phase with the bright part (A) of the XMM–Newton light curve, while the 002 observation is in phase with the faint (B) part.
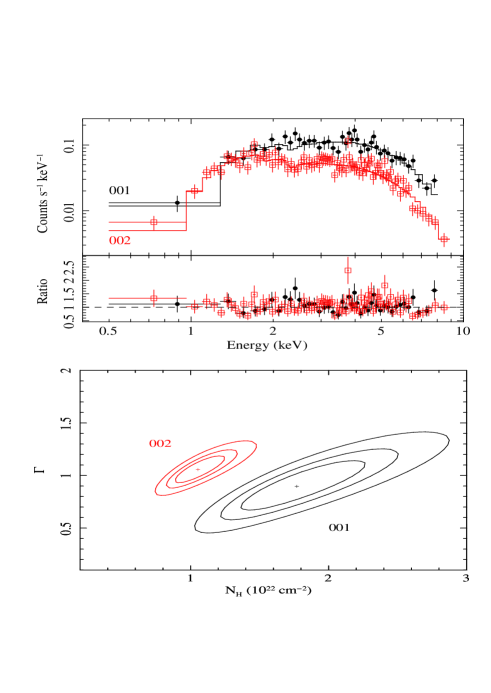
Upon examination of the light curve presented in Fig. 1 and the available counting statistics, we selected different time bins over which we accumulated spectra. These include: i) the low-level phase before the 2008 June 16 outburst, when the mean count rate was counts s-1 (orbits 1 through 13 of observation 001); ii) the intermediate phase (mean CR counts s-1, orbit 14 of observation 001); iii) the beginning of the outburst (orbit 15 of observation 001); iv) each of the orbits in observation 002; v) the whole observation 002. The data were generally rebinned with a minimum of 20 counts per energy bin to allow fitting. However, in several instances the Cash statistic (Cash, 1979) and spectrally unbinned data were used, due to the low counting statistics. The spectra were fit with XSPEC (v11.3.2) in the 0.5–9 keV energy range, adopting an absorbed power law model.
The best fit parameters are reported in Table 2 along with the mean luminosity of each time selection. Fitting the spectrum of the first flare (orbit 15 of observation 001) we obtain a photon index and an absorbing column density of cm-2 ( d.o.f.), while observation 002 yielded and an absorbing column density of cm-2. Fig. 4 shows the spectra and the contour levels for the column density vs. the photon index.
4. Discussion and Conclusions
IGR J11215–5952 is the member of the new SFXT class observed more in depth, thanks to the known periodicity of its outburst recurrence (165 days). This is an important property among these new X–ray transients, which allows to plan a monitoring of the behavior during outbursts.
Here we report on a long observation performed with Swift, which for the first time allows a frequent sampling of the X–ray emission during the onset of an outburst from IGR J11215–5952. This new outburst was expected after 329 days from the last observed one, on 2007 July 24, and the observations were performed on 2008 June 16, the day of the expected bright peak. A total of 15 snapshots were collected. After 5–6 days from the bright peak, another short Swift observation was performed, to monitor the declining part of the outburst (bottom panel in Fig. 1), until its end, observed about 12 days after the bright peak, when an upper limit to the luminosity could be placed at 1033 erg s-1.
The source shows a hard X–ray spectrum, well fitted with an absorbed power-law with a photon index of 1, consistent with previous outbursts observed with Swift. There is also no evidence for a variability in the absorbing column density during the outburst, and also in comparison with previously observed outbursts (e.g. Paper II). An epoch folding analysis results in a spin period consistent with previous determinations, and the folded pulse profiles are similar to those observed with XMM–Newton in 2007 February (Paper III), with a dependence on the source flux. Indeed, the pulse profile obtained from XRT observation 001 is very similar to what observed during the bright flare with XMM-Newton (part “A” of the observation, Paper III), while the XRT observation 002, which caught the source in a state almost an order of magnitude fainter than during observation 001, displays a pulse profile very similar to that during the fainter state “B” with XMM-Newton (Paper III). The different pulse shapes are hence very likely linked to a change in flux (almost an order of magnitude). A change in the pulse profile with the luminosity has already been observed in other accreting pulsars (Parmar et al., 1989).
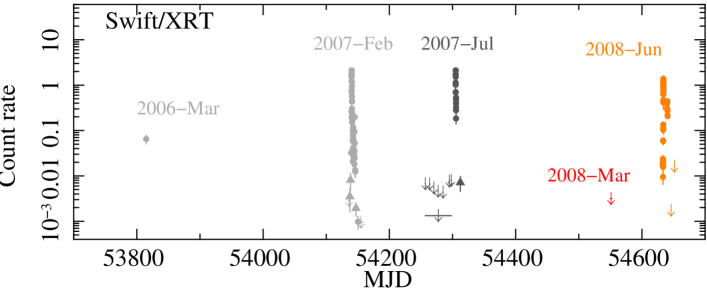
The IGR J11215–5952 historical light curve observed with Swift/XRT is reported in Fig. 5. The observed maximum of the 2008 outburst is slightly fainter than the peaks observed during the two previous outbursts in 2007, but this may be due to the fact that the observation ended before the actual peak was reached.
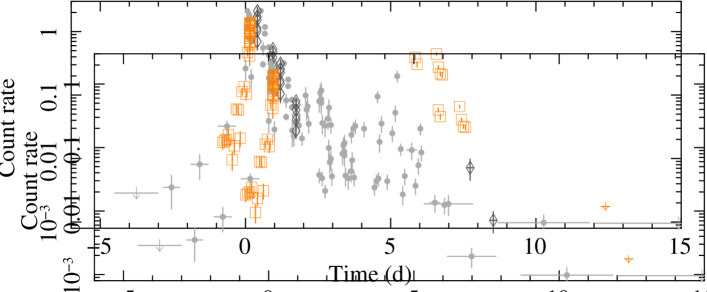
Fig. 6 shows the IGR J11215–5952 light curve folded on a period of 164.6 days, to properly compare the properties of the three observed outburst. Based on the first recognized periodicity of 329 days (Paper I) we have designated these three outbursts as “periastron” (2007 February) and “apastron” outbursts (2007 July and the one reported here).
In Paper III we proposed an alternative explanation for the SFXTs outbursts, based on the properties of the observed IGR J11215–5952 X–ray light curve. Its shape could not be modelled by Bondi-Hoyle accretion from a homogeneous and spherically symmetric wind from the blue supergiant companion. We suggested the presence, besides the symmetric polar wind, of an equatorially enhanced wind component (denser and slower than the polar one), possibly clumpy (to explain the high variability of the source flux) and inclined with respect to the orbital plane, to account for the narrow and steep X–ray light curve in outburst and the periodic outbursts. The presence of equatorially enhanced winds in blue supergiants has also been suggested in literature from the variability of optical spectra (e.g., Markova et al., 2008), from simulations (ud-Doula et al., 2008), and from X–ray observations of a number of supergiant High Mass X–ray Binaries displaying apastron flares (e.g., Corbet et al., 2006; Pravdo & Ghosh, 2001; Roberts et al., 2001).
In Paper III we also discussed two possible orbital geometries for IGR J11215–5952, and obviously different wind parameters for both the equatorial and the polar components, to explain the X–ray luminosity observed: (1) an orbital period, , of 329 days (and a circular orbit, with two observed outbursts per orbit) or (2) an orbital period, , of 165 days, with only one outburst per orbit and a higher eccentricity, together with a possibly truncated equatorial wind (this to avoid observing an outburst at , which is now excluded based on the observation performed in 2008 March, see Fig. 5).
The new 2008 outburst, compared in Fig. 6 with the one observed in 2007 February and 2007 July, displays a similar duration and X–ray luminosity, although the sampling of the three monitoring campaigns is very different. Thus we will not discuss further the wind parameters (density and velocity needed to explain the X–ray emission), due to the analogies of the three outburst light curves, and we will refer to Paper III, where we report a possible choice for the wind parameters that match the observed X-ray light curve, as the model is essentially open and different combinations of wind density and velocity in the equatorial wind can reproduce the X-ray light curve. On the other hand, in 2008 the source seems to remain longer in a sort of bright state after the peak (see Fig. 6): observations performed 5–6 days after the bright peak, found the source still at a high X–ray level (0.3 counts s-1), with a count rate about one order of magnitude higher than the average level of the 2007 February declining tail. It is important to note, however, that IGR J11215–5952 is a highly variable source, displaying a frequent flaring activity with a large dynamic range even during the tail of the 2007 February outburst (this is clearly shown in Fig. 6). Thus we cannot exclude that during the last outburst in 2008, Swift observations caught by chance only the bright peaks of a similar flaring activity, while the tail, much fainter on average, was not observed, due to the several gaps and sparse sampling. A second possibility is the variability of the wind properties which could produce a longer outburst at periastron or the presence of single dense clumps, which are not uncommon in blue supergiants (e.g., Owocki & Cohen, 2006) and could have been accreted and thus produced these bright peaks. A third yet more unlikely possibility is that this quite high count rate observed about 5–6 days after the bright peak on 2008 June 16, could be part of a much longer X–ray outburst peak, lasting 5–6 days (but note that there is a large observing gap between the two sets of observations), due to accretion of matter from the equatorial wind near the apastron passage, where the neutron star velocity could be 5–6 times lower than during the periastron passage (assuming the same size for the compressed wind outflow) in an eccentric binary. This latter hypothesis can be actually excluded by the following argument: a supposed range of variability for the neutron star orbital velocity of 5–6 times can be obtained only in an orbit with a high eccentricity, 0.7. On the other hand, would imply a very high dynamic range of (assuming wind parameters discussed in Paper III) between the X–ray luminosity produced at the periastron passage and that produced at apastron, when the neutron star crosses the equatorial wind; but this large difference in the peak amplitude (which is similar during all outbursts) is excluded by the observations.
The new observations reported here trace quite well the rise to the new outburst, and if compared with previous observations, allow to possibly say something more conclusive about the true orbital period of this binary system. Indeed we favor an eccentric orbit with an orbital period of 165 days, with one outburst per orbit produced near the periastron passage. This conclusion can be derived from the arguments we discuss below.
The three outburst peaks observed with Swift/XRT can be very well overlaid, when they are folded on a period of 164.6 days (see Fig. 6). This interestingly implies that they are very closely time-locked.
In the framework of our proposed model (where outbursts are produced when the neutron star crosses the supergiant equatorial wind, which is inclined with respect to the orbital plane), this close time-locking implies that, if the true orbital period is 329 days, the orbit should be perfectly circular (to have two outbursts per orbit at exactly a half of the orbital period). Moreover, the supergiant compressed outflow in the magnetic equator should be highly stable and “rigid” up to large distances from the companion: for a binary period of days, the orbital separation is 41013 cm (about 25 stellar radii for a typical B1 supergiant). Detailed studies and simulations of equatorially enhanced supergiant winds suggest that a rotating supergiant with a dipole magnetic field aligned to the star’s rotation axis, can produce a steady magnetically confined line-driven stellar wind on the equatorial plane (ud-Doula et al., 2008). For example, the wind of a B1-type supergiant can be perturbed to form an equatorial density enhancement with a relatively low magnetic field of about 20–30 G. Indeed, assuming the “wind magnetic confinement parameter” (ud-Doula & Owocki, 2002), the minimal magnetic field, Bmin(for =1), for an equatorial wind compression is B, where is the wind mass loss rate, the terminal velocity and Rc the supergiant radius. Assuming, for example, =510-7 M⊙ yrs-1, Rc=30 R⊙ and =1000 km s-1, we obtain Bmin=27 G.
| SequenceaaThe previous observations are listed in Sidoli et al. (2008). | Start Time | Start time (UT) | End time (UT) | ExposurebbThe exposure time is spread over several snapshots (single continuous pointings at the target) during each observation. |
|---|---|---|---|---|
| (MJD) | (yyyy-mm-dd hh:mm:ss) | (yyyy-mm-dd hh:mm:ss) | (s) | |
| (1) | (2) | (3) | (4) | (5) |
| 00030881033 | 54550.0116 | 2008-03-25 00:16:42 | 2008-03-25 02:07:57 | 1829 |
| 00030881034 | 54552.0186 | 2008-03-27 00:26:47 | 2008-03-27 02:18:55 | 1941 |
| 00090005001 | 54633.0057 | 2008-06-16 00:08:15 | 2008-06-16 23:04:57 | 18975 |
| 00090005002 | 54639.6381 | 2008-06-22 15:18:48 | 2008-06-23 13:59:17 | 6740 |
| 00090005003 | 54646.0529 | 2008-06-29 01:16:08 | 2008-06-29 08:01:56 | 5410 |
| 00030881035 | 54651.4232 | 2008-07-04 10:09:21 | 2008-07-04 11:58:55 | 1093 |
| Spectrum | (d.o.f.)/ | aaLuminosity in the 1–10 keV band in units of erg s-1 obtained from the spectral fits adopting a distance of 6.2 kpc. | ||
|---|---|---|---|---|
| (1022 cm-2) | C-stat(%)bbCash statistics (C-stat) and percentage of Monte Carlo realizations that had statistic C-stat. We performed simulations. | erg s-1) | ||
| (1) | (2) | (3) | (4) | (5) |
| 001 (orb 1–13) | 0.129 | |||
| 001 (orb 14) | 384.2 (82.0%) | 2.517 | ||
| 001 (orb 15) | 5.003 | |||
| 002 (orb 1) | 580.5 (82.3%) | 1.469 | ||
| 002 (orb 2) | 475.5 (65.7%) | 1.339 | ||
| 002 (orb 3) | 2.031 | |||
| 002 (orb 4) | 713.4 (65.0%) | 1.230 | ||
| 002 (orb 5) | 607.0 (50.0%) | 0.822 | ||
| 002 (orb 6) | 548.3 (62.0%) | 1.270 | ||
| 002 (all) | 1.324 |
The outer edge of this rigid structure largely depends on the surface magnetic field of the supergiant, and can reach a few stellar radii. It extends to 20 stellar radii only in case of highly magnetic Bp stars (ud-Doula & Owocki, 2003). Thus, such a large compressed equatorial wind structure seems to be less likely for a B supergiant. This would favor a less wide and eccentric orbit for IGR J11215–5952 with an orbital period of 165 days. This also avoids the intersection of the equatorial wind component near apastron passage.
Another piece of evidence favoring the 165 days orbital period comes from the fact that there is no evidence for a changing absorption column density between the three different outbursts observed with Swift. If the outbursts are produced by sudden accretion of denser material due to the neutron star ingress into the supergiant equatorial wind, a different absorbing column density should in principle be observed between two consecutive outbursts (one at the periastron and the other one at the apastron, if we assume days). Since the supergiant equatorial component is inclined with respect to the neutron star orbit, the observer should see one of the two outbursts in front of it, and the other one from behind it (thus with a higher column of absorbing matter towards the line of sight). But a difference in the column density is not observed, within the uncertainties. This difficulty could be avoided in the days scenario only if we assume that the system is viewed face-on, and with a supergiant equatorial wind component perpendicular to the orbital plane.
Moreover, it seems quite unlikely that the supernova explosion which produced the neutron star has completely misaligned the orbital plane with the supergiant spin axis, but did not produce at the same time an eccentric orbit, thus leaving behind a perfectly circular orbit (as required if the true period is 329 days).
In conclusion, all these arguments based on the new Swift/XRT observations indicate that an orbital period of 329 days would imply a too much fine-tuned geometry of the system, and on the other hand suggest that IGR J11215–5952 is very likely in an eccentric orbit with an orbital period of 164.6 days, where the outbursts are produced near the periastron passage by the same wind structure crossed every time.
The rise to the outburst is much better sampled in 2008 than during the February 2007 outburst, thus allowing us to confirm once more that the shape of the light curve cannot be explained by accretion from a spherical distribution of matter (homogeneous or not) as already demonstrated in Paper III. In particular, the new light curve clearly shows a rise to the outburst of 2 orders of magnitude in the source count rate in less than about orbital phase (assuming days period). On the contrary, a wind with a spherical distribution (and the same stellar parameters as in Paper III) can at most produce this difference in count rate during orbital phase, assuming the highest possible orbital eccentricity of e=0.89 (or the neutron star orbit would lie inside the supergiant at periastron). Negueruela et al. (2008) proposed different possible geometries for SFXTs, within the framework of a clumpy spherical wind from the supergiant companion. In their model, a periodic recurrence of the outbursts could be explained only with an eccentric orbit. On the other hand, even assuming a very high eccentricity of the orbit, as discussed above, any spherically symmetric distribution of matter (although clumpy) cannot reproduce both the steep rise to the outburst and the entire narrow shape of the outburst in IGR J11215–5952 (Paper III). Our interpretation of the outbursts of IGR J11215–5952 with a preferential plane for the wind outflow can benefit from much better constrained wind parameters (density, velocity, mass loss rate), and its application to all the other SFXTs needs to be tested and confirmed. Indeed, we are currently monitoring 4 SFXTs (see, e.g., Sidoli et al. 2008) with frequent observations spread over a long-baseline in order to assess whether it is possible to extend or reject this model for all the other members of the same class.
References
- Burrows et al. (2005) Burrows, D. N. et al. 2005, Space Science Reviews, 120, 165
- Cash (1979) Cash, W. 1979, ApJ, 228, 939
- Corbet et al. (2006) Corbet, R. H. D. et al. 2006, in Bulletin of the American Astronomical Society, Vol. 38, Bulletin of the American Astronomical Society, 335
- Lubinski et al. (2005) Lubinski, P., Bel, M. G., von Kienlin, A., Budtz-Jorgensen, C., McBreen, B., Kretschmar, P., Hermsen, W., & Shtykovsky, P. 2005, The Astronomer’s Telegram, 469
- Markova et al. (2008) Markova, N., Prinja, R., Markov, H., Kolka, I., Morrison, N., Percy, J., & Adelman, S. 2008, A&A, 487, 211
- Masetti et al. (2006) Masetti, N. et al. 2006, A&A, 449, 1139
- Negueruela et al. (2005) Negueruela, I., Smith, D. M., & Chaty, S. 2005, The Astronomer’s Telegram, 470
- Negueruela et al. (2008) Negueruela, I., Torrejón, J. M., Reig, P., Ribó, M., & Smith, D. M. 2008, A Population Explosion: The Nature & Evolution of X-ray Binaries in Diverse Environments, 1010, 252
- Owocki & Cohen (2006) Owocki, S. P., & Cohen, D. H. 2006, ApJ, 648, 565
- Parmar et al. (1989) Parmar, A. N., White, N. E., & Stella, L. 1989, ApJ, 338, 373
- Pravdo & Ghosh (2001) Pravdo, S. H., & Ghosh, P. 2001, ApJ, 554, 383
- Roberts et al. (2001) Roberts, M. S. E., Michelson, P. F., Leahy, D. A., Hall, T. A., Finley, J. P., Cominsky, L. R., & Srinivasan, R. 2001, ApJ, 555, 967
- Romano et al. (2007a) Romano, P., Mangano, V., Mereghetti, S., Paizis, A., Sidoli, L., & Vercellone, S. 2007a, The Astronomer’s Telegram, 1151
- Romano et al. (2007b) Romano, P., Sidoli, L., Mangano, V., Mereghetti, S., & Cusumano, G. 2007b, A&A, 469, L5 (Paper II)
- Sidoli et al. (2006) Sidoli, L., Paizis, A., & Mereghetti, S. 2006, A&A, 450, L9 (Paper I)
- Sidoli et al. (2008) Sidoli, L. et al. 2008, ApJ, 687, 1230
- Sidoli et al. (2007) Sidoli, L., Romano, P., Mereghetti, S., Paizis, A., Vercellone, S., Mangano, V., & Götz, D. 2007, A&A, 476, 1307 (Paper III)
- Smith et al. (2006) Smith, D. M., Bezayiff, N., & Negueruela, I. 2006, The Astronomer’s Telegram, 766
- Steeghs et al. (2006) Steeghs, D., Torres, M. A. P., & Jonker, P. G. 2006, The Astronomer’s Telegram, 768
- Swank et al. (2007) Swank, J. H., Smith, D. M., & Markwardt, C. B. 2007, The Astronomer’s Telegram, 999
- ud-Doula & Owocki (2002) ud-Doula, A., & Owocki, S. P., 2002, ApJ, 576, 413
- ud-Doula & Owocki (2003) ud-Doula, A., & Owocki, S. 2003, in Astronomical Society of the Pacific Conference Series, Vol. 305, Astronomical Society of the Pacific Conference Series, ed. L. A. Balona, H. F. Henrichs, & R. Medupe, 343
- ud-Doula et al. (2008) ud-Doula, A., Owocki, S. P., & Townsend, R. H. D. 2008, MNRAS, 385, 97