O VI Absorption in the Milky Way Disk, and Future Prospects for Studying Absorption at the Galaxy-IGM Interface
Abstract
We present a brief summary of results from our FUSE program designed to study O VI absorption in the disk of the Milky Way. As a full analysis of our data has now been published, we focus on the improvements that FUSE afforded us compared to Copernicus data published thirty years ago. We discuss FUSE’s limitations in studying O VI absorption from nearby galaxies using background QSOs, but present FUSE spectra of two probes which indicate the absence of O VI (but the presence of Ly) absorption 8 and 63 kpc from a foreground galaxy. Finally, we discuss the need for a more sensitive UV spectrograph to map out the physical conditions of baryons around galaxies.
Keywords:
Galaxy:disk — ultraviolet:ISM — quasars: absorption lines:
95.85.Mt, 98.35.Hj, 98.38.Kx, 98.58.-w, 98.62.Ra1 The FUSE Survey of O VI Absorption in the Milky Way Disk
The FUSE survey of O VI absorption lines in the disk of the Milky Way was a program that used spectra of 153 early-type stars at latitudes and distances of more than 1 kpc to characterize O VI absorption in the plane of the Galaxy. The results from the survey have now been published in full (Bowen et al., 2008), so in this contribution, we highlight just a few of the results from that paper. We begin, however, in celebrating the accomplishments of FUSE, by comparing some of the data obtained with the satellite to the data available prior to its launch.
1.1 A Copernicus/FUSE comparison
The results of our FUSE survey were published thirty years and three months after the seminal survey of Jenkins (1978) (which built upon the initial work of Jenkins and Meloy (1974) and York (1974)) using the Copernicus satellite. Comparing data from the two telescopes might simply be considered amusing if the goal was to merely demonstrate the obvious superiority of current instrumentation and detectors over those available three decades ago. A more serious intent, however, for such a comparison is to verify the integrity of the older data. So, for example, the physical parameters of O VI absorbing clouds along any particular sightline should be the same whether measured with Copernicus or with FUSE. Unfortunately, few lines of sight were actually observed by both satellites; Copernicus regularly recorded spectra of stars brighter than mag, but these objects were too bright to be observed with FUSE (Sahnow et al., 2000).
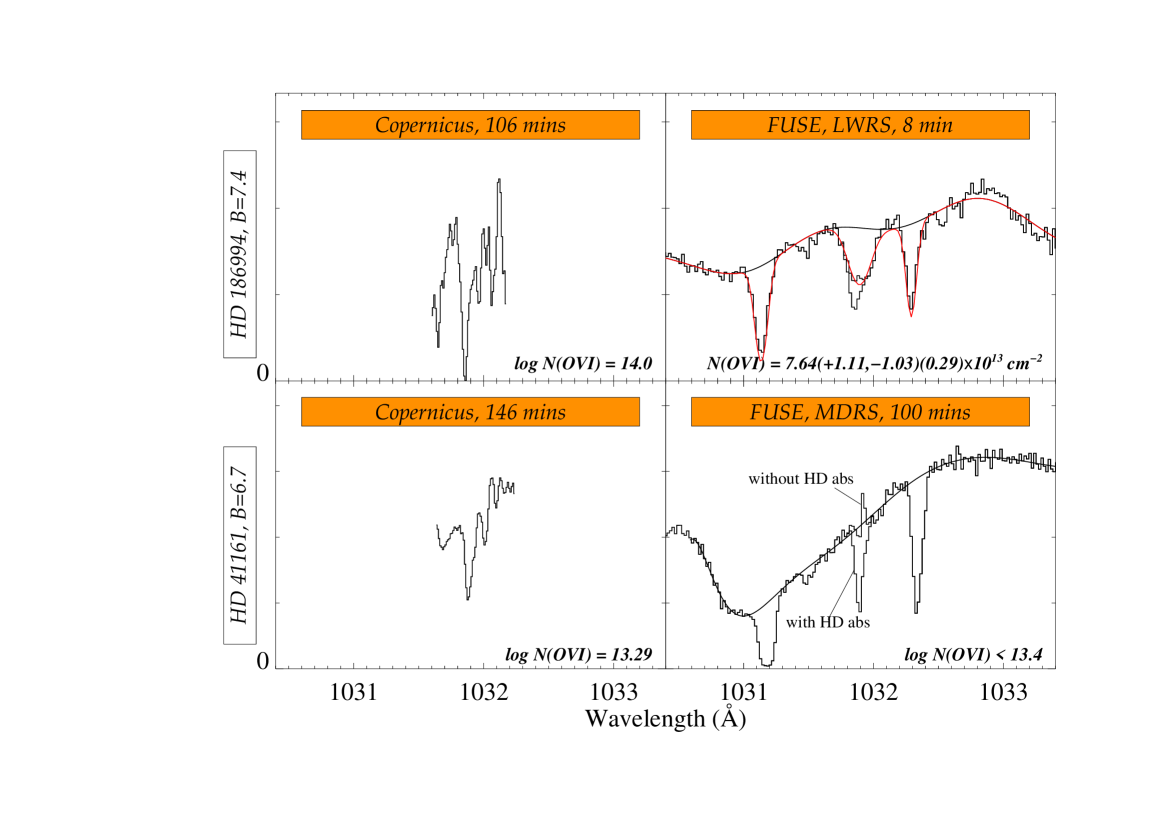
Nevertheless, in our survey, two stars — HD 186994 and HD 41161 — were observed by both Copernicus and FUSE, and the data from each satellite are shown in Fig. 1. This comparison is somewhat cruel, since with magnitudes of and 6.7 for the two stars, respectively, these were some of the faintest objects Copernicus could observe. In this respect, the apparently poor signal-to-noise (S/N) of the two spectra are unrepresentative of the data used by Jenkins (1978). Still, one clear difference between the two is the much smaller wavelength coverage of the Copernicus spectra; the satellite used a scanning spectrophotometer to record stellar spectra while FUSE was fitted with the multi-spectral-element detector arrays that observers now take for granted.
The coadded Copernicus scans of HD 186994 (taken here from the Multimission Archive at STScI) represent an exposure time of 106 min; the 8 min FUSE data taken with the LWRS aperture provide a larger wavelength range, and so superior a S/N, than the Copernicus spectrum, that fitting the stellar continuum is much more straightforward. The resulting measurement of the physical parameters of the O VI absorption [column density (O VI), Doppler parameter and absorption velocity] are more precise than those that were derived with Copernicus, and with the FUSE spectrum we could estimate the errors in the physical parameters arising from both counting statistics and errors in the continuum fit. For HD 186994, (O VI) derived from the Copernicus data was 14.0 or , as measured from O VI line or from the O VI line, respectively. These numbers, taken together, are broadly consistent with the value derived from FUSE, (O VI), which is reassuring given the low quality of this particular Copernicus spectrum.
The FUSE data also allow an accurate subtraction of the HD 60 R(0) line which contaminates the O VI profile. This contamination was well understood by Jenkins (1978), and accounted for in the Copernicus spectrum of HD 41161, where some residual O VI absorption was detected after subtraction of the HD line. Interestingly, in our FUSE spectrum (taken, unusually, using the MDRS aperture) we determined that all of the observed absorption was due to the HD line. Nevertheless, our upper limit to (O VI) is still consistent with the value given by Jenkins (1978).
Verifying the integrity of the earlier Copernicus data is far from academic: since early-type stars at distances of kpc were too bright to be observed with FUSE, we needed the Copernicus data to probe these distances when examining how O VI absorption varies with path length in the Galactic disk.
1.2 Summary of Program Results
To explore the characteristics of O VI absorption in the Galactic disk, we combined our FUSE observations of stars at kpc with several other datasets. We included stars at kpc observed by Copernicus, as well as halo stars Zsargó et al. (2003), extragalactic sightlines (Wakker et al., 2003; Savage et al., 2003), and nearby white dwarfs Savage and Lehner (2006), all targeted by FUSE. As noted above, these results are now published (Bowen et al., 2008), and our measurements are available at http://www.astro.princeton.edu/~dvb/o6home.html.
Our data confirmed that O VI absorbing clouds are ubiquitous throughout the Alpha and Beta quadrants of the Galaxy. The O VI volume density falls off exponentially with height above the Galactic plane, as had been shown from previous studies Widmann et al. (1998); Savage et al. (2003). With the FUSE data, however, we were able to measure the mid-plane density to be precisely cm-3, with scale heights of 4.6 and 3.2 kpc for sightlines in the southern and northern Galactic hemispheres, respectively. However, even though the O VI density falls off with height above the plane, the O VI absorbing material is not smooth, but clumpy, with a range of cloud sizes. We were also able to settle a long standing question as to how much O VI absorption towards a target star actually comes from hot circumstellar material around the star itself — only a small amount of (O VI) arises in such regions. We found that (O VI) correlates with , demonstrating that O VI absorbing clouds are truly interstellar, and composed of many individual, overlapping, components. The dispersion of (O VI) with is large though, and very different from what would be expected from absorption by an ensemble of identical clouds. The velocity extent of O VI lines follow those of lower ionization lines observed along the same sightlines, showing that hot and cold gas are coupled.
There are different ways to interpret our results, and in the future, our data should provide the observations necessary to test theoretical predictions of how hot gas is produced in the Galaxy. We note that concurrent with our investigations, detailed hydrodynamical simulations of hot gas in the local Galactic disk were being engineered by de Avillez and Breitschwerdt (2005). In these models, the ISM contains a hot, turbulent multi-phase medium churned by shock heated gas from multiple supernovae (SNae) explosions. Hot gas arises in bubbles around SNae, which is then sheered through turbulent diffusion, destroying the bubbles and stretching the hot absorbing gas into filaments that dissipate with time. Although these simulations are unlikely to be the last word in modelling the hot Milky Way ISM, they do provide a contemporary context in which to interpret our data. For example, they successfully predict the mid-plane O VI density that we measure in our survey.
2 O VI Absorption in other galaxies
Outside of the Galactic disk, FUSE demonstrated the existence of copious amounts of O VI absorption in the Milky Way halo (Wakker et al., 2003; Savage et al., 2003) and in the star-forming regions of the Magellanic Clouds (Howk et al., 2002; Hoopes et al., 2002). O VI was also detected in Galactic High Velocity Clouds (HVCs) (Sembach et al., 2003), which posed the interesting question: how far out from a galaxy can O VI be detected? The distances to the HVCs are not well constrained, and O VI absorbing HVCs may arise in material infalling into or outflowing from the Galactic disk (from areas of active star formation, for example), or further away, from accretion of gas from the intergalactic medium (IGM) into the extended Milky Way halo, or even the Local Group. In addition, the relationship between all these local O VI absorbers, and the population of weak O VI absorption systems detected towards QSOs at redshifts of a few tenths (Tripp et al., 2000; Danforth and Shull, 2005; Tripp et al., 2008) is far from clear. The latter systems may contain a large fraction of baryons, as much as that currently found in stars, cool gas in galaxies, and X-ray emitting gas in galaxy clusters. Where these O VI lines actually come from, however, is unclear. Although individual galaxies have been detected at similar redshifts to O VI absorption systems (within impact parameters of Mpc (Tripp and Savage, 2000; Savage et al., 2002; Sembach et al., 2004; Tripp et al., 2006; Lehner et al., 2008)), redshift information for objects in these fields is incomplete, and the environment of the absorbing gas is hard to establish at redshifts of .
One way to address these questions is to search for O VI absorption in the disks and halos of low- galaxies. Working at low redshifts has several advantages: there is no ambiguity in the origin of any detected lines, the properties of the galaxies can be more readily quantified than at high-, and the physical conditions of the absorbing gas can be directly linked to those observable properties. Moreover, the environment of nearby galaxies – whether they are isolated, are interacting with companions, reside in loose groups, or in clusters — can be more easily determined than at higher-.
The problem in performing these types of experiments has always been the difficulty in finding QSOs which are close to galaxies in projection, and that are bright enough to be observed in the UV with the available instrumentation. For FUSE, the challenge was almost insurmountable. With generous allocations of observing time, of order ksec, FUSE could obtain “adequate” S/N (at least in the LiF1a channel) of QSOs with fluxes of ergs cm-2 s-1 Å-1. Most of the interesting QSOs close to low- foreground galaxies have fluxes less than this, and could not be targeted by FUSE. Fortunately, there were a few exceptions.
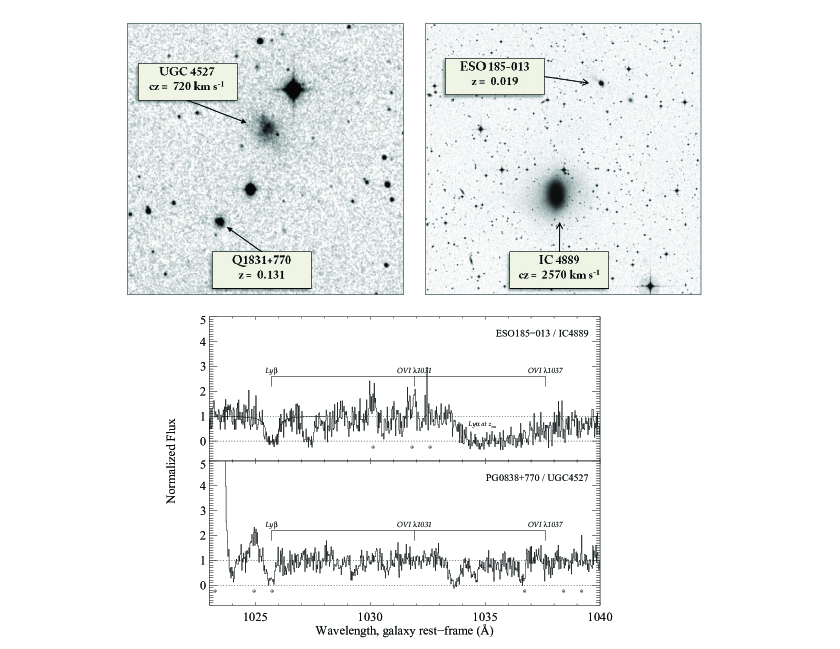
Fig. 2 shows the results from a program (G020) we designed to search for Ly and O VI absorption from the outer regions of two low- galaxies. Again, these pairs were selected in part because the impact parameters between QSO and galaxy were small, but largely because the QSOs were predicted to have high UV fluxes. That is, we could not select pairs based on particular galaxy properties that we might be interested in. ESO 185013 is an AGN at which lies behind the bright E5 galaxy IC 4889. The galaxy has a redshift of 2570 km s-1, and the sightline to the AGN passes 63 kpc from its center. Strong Ly absorption is detected; unfortunately, the O VI line falls at the position of an O I∗ airglow feature, making it hard to determine whether the line is present. Nevertheless, O VI is not detected to a limit of Å. The H I column density is difficult to constrain since the Ly line is strongly saturated, and the S/N of the data are not sufficient to show the onset of damping wings in the line profile. For Doppler parameters of km s-1, (H I), but if is large, e.g., kms, (H I) could be one dex less. However, the H I absorption extends in size the structure seen in 21 cm emission around IC 4889 (Oosterloo et al., 2007) by a factor of two. The radio data measures (H I) to a limit of ; our data suggests that (H I) remains relatively high at a radius twice that seen at 21 cm.
The second QSO-galaxy pair studied in our program was PG 0838+770/UGC 4527. The QSO sightline passes only 8 kpc from the UGC 4527, which is a low surface brightness Im galaxy at a redshift of 720 km s-1. We again detect Ly at the redshift of the galaxy, although it is likely that the line profile is contaminated with O I∗∗ airglow. However, the non-detection of O VI is clear, to a limit of Å. Little is known about UGC 4527; deciding whether the lack of O VI so close to an irregular dwarf galaxy is surprising will depend on a better understanding of the galaxy itself, and ultimately, obtaining data of better quality.
3 Future Studies of Absorption in galactic disks and halos
Of course, the study of O VI provides insights into only one phase of the gas in and around galaxies. To fully characterize the physical conditions of gas in galaxy disks and halos, absorption lines from many different species (each probing gas at different temperatures, densities, etc.) must be observed. The need for a sophisticated analysis of what is likely to be a multiphase medium at the boundary between a galaxy and the IGM is now more compelling than ever, because our view of galaxies and their relationship to the IGM has changed dramatically over the last decade. The exponential growth in available computing power has allowed detailed modelling of the large scale structure (LSS) of the Dark Matter (DM) in the universe, along with its evolution over a significant period of time. More importantly, these models incorporate the gas hydrodynamics required to predict the formation and development of galaxies, and incorporate the likely symbiosis between the physical process at work in the evolution of a galaxy, and the IGM itself. So, for example, galaxies must interact and enrich the IGM at all epochs via various feedback mechanisms: gas may be expelled either from intense bursts of star formation via strong Galactic winds, or from outflows from a central AGN. Conversely, the IGM must influence galaxy evolution by the action of channeling baryons along DM filaments into galaxy groups. These infusions of gas will most likely change the metallicity of a galaxy.
Arguably, our ability to test the simulations with observations lags behind the development of these models. The use of QSO absorption lines enables us to directly probe the galaxy-IGM interface, but the data are sparse. There are two obvious goals for future observations. First, we need to study gas on galaxy scale-lengths around a large number of galaxies. For example, we still have little (unambiguous) information on how the density of gas and its ionization state declines with radius from a galaxy — a seemingly fundamental piece of information for models of galaxy evolution. Second, we need to probe individual galaxies along multiple sightlines, to examine how the properties we measure for an ensemble of galaxies might actually vary in a single system. Indeed, mapping the gaseous structures around single galaxies with multiple lines of sight may be the best way to determine how gas accretes onto a galaxy and/or how it escapes.
Studying galaxies with multiple probes can only be accomplished at low-, where the angular extent of a galaxy is large, and the background surface density of QSOs is high. On the other hand, probing the inner regions of nearby galaxies is more difficult, because QSOs which shine through the hearts of bright low galaxies are not readily detected. Instead, a different approach to exploring the inner regions of galaxies is to work at a somewhat higher redshift.
Over the last few years we have been identifying galaxies cataloged by the Sloan Digital Sky Survey (SDSS) that lie close to QSOs on the sky, with a emphasis on finding QSO-galaxy pairs with very small separations. One technique has been to identify multiple emission lines ([O II], [O III], H, etc.) from low- galaxies in the spectra of background QSOs. The fibers used by SDSS to obtain spectra of selected objects are 3′′ in diameter, and can collect light from both a QSO and any galaxy along the line of sight. This “spectroscopic” technique has enabled us to find galaxies at probed only a few kpc from their centers by a QSO (York et al. in prep). One of these Galaxies on top of QSOs (GOTOQs) is shown in Fig. 3.
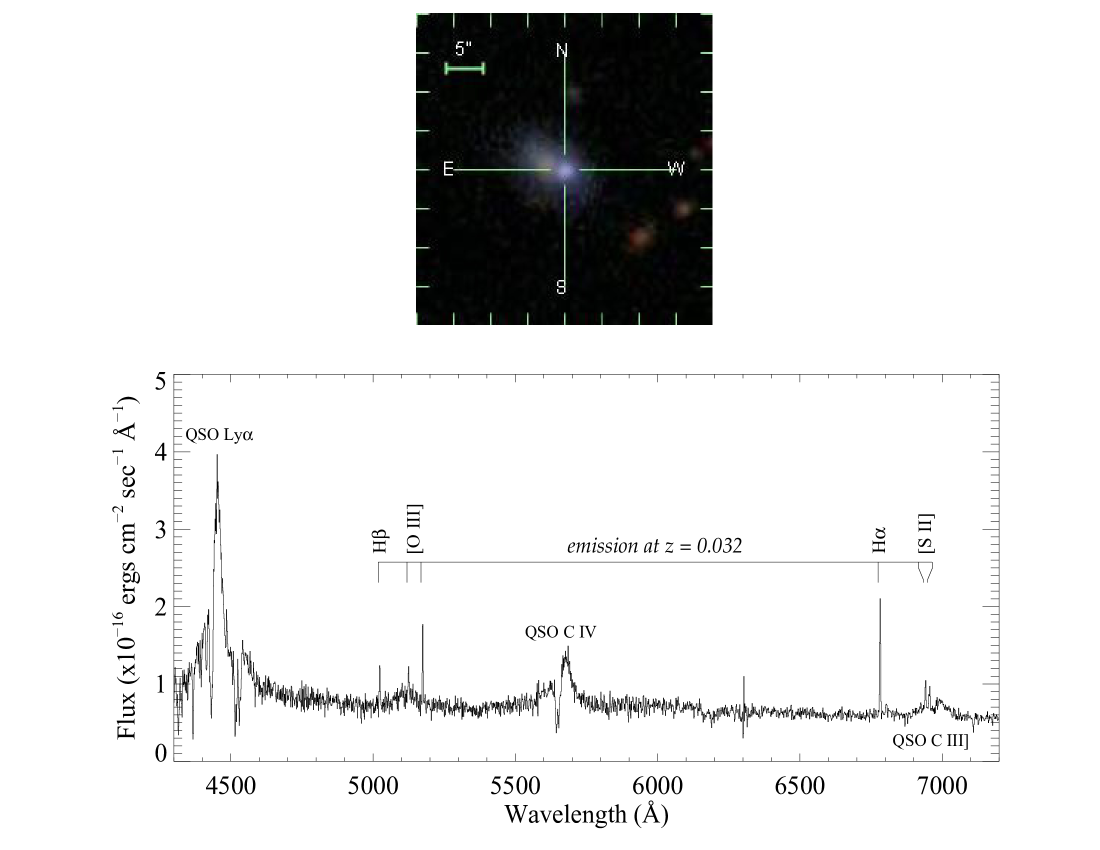
Studying galaxies close to QSOs at is not so easy, compared to studying QSOs behind galaxies. Nevertheless, the GOTOQs offer a special opportunity to probe gas in the inner regions of galaxies, which can complement the studies on larger scales discussed above.
The problem in achieving these goals is the same one mentioned in the previous section — finding QSOs that are bright enough to be observed with available satellites. The Cosmic Origins Spectrograph (COS) which will be installed in HST in 2009 will certainly make significant advances in probing the galaxy-IGM interface, but difficulties remain. For example, if the goal is to map low- galaxies with multiple QSO sightlines, it is quite possible to find a sufficient number of QSOs beyond several hundred kpc, but at smaller distances (where much of the galaxy-IGM interaction is probably taking place) too few QSOs are bright enough for observation with COS. Further, for studying the inner regions of galaxies, whether we select nearby galaxies or those at redshifts of a few tenths, the number of suitable pairs will still be relatively small. Yet in order to characterize the gas around galaxies selected by their properties — their luminosity, morphology, star-formation rates, environment, etc. — we will, in the end, need to probe several hundred systems to fully characterize the galaxy-IGM interface.
Achieving these goals will require a new facility. The requirements for the ideal UV spectrograph are obvious, and have been stated by many previous authors: it would be able to reach sensitivities of a few Jy, about a factor of ten times more sensitive than COS; it would have a resolution of less than 10 km s-1, to enable accurate measurements of column densities and Doppler parameters, and permit mapping of the velocity distribution of multicomponent complexes; and it would cover the entire UV wavelength range, from 912 Å through to the atmospheric limit of Å.
With such an instrument, we could map out the physical conditions of gas on scales ranging from galactic disks to IGM large scale structures. Eventually, we would chart the variations in these conditions over a significant fraction of galactic history, as we extended our techniques to higher redshifts. Comparing our results to simulations which will continue to grow ever more sophisticated would enable us to understand comprehensively the life-cycle of baryons in the universe.
References
- Bowen et al. (2008) D. V. Bowen, et al, ApJS 176, 59 (2008).
- Jenkins (1978) E. B. Jenkins, ApJ 219, 845 (1978).
- Jenkins and Meloy (1974) E. B. Jenkins, and D. A. Meloy, ApJ 193, L121 (1974).
- York (1974) D. G. York, ApJ 193, L127 (1974).
- Sahnow et al. (2000) D. J. Sahnow, et al, ApJ 538, L7 (2000).
- Zsargó et al. (2003) J. Zsargó, K. R. Sembach, J. C. Howk, and B. D. Savage, ApJ 586, 1019 (2003).
- Wakker et al. (2003) B. P. Wakker, et al, ApJS 146, 1 (2003).
- Savage et al. (2003) B. D. Savage, et al, ApJS 146, 125 (2003).
- Savage and Lehner (2006) B. D. Savage, and N. Lehner, ApJ 162, 134 (2006).
- Widmann et al. (1998) H. Widmann, et al, A&A 338, L1 (1998).
- de Avillez and Breitschwerdt (2005) M. A. de Avillez, and D. Breitschwerdt, ApJ 634, L65 (2005).
- Howk et al. (2002) J. C. Howk, K. R. Sembach, B. D. Savage, D. Massa, S. D. Friedman, and A. W. Fullerton, ApJ 569, 214 (2002).
- Hoopes et al. (2002) C. G. Hoopes, K. R. Sembach, J. C. Howk, B. D. Savage, and A. W. Fullerton, ApJ 569, 233 (2002).
- Sembach et al. (2003) K. R. Sembach, et al, ApJS 146, 165 (2003).
- Tripp et al. (2000) T. M. Tripp, B. D. Savage, and E. B. Jenkins, ApJ 534, L1 (2000).
- Danforth and Shull (2005) C. W. Danforth, and J. M. Shull, ApJ 624, 555 (2005).
- Tripp et al. (2008) T. M. Tripp, K. R. Sembach, D. V. Bowen, B. D. Savage, E. B. Jenkins, N. Lehner, and P. Richter, ApJS 177, 39 (2008).
- Tripp and Savage (2000) T. M. Tripp, and B. D. Savage, ApJ 542, 42 (2000).
- Savage et al. (2002) B. D. Savage, K. R. Sembach, T. M. Tripp, and P. Richter, ApJ 564, 631 (2002).
- Sembach et al. (2004) K. R. Sembach, T. M. Tripp, B. D. Savage, and P. Richter, ApJS 155, 351 (2004).
- Tripp et al. (2006) T. M. Tripp, B. Aracil, D. V. Bowen, and E. B. Jenkins, ApJ 643, L77 (2006).
- Lehner et al. (2008) N. Lehner, J. X. Prochaska, H. A. Kobulnicky, K. L. Cooksey, J. C. Howk, G. M. Williger, and S. L. Cales, ArXiv:0821.4231 (2008).
- Oosterloo et al. (2007) T. A. Oosterloo, R. Morganti, E. M. Sadler, T. van der Hulst, and P. Serra, A&A 465, 787 (2007).