Double radio peak and non–thermal collimated ejecta in RS Ophiuchi following the 2006 outburst
Abstract
We report MERLIN, VLA, OCRA-p, VLBA, Effelsberg and GMRT observations beginning 4.5 days after the discovery of RS Ophiuchi undergoing its 2006 recurrent nova outburst. Observations over the first 9 weeks are included, enabling us to follow spectral development throughout the three phases of the remnant development. We see dramatic brightening on days 4 to 7 at 6 GHz and an accompanying increase in other bands, particularly 1.46 GHz, consistent with transition from the initial “free expansion” phase to the adiabatic expansion phase. This is complete by day 13 when the flux density at 5 GHz is apparently declining from an unexpectedly early maximum (compared with expectations from observations of the 1985 outburst). The flux density recovered to a second peak by approximately day 40, consistent with behaviour observed in 1985. At all times the spectral index is consistent with mixed non–thermal and thermal emission. The spectral indices are consistent with a non–thermal component at lower frequencies on all dates, and the spectral index changes show that the two components are clearly variable. The estimated extent of the emission at 22 GHz on day 59 is consistent with the extended east and west features seen at 1.7 GHz with the VLBA on day 63 being entirely non–thermal. We suggest a two–component model, consisting of a decelerating shell seen in mixed thermal and non-thermal emission plus faster bipolar ejecta generating the non–thermal emission, as seen in contemporaneous VLBA observations. Our estimated ejecta mass of 42 M⊙ is consistent with a WD mass of 1.4 M⊙. It may be that this ejecta mass estimate is a lower limit, in which case a lower WD mass would be consistent with the data.
keywords:
stars: individual: RS Oph – novae, cataclysmic variables – stars: winds, outflows – radio continuum: stars1 Introduction
RS Ophiuchi is the most active and best studied member of the small Recurrent Nova class of interacting binary star. It consists of a red giant (RG) donating material to a white dwarf (WD) primary, via either Roche Lobe overflow or direct wind accretion. Six optical outbursts have been observed at irregular intervals (1898, 1933, 1958, 1967, 1985 and 2006) with two others suggested in the literature (1907; 1945 from Schaefer, 2004; Oppenheimer & Mattei, 1993, respectively). The optical development is very similar in each case (Rosino, 1986). The 1985 outburst was the first in which observations were made at radio wavelengths, with first detection 18 days after outburst (Padin et al., 1985). Spectral development showed both non-thermal synchrotron and thermal free-free emission, varying over the course of the rise to peak by about day 40 and subsequent decline over 240 days (Hjellming et al., 1986). A single VLBI image was obtained, showing possible three–component emission extended east–west around the radio peak (Taylor et al., 1989).
The latest outburst by this object was discovered on 2006 February 12, and reached a peak of V=4.5 on 2006 February 12.83 (Narumi et al., 2006), which we take as day 0 for the rest of this paper. We began radio observations on day 4, first with MERLIN at 6 GHz and then with the VLA at 1.49, 4.89, 14.96 and 22.48 GHz (L, C, U and K bands respectively), as described in this paper. In addition VLBI observations began on day 13 and continued throughout the period of the observations discussed here. Both the VLBI (O’Brien et al., 2006) and X-ray (Bode et al., 2006) observations are consistent with an expanding shock wave due to the fast ejecta from the eruption on the WD encountering the pre–outburst RG wind. HST observations on day 155 (Bode et al., 2007) gave added weight to the suggestion of a bipolar remnant from VLBI observations by O’Brien et al. (2006). Here we interpret the first and second radio peaks with reference to the VLBI, HST and X-ray observations
2 Observations
2.1 MERLIN
The Multi-Element Radio-Linked Interferometer-Network (MERLIN) responded rapidly to the triggering of target-of-opportunity observations, with the first observations starting at day 4.3. Monitoring continued at times complementary to VLA, the European VLBI Network (EVN) and the Very Long Baseline Array (VLBA), with observation dates as shown in Table 1. Observations were made initially at 5 cm and later at 6 cm (collectively referred to as C band). Full imaging runs were made, at around 10 hours each including calibration observations. The flux calibrator in each case was 3C286, with OQ208 used for point source response and polarisation calibration. Phase calibration was performed with regular pointings at J1743038. Using standard values and models for the flux calibrator, the flux scale for the phase calibrator was determined. The phase calibrator solutions were then interpolated to the RS Oph data. For the observations on days 4 and 5, the flux density was rising so rapidly that the data were divided into 30–min segments and we were able to follow the rapid rise. A similar analysis on day 7 showed that the rate of decline had flattened by that date.
2.2 VLA
The Very Large Array (VLA) in New Mexico also responded rapidly to the request for observations, with the first made on 2006 February 17 (day 4.7), almost simultaneous with the first MERLIN observations, and continuing approximately weekly thereafter. Observation dates are given in Table 1, and on each occasion continuum observations were made at 1.46 GHz (L band), 4.89 GHz (C band), 14.96 GHz (U band) and 22.48 GHz (K band) with a 50 MHz bandwidth. Observations were made in standard interferometer mode at A array (the most extended and high–resolution configuration), with 1743038 (J2000) as secondary calibrator. Either 3C286 or 3C48 was used as the primary calibrator, depending upon which was available within the scheduled observing window. Fluxes were calculated for the primary calibrators using the approach outlined in Baars et al. (1977) but employing the latest (1999.2) VLA coefficients. The phase and amplitude solutions were determined using model images supplied within AIPS. The secondary calibrator solutions were determined assuming it to be a point source, and the flux at observation from these solutions and the calculated flux of the primary calibrator. Finally the flux scale for RS Oph was determined from the secondary calibrator solutions. Images were generated using the CLEAN algorithm and AIPS task IMAGR at each band on each date and used to determine flux densities. At 22.48 GHz it was also feasible to estimate the extent of the emission as these were the data with the highest spatial resolution.
2.3 OCRA-p
30-GHz continuum observations were made using the Toruń 32-m radio telescope and a prototype (two-element receiver) of the One-Centimeter Radio Array (OCRA-p, Lowe, 2005). The recorded output from the instrument was the difference between signals from two closely-spaced horns effectively separated in azimuth by 3.1 arcminutes so the atmospheric and gain fluctuations were mostly cancelled out. The observing technique was such that the respective two beams were pointed at the source alternately with a switching cycle of 50 s for a period of 5.5 min, thus measuring the source flux density relative to the sky background on either side of the source. The primary flux calibrator was the planetary nebula NGC 7027, which has an effective radio angular size of 8 arcsec (Bryce et al., 1997). Assuming a spectral index of and using an absolute temperature calibration of NGC 7027 (giving 5.450.20 Jy at 32 GHz, from Mason et al., 1999) we estimate the flux density of NGC 7027 at 30 GHz as 5.460.20 Jy. All the final flux density values have been scaled to this figure. The telescope pointing was determined from the azimuth and elevation scans across the nearby point source J1743038. The same source was also used as a secondary flux density calibrator because NGC 7027 was at some distance from the target source. Corrections for the effects of the atmosphere were determined from the system temperature measurements at zenith distances of 0∘ and 60∘.
2.4 VLBA
Observations were made at 1.667 GHz with the Very Long Baseline Array (VLBA) on day 63 (2007 April 17) – see O’Brien et al. (2008) for more details. The data were correlated at the VLBA Correlator, Array Operations Center, New Mexico before being transferred to Jodrell Bank Observatory, United Kingdom and Joint Institute for VLBI in Europe in Dwingeloo, Netherlands for calibration and mapping. Primary flux calibration was carried out using 3C286, with secondary calibration on J1745-0753. As the resolution at this epoch was around 20 mas it was necessary to model the structure of both calibrators to obtain reliable flux and phase calibration. Fringe fitting was carried out to complete calibration and allow imaging of the emission structure.
3 Results
The flux density values from each date at each observed frequency are given in Table 1. In addition Effelsberg measured 36 mJy at 10.45 GHz on day 5.5. We refer to Kantharia et al. (2007) for Giant Metrewave Radio Telescope (GMRT) values below 1.4 GHz.
| Date | JD | Day | Telescope | Frequency (GHz) | |||||
|---|---|---|---|---|---|---|---|---|---|
| 30 | 22.48 | 14.96 | 6 | 4.89 | 1.46 | ||||
| 17/2 | 783.83 | 4.50∗ | M | - | - | - | 142 | - | - |
| 17/2 | 784.02 | 4.70 | V | - | 26.20.5 | 23.20.6 | - | 15.20.2 | 2.80.2 |
| 18/2 | 784.82 | 5.50∗ | M | - | - | - | 332 | - | - |
| 20/2 | 786.82 | 7.46 | M | - | - | - | 41.20.8 | - | - |
| 26/2 | 793.21 | 13.88 | V | - | 61.10.7 | 50.50.5 | - | 53.30.2 | 57.60.3 |
| 01/3 | 795.66 | 16.34 | O | 556 | - | - | - | - | - |
| 01/3 | 795.62 | 16.52 | M | - | - | - | 37.91.1 | - | - |
| 02/3 | 796.62 | 17.47 | M | - | - | - | 35.80.7 | - | - |
| 06/3 | 801.18 | 21.85 | M, V | - | 36.40.9 | 37.40.6 | 435 | 44.50.2 | 48.20.3 |
| 08/3 | 802.68 | 23.36 | O | 536 | - | - | - | - | - |
| 09/3 | 803.61 | 24.28 | O | 747 | - | - | - | - | - |
| 13/3 | 807.18 | 27.85 | V | - | 69.40.7 | 52.90.6 | - | 50.30.2 | 50.40.4 |
| 14/3 | 807.83 | 28.50 | M | - | - | - | 455 | - | - |
| 23/3 | 817.73 | 38.41 | O | 1038 | - | - | - | - | - |
| 23/3 | 818.95 | 39.62 | V | - | 78.10.5 | 49.90.7 | - | 51.20.2 | 55.50.3 |
| 24/3 | 819.95 | 40.62 | M | - | - | - | 505 | - | - |
| 25/3 | 820.95 | 41.62 | V | - | 78.50.8 | 55.80.7 | - | 51.70.2 | 53.80.3 |
| 30/3 | 825.90 | 46.57 | V | - | 65.40.6 | 48.80.6 | - | 47.40.2 | 52.90.2 |
| 03/4 | 829.04 | 49.71 | M | - | - | - | 405 | - | - |
| 06/4 | 832.04 | 52.71 | V | - | 66.00.1 | 50.90.7 | - | 42.40.2 | 48.60.3 |
| 13/4 | 839.07 | 59.74 | V | - | 79.91.7 | 50.50.7 | - | 39.30.2 | 42.80.3 |
In order to follow the developments more clearly, we have plotted radio light curves and spectral energy distributions.
3.1 Light curves
The light curves in Figs. 1 and 2 show the variation in flux density in each of the four frequency bands observed with the VLA and the one observed with OCRA-p. We have also included observations from MERLIN and the GMRT with these bands, where the spectral energy distribution (SED) indicates that they are comparable despite the slightly different observation frequency. Fig. 1 shows particularly clearly the double radio peak, and the difference from the 1985 data also plotted.


The spectral index at C band was sufficiently flat (see section 3.2) to allow us to plot all the MERLIN C band observations with the corresponding VLA C band observations, even though they were at somewhat different frequencies. The main features of the light curves are as follows:
-
1.
An initial rapid rise, captured particularly well by the segmented MERLIN C band data. The rise in that band occurred at a rate of 18.50.5 mJy day-1 over days 4 and 5, peaking before day 13.88 when a VLA C band measurement shows the flux density as 53.29 mJy and declining to 37.93 mJy by day 16.29 (MERLIN C band). On day 7 the data show a consistent flux of 411 in each 30–min bin across the approximately 6.5 hr observation. Taking the uncertainty as a limit on the change in flux over that time, we find the rate of change had dropped below 3.8 mJy day-1. The lightcurves at other bands are consistent with a similar rise and fall at all observed wavelengths.
-
2.
A second rise starting before day 21.85 and peaking before day 39. Extrapolating both the second rise and subsequent decline suggests a peak around day 38.0 at 63 mJy (C band). The same pattern is evident at all bands observed with the VLA, although at K band either the minimum between the two peaks was deeper or the second rise began later. The peak flux density measured with OCRA-p at 30 GHz is consistent with this peak.
3.2 Radio spectrum
The radio broad–band spectrum varies considerably over the course of our observations, as seen in Fig. 3.

We can see immediately the effects of the rapid rise in the flux density at 1.46 GHz, as the spectrum changes from positive spectral index (S convention) across the observing bands on day 4 to having a minimum between 4.89 and 14.86 GHz on day 13 and a flat spectrum around day 21. By day 27 and up to day 46 we see a return to the central minimum. The detailed band–to–band spectral index values for the VLA observations are given in Table 2, and are also apparent in the plots of Fig. 3.
| Day | Band–to–band spectral index | ||
|---|---|---|---|
| L to C | C to U | U to K | |
| 4.7 | 1.400.07 | 0.380.03 | 0.30.1 |
| 13.88 | 0.0640.009 | 0.050.01 | 0.470.05 |
| 21.85 | 0.0680.009 | 0.160.02 | 0.00.1 |
| 27.85 | 0.00.01 | 0.050.01 | 0.670.05 |
| 39.62 | 0.0670.007 | 0.020.02 | 1.100.05 |
| 41.62 | 0.0340.007 | 0.070.01 | 0.840.05 |
| 46.57 | 0.0920.008 | 0.030.01 | 0.720.05 |
| 52.71 | 0.110.01 | 0.160.02 | 0.640.04 |
| 59.74 | 0.070.01 | 0.220.02 | 1.120.08 |
3.3 Resolved emission at K band (22.48 GHz)
While none of the images at K band are sufficiently resolved to allow us to identify structure within the emission, many have sufficient resolution to allow us to determine the overall size of the emission region following deconvolution. The results of a simple Gaussian deconvolution on nine epochs of K band data are given in Table 3.
| Days | Deconvolved extent | Fitted beam size | |||
|---|---|---|---|---|---|
| Major | Minor | PA | Major Minor | PA | |
| 4 | 423 | 233 | 1508 | 13383 | 24.84 |
| 13 | 274 | 233 | 204 | 14987 | 34.84 |
| 21 | 422 | 333 | 8311 | 14595 | 34.06 |
| 27 | 432 | 284 | 978 | 14887 | 34.28 |
| 39 | 641 | 312 | 872 | 12782 | 20.98 |
| 41 | 651 | 274 | 922 | 13181 | 27.08 |
| 46 | 691 | 532 | 1054 | 12180 | 7.44 |
| 52 | 871 | 452 | 922 | 12178 | 6.74 |
| 59 | 903 | 514 | 764 | 14384 | 33.83 |
In all cases the beam is elongated, with the major axis being between 50% and 70% longer than the minor axis. Some care must be applied when interpreting deconvolved extents. Where there are 0∘ or 180∘ between the two position angle (PA) values (extent and beam) then the deconvolution is highly uncertain as we are attempting to resolve in the direction of worst resolution. This problem affects the deconvolution for Days 4 and 13, where the difference between the PA values is 175∘ and 14∘ respectively, and we do not include these points in our subsequent discussion. In all but two of the other cases the deconvolved PA90∘, consistent with imaging results from the VLTI, EVN, MERLIN, VLBA and HST (Sokoloski, Rupen & Mioduszewski, 2008; Chesneau et al, 2008; O’Brien et al., 2006; Rupen et al., 2008; Bode et al., 2007).
3.4 VLBA image at 1.667 GHz
The image formed from VLBA data at 1.667 GHz on day 63 (Fig. 4) shows multiple components extended east–west. The inner components are in the same place and of the same size as the emission seen at 22.48 GHz with the VLA on day 59 (Table 3). Components extended east-west were seen in earlier VLBA, EVN and MERLIN data (O’Brien et al., 2006, 2008; Rupen et al., 2008; Sokoloski, Rupen & Mioduszewski, 2008) so it is reasonable to assume these are related to the more extended outer components seen here at day 63 and hence would have also been present just four days earlier at the time of the VLA imaging.
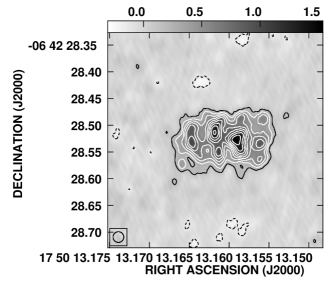
We have attempted to estimate the spectral index of these components. The eastern and brightest western components each have flux densities in Fig. 4 of 3.6 mJy. However this image is heavily tapered, and these are really lower limits on the flux density. Comparing this with a 1 upper limit for these regions in the VLA 22 GHz data of day 59, we find , wholly consistent with these features being non–thermal. If the actual flux density of the extended components is greater at L band, this value will be still more negative.
4 Discussion
4.1 Light curve development
In 1985 observations starting on day 18 were extrapolated back to an assumed “turn-on” of the emission on about day 14 (Padin et al., 1985). It is evident that the first peak seen in 2006 was before any observations in 1985. However we note that the 2006 flux density on days 16 and 17 at 6 GHz (Table 1) is significantly higher than seen on day 18 in 1985. This implies either a fairly rapid drop of 12 mJy and recovery of 20 mJy in 3 days, or that the initial peak was completed more rapidly in 1985 (if present at all). In addition it is notable that emission at lower frequencies was not seen in 1985, but is evident after day 20 in 2006 (Kantharia et al., 2007).
It is not immediately clear what the cause of this early rise is, but one possibility is that we are seeing emission from the reverse shock traversing the ejecta at early times. However, below we suggest a two–component model for the emitting regions.
A number of supernovae have shown variations in radio emission, generally attributed to the ejecta interacting with density variations in the surrounding medium (e.g. Weiler et al., 1991, 1992). This may be a contributing factor in RS Ophiuchi, where the density variations may be in the wind from the red giant, although the incomplete sampling of the radio light curve makes it difficult to test this idea.
4.2 Spectral development
Our multi–band observations show that the SED varies over timescales of a few days. The initial rapid rise at 1.46 GHz and 4.89 GHz is consistent with the emergence of an expanding source from the densest inner parts of an enveloping absorbing medium. This we identify with the red giant wind ionised by the nova eruption, and providing a source of free-free absorption. The rise between days 4 and 13 is at least 6 mJy day-1, although as it is possible that the 5 GHz flux density had peaked earlier this is a lower limit. By day 13 we are seeing a mixed optically thin and thick thermal spectrum, and it is striking that this is similar to the SED on days 38 to 46. Both these periods are at, or shortly after, a radio peak, suggesting similar emission details at these epochs. Around day 21, the brightness minimum between the two peaks, the spectrum declines with frequency across the band, indicating that the optically thin thermal emission dominates at this time. Note also that Kantharia et al. (2007) have demonstrated a non-thermal emission component dominates below 1.4 GHz from day 20. Thus while a thermal spectrum dominates at high–frequencies, a non–thermal spectrum dominates at low frequencies. Consequently in most of the bands observed with the VLA a combined spectrum is seen.
We note that the best fitting supernova–style model (fading non–thermal emission subject to variable absorption) of Kantharia et al. (2007) also fits our early L–band data (up to and including day 21). However it does not fit the higher frequency data at these early times, predicting much brighter C–band emission that turns on at earlier times than is observed. Furthermore, it clearly cannot fit the subsequent (second) peak seen in our L–band and higher frequencies. The data suggest at least two emitting components subject to differing absorption and likely to be a mix of thermal and non-thermal emission. The complexity of the geometry and emission details precludes a detailed fit to the full dataset at this stage.
4.3 Ejecta morphology
The spectral development can be further constrained by examining the morphological development of the ejecta at different wavelengths.
Day 13 coincides with a simple, if one–sided, emission shell (O’Brien et al., 2006, VLBI images). Day 21 sees the emergence of an eastern component that also experiences absorption such that it appears at 5 GHz before 1.46 GHz (O’Brien et al., 2006).
The expansion apparent from the 22 GHz images (Table 3) is consistent with a power law of the form angular size mas, where time in days has its origin on day 0. Although we discard the size measurement for day 13 at 22 GHz (section 3.3), this expansion rate is consistent with the size of the partial shell structure seen by O’Brien et al. (2006) on that day. If expansion proceeded at a constant rate at later times, this also agrees with the E-W extent of the remnant imaged by the HST on day 155 (Bode et al., 2007) At a distance of 1.6 kpc (Hjellming et al., 1986) this equates to a projected velocity of 4000 km s-1, constant within the errors (or equivalently negligible deceleration over this period, within measurement uncertainties). This 22 GHz emission is that from the inner shell seen by O’Brien et al. (2006), as we discuss below. However the data are inconsistent with a linear expansion from the time of ejection, as this would require an angular extent of 9 mas on day 0. Thus these VLA data imply a significant deceleration in the first 2 weeks after optical discovery, consistent with results in the X-ray waveband, related to deceleration of the forward shock by Bode et al. (2006).
We can relate these measurements to resolved structure at 1.667 GHz. The VLBA image at 1.667 GHz on day 63 (Fig. 4) shows an extent of 200 mas east–west. This should have been resolved by the VLA on day 59. The fact it was not indicates that the more extended features have a spectrum that declines steeply with frequency, consistent with the outlying features being due to non-thermal emission. This is supported by the limit on the spectral index of . Thus we are able to demonstrate that the initial shell seen by O’Brien et al. (2006) has a contribution from thermal component (as it is brightest at the higher frequencies), while the more extended emission is entirely non-thermal in nature. This is consistent with the findings of Sokoloski, Rupen & Mioduszewski (2008) and strongly confirms the conclusion of Taylor et al. (1989) with regard to the 1985 outburst.
This is also comparable to the results of Crocker et al (2001) for for the symbiotic star CH Cyg during ejection episodes. They found both non-thermal extended jet-like structures and a thermally-dominated central source.
4.4 Ejecta mass
We make use of the formulation of Mezger & Henderson (1967) to estimate the total ejecta mass. We use the emission on day 4.7, as at later dates it is not clear what geometry we should use – at this early time the actual distribution of matter in the emission region is most likely to be reasonably represented by a filled sphere. While there are more physically realistic models of the emission geometry possible, the uncertainties make such considerations relatively unimportant. We make a number of assumptions: that the emission is optically thin, that 50% is thermal, that we can extrapolate back from the t0.9 dependence of the 22.48 GHz angular extent to day 4.7, and finally that the electron temperature is 104 K. This gives an angular size of 8.50.2 mas (formal uncertainty) and a thermal flux density of 13.10.1 mJy. From this we find a mass of 42 M⊙.
The dependence on electron temperature is very weak (a power of 0.175) so the last assumption has little impact. The mass depends on the square root of the flux density, so a factor of two larger or smaller only changes the estimate by a factor of . The strongest dependencies are on angular size and distance. A 30% larger angular size leads to a 50% larger mass estimate, but such a large size is well outside any reasonable estimate given what we see at later dates. The dominant uncertainty is in the distance, at 1.60.3 kpc (Hjellming et al., 1986). This gives most of the 50% fractional uncertainty in the mass estimate. From this we can see that the radio emission at the earliest times is most consistent with the ejecta mass associated by modelling (Yaron et al., 2005) with a WD closer to 1.4 M⊙ than the lower values considered, excluding cases with recurrence intervals of less than a year. A higher ejecta mass by a factor of 10 could be made consistent with a lower WD mass of 1.25 M⊙.
5 Conclusions
We present 63 days of radio observations of the 2006 outburst of RS Oph with MERLIN and the VLA, with reference to additional observations with the VLBA, GMRT, Effelsberg and OCRA-p. The observations demonstrate that the emission had a mixture of thermal and non-thermal components beginning no later than 13 days after the outburst. An early radio peak before day 13 is seen for the first time. The early radio rise (up to day 5.5) is consistent with the transition from the “free–expansion” phase noted by Bode et al. (2006) and Das, Banerjee & Ashok (2006).
At the minimum between the first and second peaks the flux density declines slightly across the frequency bands, consistent with mixed thermal and non–thermal emission, but analysis of our imaging results clearly confirm the non-thermal nature of the most extended components in the VLBI imaging of O’Brien et al. (2006). At and after the second peak the spectral behaviour returns to a mixture of thermal and non-thermal emission. Comparison of the 22 GHz VLA observation on day 59 with the 1.667 GHz VLBA observation on day 63 indicates that the emerging east and west structures are non-thermal in nature with a spectral index . In addition size estimates between days 27 and 59 indicate a decelerating expansion. We find an ejecta mass of 42 M⊙, but this is probably a lower limit due to the uncertainty surrounding the overlying absorption component and the assumptions made in making the estimate. Comparison with the modelling of Yaron et al. (2005) imply a WD mass around 1.4 M⊙; a higher ejecta mass would imply a lower WD mass.
This radio development is consistent with two components – an expanding, decelerating shell seen in both non–thermal and thermal emission plus bipolar ejecta generating non–thermal emission, also seen by Sokoloski, Rupen & Mioduszewski (2008). The mechanism for generating such bipolar structures in this system requires further study, and may tell us more about the mass–loss and mass–transfer processes in recurrent novae. However it is consistent with the interpretation by Taylor et al. (1989) of the only equivalent data for the 1985 outburst, and also similar to the interpretation of radio jets during an outburst of the symbiotic star CH Cygni (Crocker et al, 2001). This is evidence of another non–thermal WD jet from a symbiotic system during an ejection episode.
Acknowledgments
MFB was supported by a PPARC/STFC Senior Fellowship. MTR was funded by the University of Central Lancashire. The Toruń group acknowledge support via the TCfA grant KBN 5 P03D 024 21. MERLIN is a National Facility operated by the University of Manchester at Jodrell Bank Observatory on behalf of the Science & Technology Facilities council. The National Radio Astronomy Observatory is a facility of the National Science Foundation operated under cooperative agreement by Associated Universities, Inc.
References
- Baars et al. (1977) Baars, J. W. M., Kernel, R., Pauliny-Toth, I. I. K., Witzel, A., 1977, A&A, 61, 99
- Bode et al. (2006) Bode, M. F., O’Brien, T. J., Osborne, J. P., Page, K. L., Senziani, F., Skinner, G. K., Starrfield, S., Ness, J.-U., Drake, J. J., Schwarz, G., Beardmore, A. P., Darnley, M. J., Eyres, S. P. S., Evans, A., Gehrels, N., Goad, M. R., Jean, P., Krautter, J., Novara, G. 2006, ApJ, 652, 629
- Bode et al. (2007) Bode, M. F., Harman, D. J., O’Brien, T. J., Bond, Howard E., Starrfield, S., Darnley, M. J., Evans, A., Eyres, S. P. S. ApJ, 665, L63
- Bryce et al. (1997) Bryce, M., Pedlar, A., Muxlow, T., Thomasson, P., Mellema, G. 1997, MNRAS, 284, 815
- Buil (2006) Buil, C., 2006, CBET, 403, 1
- Chesneau et al (2008) Chesneau, O., Nardetto, N., Millour, F., Hummel, C., Domiciano de Souza, A., Bonneau, D., Vannier, M., Rantakyrö, F., Spang, A., Malbet, F., Mourard, D., Bode, M. F., O’Brien, T. J., Skinner, G., Petrov, R. G., Stee, P., Tatulli, E., Vakili, F., 2007 A&A, 646, 119
- Crocker et al (2001) Crocker, M. M., Davis, R. J., Eyres, S. P. S., Bode, M. F., Taylor, A. R., Skopal, A., Kenny, H. T. 2001, MNRAS, 326, 781
- Das, Banerjee & Ashok (2006) Das, R., Banerjee, D. P. K., Ashok, N. M. 2006, ApJL, 653, 141
- Fekel et al. (2000) Fekel, F. C., Joyce, R. R., Hinkle, K. H., Skrutskie, M. F., 2000, AJ, 119, 1375
- Hachisu & Kato (2000) Hachisu, Izumi, Kato, Mariko, 2000, ApJ, 536, L93
- Hachisu & Kato (2001) Hachisu, Izumi, Kato, Mariko, 2001, ApJ, 558, 323
- Mezger & Henderson (1967) Mezger, P. G., Henderson, A. P., 1967, ApJ, 147, 471
- Narumi et al. (2006) Narumi, H., Hirosawa, K., Kanai, K., Renz, W., Pereira, A., Nakano, S., Nakamura, Y., Pojmanski, G., 2006, IAU Circular, 8671, 2
- Hjellming et al. (1986) Hjellming, R. M., van Gorkom, J. H., Seaquist, E. R., Taylor, A. R., Padin, S., Davis, R. J., Bode, M. F., 1986, ApJ, 305, L71
- Kantharia et al. (2007) Kantharia, N. G., Anupama, G. C., Prabhu, T. P., Ramya, S., Bode, M. F., Eyres, S. P. S., O’Brien, T. J. 2007 ApJ, 667, L171
- Lowe (2005) Lowe, S. R., 2005, Ph. D Thesis, University of Manchester
- Mason et al. (1999) Mason, B. S., Leitch, E. M., Myers, S. T., Cartwright, J. K., Readhead, A. C. S., 1999, AJ, 118, 2908
- O’Brien et al. (2006) O’Brien, T. J., Bode, M. F., Porcas, R. W., Muxlow, T. W. B., Eyres, S. P. S., Beswick, R. J., Garrington, S. T., Davis, R. J., Evans, A., 2006, Nature, 442, 279
- O’Brien et al. (2008) O’Brien, T. J., Beswick R.J., Bode M.F., Eyres S.P.S., Muxlow T.W.B., Garrington S.T., Porcas R.W., Evans A., Davis R.J., 2008, in Evans A., Bode M.F., O’Brien T.J., Darnley M.J., eds, ASP Conf. Ser. Vol 401, RS Ophiuchi (2006) and the recurrent nova phenomenon. Astron. Soc. Pac., San Francisco, p.239
- Oppenheimer & Mattei (1993) Oppenheimer, B. D., Mattei, J. A., 1993, JAVSO, 22, 105
- Osborne et al. (2007) Osborne SSS paper
- Padin et al. (1985) Padin, S., Davis, R. J., Bode, M. F., 1985, Nature, 315, 306
- Rosino (1986) Rosino, L., 1986, in: Bode, M. F. (ed.) RS Ophiuchi (1985) and the Recurrent Nova Phenomenon, p1
- Rupen et al. (2008) Rupen, M. P., Mioduszewski, A. J., Sokoloski, J. L., 2008, RS Oph ApJ in press arXiv:0711.1142
- Schaefer (2004) Schaefer, B. E., 2004, IAU Circular 8396
- Snijders (1986) Snijders, M. A. J., 1986, in: Bode, M. F. (ed.) RS Ophiuchi (1985) and the Recurrent Nova Phenomenon, p51
- Sokoloski et al. (2006) Sokoloski, J. L., Luna, G. J. M., Mukai, K., Kenyon, S. J., 2006, Nature, 442, 276
- Sokoloski, Rupen & Mioduszewski (2008) Sokoloski, J. L., Rupen, M. P., Mioduszewski, J. 2008, ApJ, 685, L137
- Spoelstra et al. (1987) Spoelstra, T. A. T., Taylor, A. R., Pooley, G. G., Evans, A., Albinson, J. S., 1987, MNRAS, 224, 791
- Starrfield (2006) Starrfield, S., 2006, in: Bode, M. F., Evans A. (eds.) Classical Novae [Second Edition]
- Taylor et al. (1989) Taylor, A. R., Davis, R. J., Porcas, R. W., Bode, M. F., 1989, MNRAS, 237, 81
- Weiler et al. (1991) Weiler, K. W., van Dyk, S. D., Discenna, J. L., Panagia, N., Sramek, R. A., 1991, ApJ, 380, 161
- Weiler et al. (1992) Weiler, K. W., van Dyk, S. D., Pringle, J. E., Panagia, N., 1992, ApJ, 399, 672
- Yaron et al. (2005) Yaron, O., Prialnik, D., Shara, M. M., Kovetz, A., 2005, ApJ, 623, 398