SN 2008ha: An Extremely Low Luminosity and Extremely Low Energy Supernova
Abstract
We present ultraviolet, optical, and near-infrared photometry as well as optical spectra of the peculiar supernova (SN) 2008ha. SN 2008ha had a very low peak luminosity, reaching only mag, and low line velocities of only 2000 km s-1 near maximum brightness, indicating a very small kinetic energy per unit mass of ejecta. Spectroscopically, SN 2008ha is a member of the SN 2002cx-like class of SNe, a peculiar subclass of SNe Ia; however, SN 2008ha is the most extreme member, being significantly fainter and having lower line velocities than the typical member, which is already 2 mag fainter and has line velocities 5000 km s-1 smaller (near maximum brightness) than a normal SN Ia. SN 2008ha had a remarkably short rise time of only 10 days, significantly shorter than either SN 2002cx-like objects ( 15 days) or normal SNe Ia ( 19.5 days). The bolometric light curve of SN 2008ha indicates that SN 2008ha peaked at ergs s-1, making SN 2008ha perhaps the least luminous SN ever observed. From its peak luminosity and rise time, we infer that SN 2008ha generated M☉ of 56Ni, had a kinetic energy of ergs, and ejected 0.15 M☉ of material. The host galaxy of SN 2008ha has a luminosity, star-formation rate, and metallicity similar to those of the Large Magellanic Cloud. We classify three new (and one potential) members of the SN 2002cx-like class, expanding the sample to 14 (and one potential) members. The host-galaxy morphology distribution of the class is consistent with that of SNe Ia, Ib, Ic, and II. Several models for generating low-luminosity SNe can explain the observations of SN 2008ha; however, if a single model is to describe all SN 2002cx-like objects, either electron capture in Ne-Mg white dwarfs causing a core collapse, or deflagration of C-O white dwarfs with SN 2008ha being a partial deflagration and not unbinding the progenitor star, are preferred. The rate of SN 2008ha-like events is 10% of the SN Ia rate, and in the upcoming era of transient surveys, several thousand similar objects may be discovered, suggesting that SN 2008ha may be the tip of a low-luminosity transient iceberg.
Subject headings:
supernovae—general, supernovae—individual(SN 1991bj, SN 2002cx, SN 2004gw, SN 2006hn, SN 2007J, SN 2008ha), galaxies—individual(UGC 12682)1. Introduction
Supernovae (SNe) are some of the most luminous and energetic events in the Universe, having a luminosity of up to mag at peak, but SN 2008ha peaked at mag and had spectra which indicated a very low kinetic energy. Although we do not know the exact way in which most SNe explode or what the progenitors are for most SNe, we have models which explain the vast majority of stellar explosions; however, the standard SN models have difficulty explaining the low luminosity and low ejecta velocity of SN 2008ha. Most SNe are the result of either the density and temperature in the core of a white dwarf (WD) increasing to the point of thermonuclear runaway at or near the Chandrasekhar mass (e.g., Hoyle & Fowler, 1960; Nomoto et al., 1984) or a decrease in pressure support in the core of a massive star leading to a gravitational collapse of the star that results in a shock wave that destroys the star (e.g., Arnett et al., 1989). Both of these scenarios produce (by coincidence) SNe which have a few times ergs of kinetic energy and peak at a few times L☉ (almost all of the energy released from a thermonuclear SN is in the form of kinetic energy, while most of the energy from a core-collapse SN is in the form of neutrinos with only 1% coupled to the baryonic matter).
SN 2008ha was discovered in UGC 12682 (an irregular galaxy with a recession velocity of 1393 km s-1 and corresponding to a Virgo-infall corrected distance modulus of mag and, assuming km s-1 Mpc-1, Mpc; all distances presented in this paper are Virgo-infall corrected) on 2008 Nov. 7.17 (UT dates are used throughout this paper) at mag 18.8 (Puckett et al., 2008). Our first spectrum showed that it was a SN Ia similar to SN 2002cx (Foley, 2008), a peculiar class of SNe (Li et al., 2003; Jha et al., 2006). SN 2008ha is similar in many ways to SN 2002cx, but there are some differences. SN 2008ha has an expansion velocity 3000 km s-1 lower than that of SN 2002cx, which has expansion velocities of 5000 km s-1 compared to 10,000 km s-1 for a normal SN Ia. SN 2008ha has a very small peak absolute magnitude ( mag) while SN 2002cx has a peak absolute magnitude of mag, 2 mag below that of normal SNe Ia, but extending the relationship between decline rate and luminosity (Phillips, 1993), both have a decline rate that is slower than expected from their luminosities. Additionally, SN 2002cx is distinguished from normal SNe Ia (see Filippenko 1997 for a review of SN spectra) by having spectra that resemble the high-luminosity SN Ia 1991T (Filippenko et al., 1992b; Phillips et al., 1992) at early and intermediate phases, except with significantly lower expansion velocities and having late-time ( 1 year after maximum) spectra which show low-velocity Fe II lines, few lines from intermediate-mass elements, and no strong forbidden lines (Jha et al., 2006; Sahu et al., 2008). Unfortunately, no maximum-light spectra were obtained and no very late-time spectra have yet been obtained for SN 2008ha, so we cannot compare SN 2008ha to SN 2002cx in these regards.
A recent study by Valenti et al. (2009, hereafter V09) has presented unfiltered and -band photometry and optical spectroscopy of SN 2008ha, concluding that it is a low-luminosity and low-energy SN. After comparing the spectra of SN 2008ha and a late-time spectrum of SN 2005hk (a SN 2002cx-like object; Chornock et al., 2006) to spectra of low-luminosity SNe II and examining the host-galaxy morphology distribution of SN 2002cx-like objects, they conclude that SN 2008ha and all SN 2002cx-like objects are core-collapse SNe. They suggest that these objects are the result of either electron capture in the O-Mg-Ne core of 7–8 M☉ stars or the core collapse of M☉ stars where material falls back onto a newly formed neutron star, quickly creating a black hole which prevents a luminous SN.
In this paper, we present additional observations, including relatively early-time filtered observations covering the ultraviolet (UV) through near-infrared (NIR), higher-resolution spectra, and a relatively late-time spectrum. Our observations indicate that SN 2008ha may have been a core-collapse SN, but not of an asymptotic giant branch (AGB) star. Thermonuclear explosion models also fit the observations. Based on a sample of 14 SN 2002cx-like objects, we conclude, in contrast to V09, that the host-galaxy morphology distribution of SN 2002cx-like objects is consistent with the population of SNe Ia, particularly SN 1991T-like SNe.
We present and discuss our [] photometry in § 2 and optical spectroscopy in § 3. In § 4, we discuss the energetics of SN 2008ha. We examine the host galaxy of SN 2008ha and all SN 2002cx-like objects in § 5. In § 6, we present several models which may explain our observations. Our results are summarized in § 7.
2. Photometry
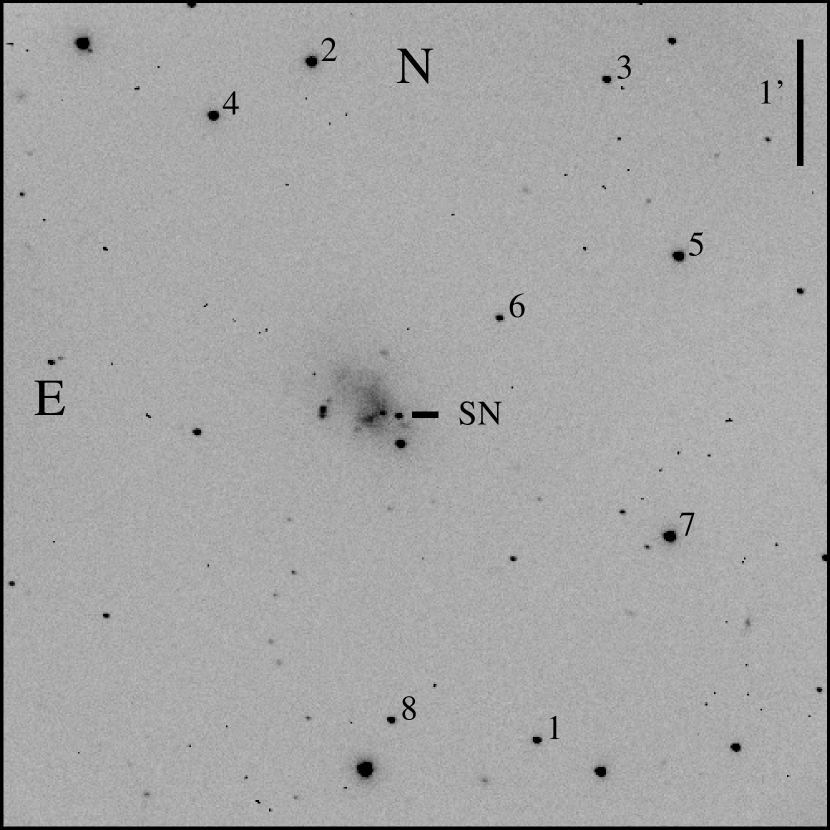
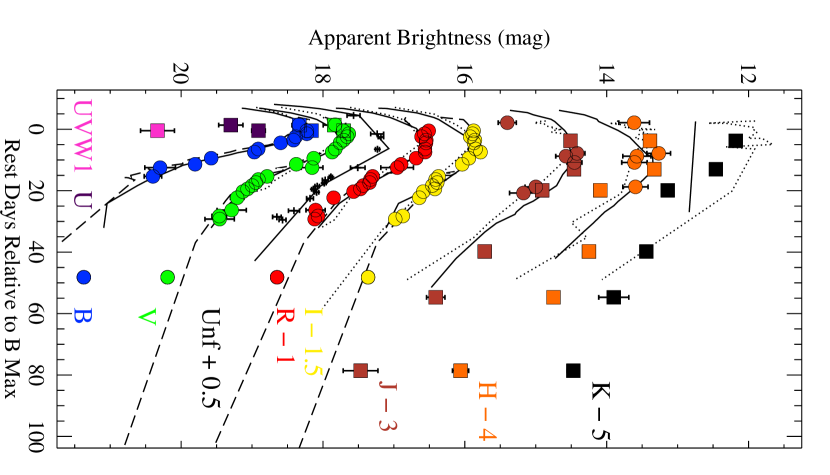
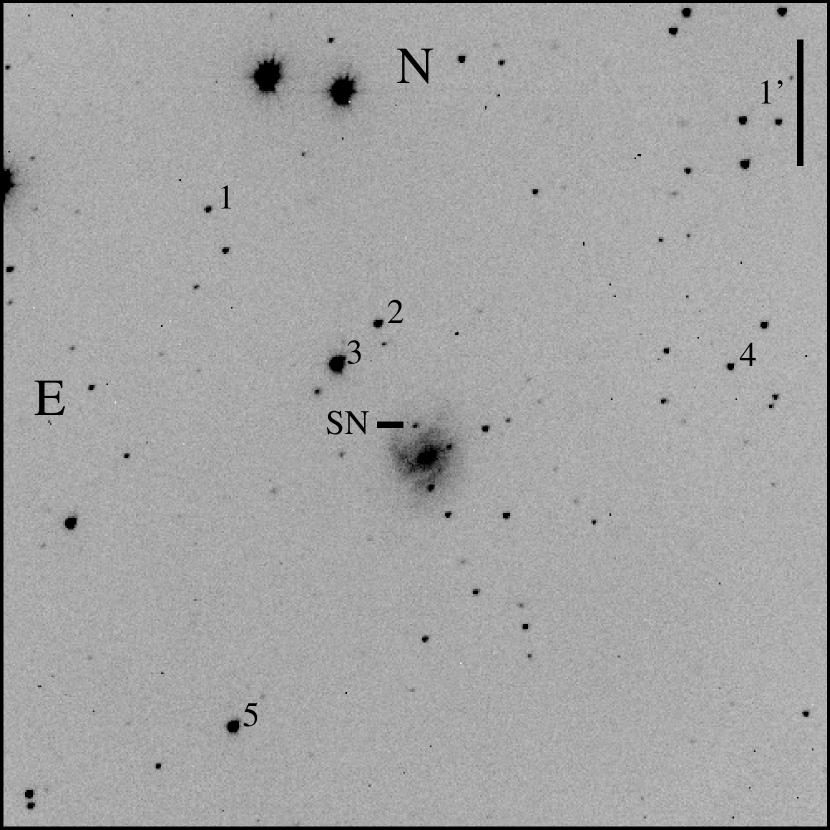
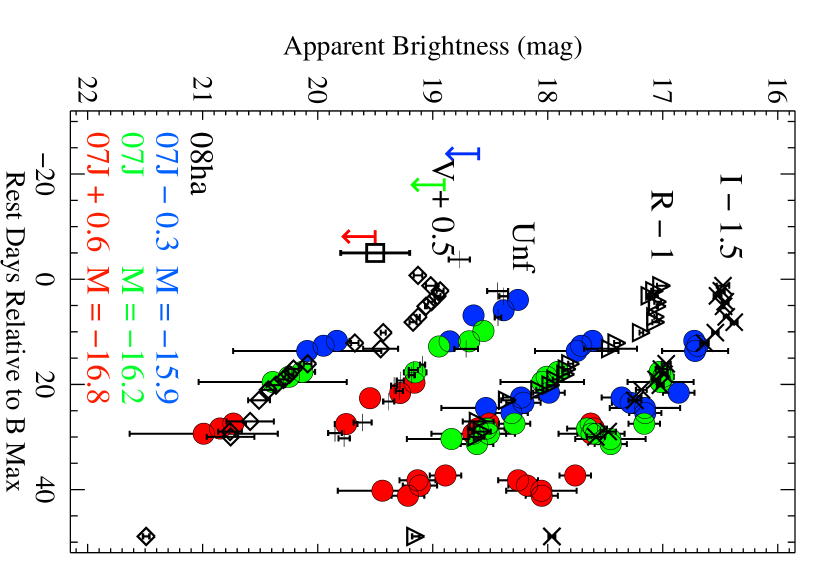
We have followed SN 2008ha photometrically with the 0.76 m Katzman Automatic Imaging Telescope (KAIT; Filippenko et al. 2001), the 1 m Nickel 1 m, the 1.3 m Peters Automated Infrared Imaging Telescope (PAIRITEL), the 6.5 m Magellan Baade telescope (with PANIC; Martini et al. 2004), and the 8-m Gemini-North telescope (with NIRI; Hodapp et al. 2003). We also reduced public photometry from the Swift satellite (with UVOT; Roming et al. 2005. A finding chart of SN 2008ha, its host galaxy, and comparison stars is shown in Figure 1. Our [] light curves are presented in Figure 2.
2.1. Lick
Accurate flux measurements of SN 2008ha require galaxy subtraction to isolate the SN flux contribution. A template for the KAIT unfiltered data was constructed using previous observations of the field during the Lick Observatory Supernova Search (Filippenko et al., 2001). KAIT and Nickel templates were not available at the time of publication. To facilitate galaxy subtraction, templates were manually constructed by taking a high-quality image and subtracting the point-spread function (PSF) of the SN to produce a smooth galaxy background. Galaxy subtraction was not attempted with the Nickel data which were taken under inferior conditions. We performed differential photometry on the SN and several local standard stars in the field using the DAOPHOT package in IRAF111IRAF: the Image Reduction and Analysis Facility is distributed by the National Optical Astronomy Observatory, which is operated by the Association of Universities for Research in Astronomy, Inc. (AURA) under cooperative agreement with the National Science Foundation (NSF). (see Table 1 for a list of stars). A single calibration was obtained under photometric conditions using the Nickel telescope to determine the zeropoint. We adopted the statistical errors output by IRAF as our final uncertainty. Our KAIT and Nickel photometry can be found in Table 2.
| Star | (J2000) | (J2000) | (mag) | (mag) | (mag) | (mag) | |
|---|---|---|---|---|---|---|---|
| SN | 23:34:52.69 | +18:13:35.4 | |||||
| 1 | 23:34:48.02 | +18:11:00.7 | 17.818(030) | 16.980(030) | 16.556(030) | 16.060(030) | 1 |
| 2 | 23:34:55.69 | +18:16:26.0 | 16.353(030) | 15.407(030) | 14.903(030) | 14.433(030) | 1 |
| 3 | 23:34:45.73 | +18:16:18.1 | 17.912(030) | 17.140(030) | 16.755(030) | 16.327(030) | 1 |
| 4 | 23:34:58.99 | +18:15:59.9 | 17.600(030) | 16.123(030) | 15.188(030) | 14.267(030) | 1 |
| 5 | 23:34:43.29 | +18:14:53.4 | 16.123(030) | 15.456(030) | 15.075(030) | 14.660(030) | 1 |
| 6 | 23:34:49.33 | +18:14:23.2 | 18.817(030) | 17.670(030) | 16.976(030) | 16.394(030) | 1 |
| 7 | 23:34:43.57 | +18:12:38.7 | 16.831(030) | 15.425(030) | 14.519(030) | 13.690(030) | 1 |
| 8 | 23:34:52.92 | +18:11:10.0 | 17.719(030) | 17.072(030) | 16.755(030) | 16.362(030) | 1 |
Note. — Uncertainties are given in parentheses.
| JD | (mag) | (mag) | (mag) | (mag) | Unfiltered (mag) | Telescope |
|---|---|---|---|---|---|---|
| 2454764.80 | KAIT | |||||
| 2454778.69 | 18.069 (092) | KAIT | ||||
| 2454781.76 | 18.340 (084) | 17.828 (037) | KAIT | |||
| 2454783.74 | 18.229 (062) | 17.718 (042) | 17.509 (041) | 17.377 (054) | KAIT | |
| 2454784.64 | 17.736 (091) | KAIT | ||||
| 2454784.71 | 18.230 (030) | 17.635 (030) | 17.570 (030) | 17.392 (030) | Nickel | |
| 2454785.67 | 18.385 (030) | 17.660 (027) | 17.610 (023) | 17.425 (034) | 17.683 (038) | KAIT |
| 2454786.80 | 18.415 (030) | 17.710 (030) | 17.544 (030) | 17.358 (030) | Nickel | |
| 2454787.67 | 18.596 (030) | 17.762 (030) | 17.552 (030) | 17.376 (030) | KAIT | |
| 2454789.68 | 18.904 (030) | 17.827 (014) | 17.573 (011) | 17.353 (030) | 17.732 (028) | KAIT |
| 2454790.71 | 18.969 (030) | 17.871 (030) | 17.560 (030) | 17.278 (030) | Nickel | |
| 2454792.70 | 19.563 (054) | 18.127 (022) | 17.689 (016) | 17.443 (030) | KAIT | |
| 2454794.68 | 19.789 (072) | 18.377 (032) | 17.904 (025) | 17.541 (037) | KAIT | |
| 2454795.78 | 20.297 (216) | 18.009 (103) | KAIT | |||
| 2454798.65 | 20.390 (123) | 18.791 (033) | 18.308 (022) | 17.876 (039) | 18.388 (022) | KAIT |
| 2454799.66 | 18.921 (046) | 18.343 (029) | 17.919 (050) | 18.468 (040) | KAIT | |
| 2454800.67 | 18.942 (035) | 18.347 (029) | 17.892 (033) | 18.482 (027) | KAIT | |
| 2454801.64 | 19.004 (044) | 18.438 (026) | 17.964 (036) | 18.589 (031) | KAIT | |
| 2454802.74 | 19.064 (082) | 18.472 (037) | 17.921 (030) | 18.635 (026) | KAIT | |
| 2454803.63 | 19.130 (054) | 18.569 (031) | 18.087 (047) | 18.589 (030) | KAIT | |
| 2454805.63 | 19.211 (095) | 18.851 (055) | 18.142 (056) | 18.682 (048) | KAIT | |
| 2454809.67 | 19.288 (206) | 19.104 (135) | 18.909 (078) | KAIT | ||
| 2454811.61 | 19.462 (103) | 19.069 (073) | 18.374 (067) | 19.150 (060) | KAIT | |
| 2454812.62 | 19.458 (207) | 19.118 (065) | 18.482 (077) | 19.070 (049) | KAIT | |
| 2454831.63 | 21.372 (030) | 20.191 (030) | 19.647 (030) | 18.864 (030) | Nickel |
Note. — Uncertainties are given in parentheses.
2.2. PAIRITEL
We obtained NIR ( ) photometry with the refurbished and fully automated 1.3-m Peters Automated Infrared Telescope (PAIRITEL)222See http://www.pairitel.org/ . located at FLWO. - and -band (1.2 and 1.6 m; Cohen et al. 2003) images were acquired simultaneously with the three NICMOS3 arrays with individual exposure times of 7.8 s. The PAIRITEL reduction pipeline software (Bloom et al., 2006) estimates the sky background from a star-masked median stack of the SN raw images. After sky subtraction, it then cross correlates, stacks, and subsamples the processed images in order to produce the final image with an effective scale of 1′′ pixel-1 and an effective FOV of 10′ 10′.
For the NIR photometry, we used the image-analysis pipeline of the ESSENCE and SuperMACHO projects and performed difference photometry (following Wood-Vasey et al. 2008) using the image-subtraction algorithm of Alard (2000). We present our PAIRITEL light curves in Table 3.
| JD | (mag) | (mag) |
|---|---|---|
| 2454781.09 | 18.401 (254) | 17.613 (432) |
| 2454791.12 | 17.418 (223) | 17.266 (334) |
| 2454792.05 | 17.574 (287) | 17.574 (396) |
| 2454794.09 | 17.455 (212) | 17.608 (358) |
| 2454802.08 | 17.999 (303) | 17.595 (356) |
| 2454804.09 | 18.173 (392) |
Note. — Uncertainties are given in parentheses.
2.3. PANIC and NIRI
Observations in were obtained using Magellan PANIC in classically scheduled mode and Gemini NIRI as part of the director’s discretionary time (program ID: GN-2008B-DD-6).
The NIRI data were reduced using the noao:gemini:niri IRAF package and its bad-pixel masks. Sky flats were generated using the 7–15 different dither positions that comprised each sequence. After the standard NIRI reduction, we used IRAF imcoadd to combine the dithers in a mosaic stack. Simple aperture photometry (0.6′′ radius) then gave the fluxes for SN 2008ha and the 1–2 2MASS stars ( 15 mag) in the resulting mosaics. We estimate a systematic uncertainty of 0.03 mag from using two stars and 0.05 mag from using just one 2MASS star.
The PANIC data were reduced using the standard IRAF PANIC reduction software available at the LCO website. We constructed a bad-pixel mask from on/off pairs of dark/lamp frames and then used the sky dithers for our flat field. The same 2MASS stars were used as calibration sources as for the NIRI data.
Both the NIRI and PANIC photometry was done with local sky subtraction in a circular annulus. With the good resolution of the Magellan and Gemini images ( 0.7′′) the SN stood out clearly from the galaxy background, and we estimate that the residual uncertainty in the subtraction of the local sky/galaxy background is 0.01 mag. Our light curves are presented in Figure 2 and Table 4.
| JD | (mag) | (stat) | (cal)aaCalibration uncertainties are 0.03 for one star and 0.05 for two as a rough summation of system and stability uncertainties. | (mag) | (stat) | (cal)aaCalibration uncertainties are 0.03 for one star and 0.05 for two as a rough summation of system and stability uncertainties. | (mag) | (stat) | (cal)aaCalibration uncertainties are 0.03 for one star and 0.05 for two as a rough summation of system and stability uncertainties. | Detector |
|---|---|---|---|---|---|---|---|---|---|---|
| 2454787.0 | 17.51 | 0.01 | 0.05 | 17.39 | 0.02 | 0.05 | 17.18 | 0.04 | 0.05 | PANIC |
| 2454796.3 | 17.46 | 0.03 | 0.05 | 17.33 | 0.03 | 0.03 | 17.46 | 0.05 | 0.03 | NIRI |
| 2454803.2 | 17.91 | 0.01 | 0.05 | 18.09 | 0.02 | 0.05 | 18.14 | 0.04 | 0.05 | NIRI |
| 2454823.2 | 18.72 | 0.05 | 0.05 | 18.25 | 0.05 | 0.03 | 18.44 | 0.05 | 0.03 | NIRI |
| 2454838.2 | 19.41 | 0.12 | 0.05 | 18.75 | 0.03 | 0.03 | 18.90 | 0.21 | 0.03 | NIRI |
| 2454862.2 | 20.47 | 0.24 | 0.05 | 20.06 | 0.11 | 0.03 | 19.47 | 0.08 | 0.03 | NIRI |
Note. — Observations calibrated to 2MASS stars. No airmass or color corrections applied.
2.4. Swift
The Swift team initiated target of opportunity observations of SN 2008ha with the Ultraviolet/Optical Telescope (UVOT; Roming et al. 2005) and the X-ray Telescope (XRT; Burrows et al. 2005) on board the Swift gamma-ray burst satellite (Gehrels et al., 2004) beginning on 2008 Nov. 11. A second, deeper epoch was obtained two days later near the optical peak, and a final set of reference images was obtained (at our request) on 2009 Feb. 3. We performed digital image subtraction on all of the UVOT data using the final epoch as a template to remove host-galaxy contamination with the ISIS software package (Alard, 2000). The -, -, and -band data were then reduced using the photometric calibration technique described by Li et al. (2006), while the UV data were photometered using the zeropoints from Poole et al. (2008). The results of our UVOT analysis are displayed in Table 5.
The XRT data were reduced using standard Swift software analysis tools. No X-ray source is detected at the location of SN 2008ha in any of our three epochs of observations. Assuming a power-law spectrum with photon index , we place the following limits on the – keV X-ray flux from SN 2008ha: 2008 Nov. 11.32, ergs cm-2 s-1; 2008 Nov. 13.19, ergs cm-2 s-1; 2009 Feb. 3.04, ergs cm-2 s-1. Using our adopted distance modulus, these fluxes correspond to isotropic luminosities of ergs s-1, ergs s-1, and ergs s-1, respectively. Several SNe Ia have been measured to have no X-ray emission at early times with limits an order of magnitude deeper (Hughes et al., 2007), while SNe Ic typically have X-ray luminosities of – ergs s-1 (Chevalier & Fransson, 2006); therefore, our X-ray limits are not particularly constraining.
| JD | (mag) | (mag) | (mag) | (mag) | (mag) | (mag) |
|---|---|---|---|---|---|---|
| 2454781.9 | 19.299 (171) | 18.333 (104) | 17.839 (158) | |||
| 2454783.7 | 20.333 (239) | 18.909 (096) | 18.161 (051) | 17.709 (067) |
Note. — Uncertainties are given in parentheses.
2.5. Light Curves
By fitting a polynomial to the light-curve peaks, we are able to measure the time of maximum brightness and peak brightness in for SN 2008ha. We find that SN 2008ha peaked in the band on JD at mag. SN 2008ha also peaked at mag. From our medium-resolution MagE spectra (see § 3), we can place a limit of Å for the equivalent with of Na D from the host galaxy, indicating minimal host-galaxy extinction. Using the distance modulus for UGC 12682, and correcting for Milky Way extinction of mag (Schlegel et al., 1998, consistent with our measured equivalent width of the Na D lines corresponding to Milky Way absorption), we find that SN 2008ha peaked at mag, about 5 mag below the peak absolute magnitude of normal SNe Ia and 2.9 mag fainter than the least luminous known SN Ia (SN 2007ax peaked at mag; Kasliwal et al. 2008). The maximum-light characteristics of SN 2008ha for can be found in Table 6.
| Filter | (mag) | (mag) | (mag) | (mag) | (mag) | (mag) | (mag) |
|---|---|---|---|---|---|---|---|
| JD of max 2,454,000 | |||||||
| Mag at max | |||||||
| Peak abs. mag | |||||||
| (mag) |
V09 presented -band and unfiltered photometry of SN 2008ha. Their light curves are broadly consistent with ours. Their first filtered data point occurred on JD 2,454,798.46 with mag. This is consistent within the uncertainties of our measurement 0.19 days later at mag. Their derived peak magnitude is 0.3 mag brighter than our measurement, but with the same time of maximum. Considering that their first filtered observations occur 12 days after our measured date of maximum, the disagreement between our measurement and their extrapolation is not surprising. They adopted a distance modulus of mag, 0.09 mag smaller than our adopted value. As a result of these two differences, they measured a peak absolute magnitude that is 0.2 mag brighter than what we have measured. Their late-time -band points are systematically fainter than our late-time points, probably from undersubtraction (for our photometry) or oversubtraction (for their photometry) of the host-galaxy light. This discrepancy should be reduced after late-time templates are obtained to perform template subtractions.
Comparing our light curves to those of SN 2002cx (Li et al., 2003), SN 2005hk (another object similar to SN 2002cx; Phillips et al. 2007), and SN 2005hg (a normal SN Ib; M. Modjaz, 2009, private communication), we find that our light curves are decline quickly, but are very similar to all three SNe if we compress the light curves in time (“stretching” the light curves by 0.7 for all three; see Figure 2). The date of maximum found from matching SN 2008ha to SNe 2002cx and 2005hk is JD , very similar what we found from polynomial fitting.
Our strongest limit on the rise time of SN 2008ha comes from a nondetection in a KAIT search image on 2008 Oct. 25 ( mag), 18.4 days before -band maximum. However, if we assume that SNe 2005hk and 2008ha have similar compositions, opacities, and temperatures (which are reasonable considering their spectral similarities; see § 3), we can estimate the rise time of SN 2008ha by scaling the light curve of SN 2005hk (which has a well-constrained rise time) to match that of SN 2008ha. SN 2005hk has a rise time of 15 days (Phillips et al., 2007), and with a scaling factor of 0.7, we determine that the rise time of SN 2008ha is days.
Finally, if we assume that SN 2008ha is a homologously expanding object, then we can use an analytic equation to solve for the rise time (Riess et al., 1999). This assumption only holds true at very early times. Using our unfiltered measurements, which are the earliest data, and the discovery measurement from Puckett et al. (2008) with no correction to match their unfiltered measurements to ours, we determine that the rise time in the unfiltered band is 11 days (if we only use the earliest 2 data points) to 18 days (if we use the earliest 3 data points). From our polynomial fits, we see that there is a 4 day lag between maximum and unfiltered maximum; applying this lag to the rise time, we find that SN 2008ha has a -band rise time of 7–14 days, consistent with the value found above by matching light curves. Our first value (7 days) is measured with only two data points, leaving zero degrees of freedom in our fit. Our second value (14 days) is measured from a fit that includes a light-curve point very close to maximum brightness, so the derived rise time should be considered a relatively strong upper limit.
In Figure 2, we see that the light curves of both SN 2002cx-like objects (represented by SNe 2002cx and 2005hk) and SNe Ib are similar near maximum light. The offsets in absolute magnitude and stretch factors necessary for each comparison SN to match SN 2008ha are listed in Table 7. SN 2002ha does not have the second maximum in the NIR bands that is common to SNe Ia; however, there appears to be a shoulder in around 20–40 days after -band maximum. SN 2005hk did not have a similar shoulder in its -band light curve (the -band coverage for SN 2005hk is only two points, and does not allow a good comparison to SN 2008ha). The extinction-corrected colors at maximum of SNe 2002cx and 2005hk are more similar to SN 2008ha than those of SN 2005hg (, 0.30, and 0.16 mag for SNe 2002cx, 2005hg, and 2005hk, respectively).
| Abs. Magnitude Offset | |||||||||
|---|---|---|---|---|---|---|---|---|---|
| SN Name | SN Type | Stretch | |||||||
| SN 2002cx | 02cx-like | 0.77 | 3.7 | 3.2 | 3.3 | 3.2 | |||
| SN 2005hk | 02cx-like | 0.73 | 3.9 | 3.7 | 3.7 | 3.7 | 3.4 | 3.6 | 3.3 |
| SN 2005hg | Ib | 0.70 | 3.4 | 3.3 | 3.4 | 3.3 | 4.0 | 4.0 | 3.5 |
2.6. Spectral Energy Distribution
On 2008 Nov. 13 (JD 2,454,783.7), 0.5 days after maximum, we have concurrent measurements in the UV (from Swift using the zeropoints of Brown et al. 2008) and optical (from KAIT). We also have NIR measurements (from Magellan) 3.3 days later. From Figure 2, we see that the bands are relatively constant between these epochs. A spectral energy distribution (SED) for SN 2008ha covering m to m, is shown in Figure 3. We see that the SED has a flat spectrum in the optical and a remarkable drop in flux in the UV.

We can compare the SED of SN 2008ha to that of other SNe that have UV-optical-IR (UVOIR) coverage near maximum light. In Figure 3, we plot the near-maximum light SEDs of SN 2005cs (Pastorello et al., 2009) and SN 2005hk (Phillips et al., 2007; Brown et al., 2008). All of these SNe have relatively similar optical and NIR colors, but their UV fluxes differ significantly. SN 2005cs has significant UV flux, while SNe 2005hk and 2008ha have line blanketing in their photosphere causing a depression of UV flux.
3. Spectroscopy
We have obtained several low and medium-resolution spectra of SN 2008ha with the FAST spectrograph (Fabricant et al., 1998) on the FLWO 1.5 m telescope, the Kast double spectrograph (Miller & Stone, 1993) on the Shane 3 m telescope at Lick Observatory, the MagE spectrograph (Marshall et al., 2008) on the Magellan Clay 6.5 m telescope, the Blue Channel spectrograph (Schmidt et al., 1989) on the 6.5 m MMT telescope, and the Low Resolution Imaging Spectrometer (LRIS; Oke et al., 1995) on the 10 m Keck I telescope.

| Telescope / | Exposure | |||
|---|---|---|---|---|
| PhaseaaDays since maximum, 2008 Nov. 12.7 (JD 2,454,783.2). | UT Date | Instrument | (s) | ObserverbbAR = A. Rest, AV = A. Vaz, BC = B. Cenko, CG = C. Griffith, DS = D. Sand, FS = F. Serduke, JB = J. Bochanski, MM = M. Modjaz, NW = N. Wright, PC = P. Challis, RC = R. Chornock, WH = W. High, WP = W. Peters, XW = X. Wang. |
| 6.5 | 2008 Nov. 19.2 | FLWO/FAST | 1800 | NW |
| 7.5 | 2008 Nov. 20.2 | FLWO/FAST | NW | |
| 7.5 | 2008 Nov. 20.2 | Lick/Kast | 2400 | CG, XW |
| 9.4 | 2008 Nov. 22.1 | FLWO/FAST | NW | |
| 10.5 | 2008 Nov. 23.2 | Lick/Kast | 1800 | BC, MM |
| 12.4 | 2008 Nov. 25.1 | FLWO/FAST | AV | |
| 14.3 | 2008 Nov. 27.0 | Clay/MagE | 1800 | JB |
| 17.5 | 2008 Nov. 30.2 | FLWO/FAST | WP | |
| 18.4 | 2008 Dec. 1.1 | FLWO/FAST | WP | |
| 22.3 | 2008 Dec. 5.0 | Clay/MagE | 200, | AR, WH |
| 22.5 | 2008 Dec. 5.2 | Lick/Kast | FS, XW | |
| 37.4 | 2008 Dec. 20.1 | MMT/Blue Channel | 600, | PC |
| 46.4 | 2008 Dec. 29.1 | MMT/Blue Channel | DS | |
| 62.5 | 2009 Jan. 14.2 | Keck/LRIS | RC |
Standard CCD processing and spectrum extraction were accomplished with IRAF. The data were extracted using the optimal algorithm of Horne (1986). Low-order polynomial fits to calibration-lamp spectra were used to establish the wavelength scale, and small adjustments derived from night-sky lines in the object frames were applied. For the MagE spectra, the sky was subtracted from the images using the method described by Kelson (2003). We employed our own IDL routines to flux calibrate the data and remove telluric lines using the well-exposed continua of the spectrophotometric standards (Wade & Horne, 1988; Foley et al., 2003).
In this Section, we will present spectra from the literature, including a spectrum from Perets et al. (in prep.), and previously unpublished spectra of SNe 2005E, 2005cs, and 2007J. Our spectra of SNe 2005E and 2005cs were obtained with LRIS mounted on Keck I on 2005 Mar. 11.3 and 2006 Apr. 27.5, respectively. Our spectra of SN 2007J were obtained with LRIS on 2007 Jan. 21.4 and 2007 Mar. 18.3 (see the Appendix).
3.1. Spectroscopic Properties of SN 2008ha
In Figure 4, we present several spectra of SN 2008ha from the classifying spectrum (Foley, 2008) to a spectrum obtained in 2009 January (corresponding to phases of to 62.5 days after maximum brightness in the band). A journal of our observations can be found in Table 8. Our earliest spectra show the distinct characteristics of the SN 2002cx-like class of objects. The spectra exhibit low-velocity lines of intermediate-mass and Fe-group elements. Examining relatively unblended lines such as O I and Na D, we measure typical ejecta velocities of 2000 km s-1. V09 found a higher ejecta velocity of 2300 km s-1. Considering the relatively large systematic uncertainties, we believe that our measurements are consistent with those found by V09.
At late times, the spectra evolve in a manner similar to that of SN 2002cx, except that SN 2008ha has exceptionally strong [Ca II] , 7323 and Ca II NIR triplet (, 8542, 8662) emission lines. The lack of H lines at any epoch indicates that the progenitor of SN 2008ha did not have a massive H envelope. Since it is difficult to excite the optical lines of He, the absence of He lines in our spectra does not necessarily mean that there was no He in the ejecta.
Tracking the minima of the absorption for several P-Cygni lines, we can measure the distribution of elements within the ejecta. In Figure 5, we show the velocity evolution for four lines (Ca H&K, Fe II , Na D, and O I ). We see only a modest decrease in the velocities of Na D and O I of only 500 and 800 km s-1 over a 60-day period, respectively. Fe II , on the other hand, decreased by 1300 km s-1 over the same period, with all three lines having the same velocity in our last spectrum. Meanwhile, Ca H&K has a much higher velocity than the other lines. For our day spectrum we find that the Ca II NIR triplet has a velocity similar to that of Ca H&K, so we do not believe that the higher velocity is the result of blending of the feature with other lines. Ca II has a very large optical depth, so we may be seeing the outermost layers of the ejecta moving at larger velocities for Ca H&K. All lines measured are multiplets and at the small line widths, the individual components can create systematic errors in measuring the minima of the features. The Ca H&K, Fe II , Na D, and O I lines have a velocity difference from their smallest to largest wavelength component relative to the -weighted wavelength for the feature of 2640, 8500, 300, and 130 km s-1, respectively. The Na D and O I lines should have the least systematic errors in their measurements. The velocity structure of SN 2008ha indicates that the Fe is well distributed throughout the ejecta and is not isolated in clumps. In our day spectrum, the [Ca II] lines are blueshifted by 400 km s-1 relative to the rest frame and have full width at half-maximum intensity (FWHM) of 1200 km s-1.

We find no evidence for He I in any of our spectra; see § 3.3 for more details.
3.2. Comparison of SN 2008ha to Other SNe
To better understand the nature of SN 2008ha, we have compared our spectra of SN 2008ha to those of other peculiar SNe that show some similarities to SN 2008ha. We focus on SNe 1989B (a normal SN Ia; Barbon et al. 1990; Wells et al. 1994), 1991T (the prototype of its subclass of SNe Ia, and similar to SN 2002cx-like objects at early times; Filippenko et al. 1992b; Phillips et al. 1992), 2002cx (the prototype of its subclass of SNe; Li et al. 2003), 2004aw (a peculiar SN Ic that was originally classified as a SN Ia; Taubenberger et al. 2006), 2005E (a “Ca-rich” SN Ib similar to prototypes SNe 2001co and 2003H; Filippenko et al. 2003a; Foley & Filippenko 2005; that was both underluminous and discovered in the halo of an S0/a galaxy; Perets et al., in prep.), 2005cs (a peculiar and low-luminosity SN II; Pastorello et al. 2006), and 2007J (a SN which is very similar to SN 2002cx at early times, but developed He I lines at later times; see the Appendix).
In Figure 6, we present our day Lick spectrum of SN 2008ha compared to the spectra of SNe 1991T and 2002cx. We have applied an inverse-variance weighted Gaussian smoothing function with characteristic velocities of 800 km s-1 and 2000 km s-1 (Blondin et al., 2006) to our SN 2008ha spectrum. To match the spectral features of SN 2008ha, in addition to removing the recession velocities of the SNe we remove an extra 7500 and 3000 km s-1 for SNe 1991T and 2002cx, respectively. This difference in characteristic velocities correspond to a different kinetic energy per unit mass; therefore, SN 2008ha has a lower kinetic energy per unit mass than SN 2002cx, which has a lower kinetic energy per unit mass than SN 1991T.
We see that the SN 2008ha spectrum smoothed with a 800 km s-1 Gaussian is very similar to SN 2002cx, indicating that SN 2008ha is spectroscopically a member of the SN 2002cx subclass of SNe. The SN 2008ha spectrum convolved with a 2000 km s-1 Gaussian is also relatively similar to the SN 1991T spectrum, but with SN 2008ha having a redder continuum than SN 1991T. The overall similarities between these objects is the result of their optical spectra being dominated by Fe II lines at this phase.

In Figure 7, we present our day spectrum of SN 2008ha with comparison spectra of SNe 1989B, 2004aw, 2005E, 2005cs, and 2007J at similar phases (with the exception of SN 2005cs). Our spectrum of SN 2005cs was obtained 304 days after explosion (Pastorello et al., 2009). We have redshifted the spectra of SNe 1989B and 2004aw (after removing their recession velocity) by a velocity of 3000 km s-1. After this correction, we see that all six objects are broadly consistent, having many similar spectral features. In particular, all objects have strong Na D and Fe II lines. The main differences are that SN 2008ha has narrower lines than those of the other objects, SNe 2005E, 2005cs, and 2008ha have strong [Ca II] and Ca II emission lines, SNe 2004aw, 2005E and 2005cs have [O I] emission, SN 2005cs has a strong H line, and SN 2007J has prominent He I emission lines.
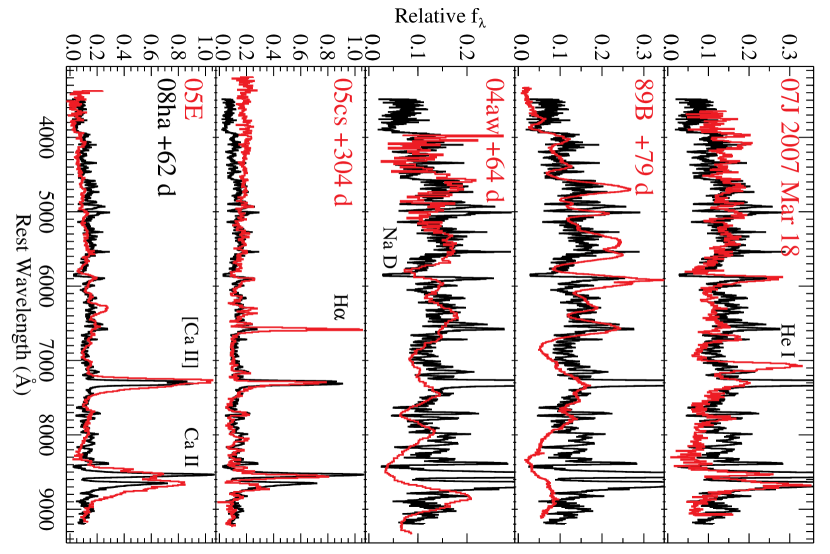
The strong [Ca II] and Ca II lines in the latest SN 2008ha spectrum present an interesting clue to the composition of the SN ejecta. The late-time ejecta of SNe II cool through line emission from H transitions. Similarly, SNe Ia and Ib/c cool through [Fe II] and [O I] lines, respectively. In all cases, these lines dominate the late-time spectra of the objects. Late-time spectra of SN 2002cx show no strong forbidden emission lines (although there are weak [Ca II] lines and lines from other intermediate-mass elements), indicating that the SN ejecta were still quite dense at least a year after maximum light (Jha et al., 2006; Sahu et al., 2008). From our measured ejecta velocity and ejecta mass measurement in § 4, our day spectrum should have an electron density of cm-3. Integrating the flux in the Ca lines, [Ca II]/Ca II . An electron temperature of 7000 K is appropriate for this density and line ratio (Ferland & Persson, 1989). At 200 days after maximum, the electron density should be cm-3, at which point we should be able to measure the relative abundance of O/Ca (Fransson & Chevalier, 1989). However, if the ejecta are in dense clumps, the density may stay high for a longer time.
3.3. SYNOW Model Fits
To investigate the details of our SN spectra, we use the supernova spectrum-synthesis code SYNOW (Fisher et al., 1997). Although SYNOW has a simple, parametric approach to creating synthetic spectra, it is a powerful tool to aid line identifications which in turn provide insights into the spectral formation of the objects. To generate a synthetic spectrum, one inputs a blackbody temperature (), a photospheric velocity (), and for each involved ion, an optical depth at a reference line, excitation temperature (), the maximum velocity of the opacity distribution (), and a velocity scale (). It assumes that the optical depth declines exponentially for velocities above with an -folding scale of . The strengths of the lines for each ion are determined by oscillator strengths and the approximation of a Boltzmann distribution of the lower level populations with a temperature of .
In Figure 8, we present our day spectrum of SN 2008ha with a synthetic spectrum generated from SYNOW. This fit has K and km s-1. Eleven ions are used in this fit. Several ions, which we consider as “secure” identifications, are important for the spectral formation of SN 2008ha. These ions account for either the most prominent or multiple line features. The secure ions include Fe II, Ca II, Na I, O I, Ti II, and Cr II. An additional 5 ions (Mg II, Si II, Mg I, C I, and Sc II) are considered to be “possible” identifications, as each of them fit one line or multiple weak lines. Because SN 2008ha has exceptionally low expansion velocities and narrow line widths, many otherwise blended lines are resolved. The fact that our SYNOW fit provides an excellent fit to over 70 line features suggests that we have identified the most important ions that contribute to the spectral formation of SN 2008ha.
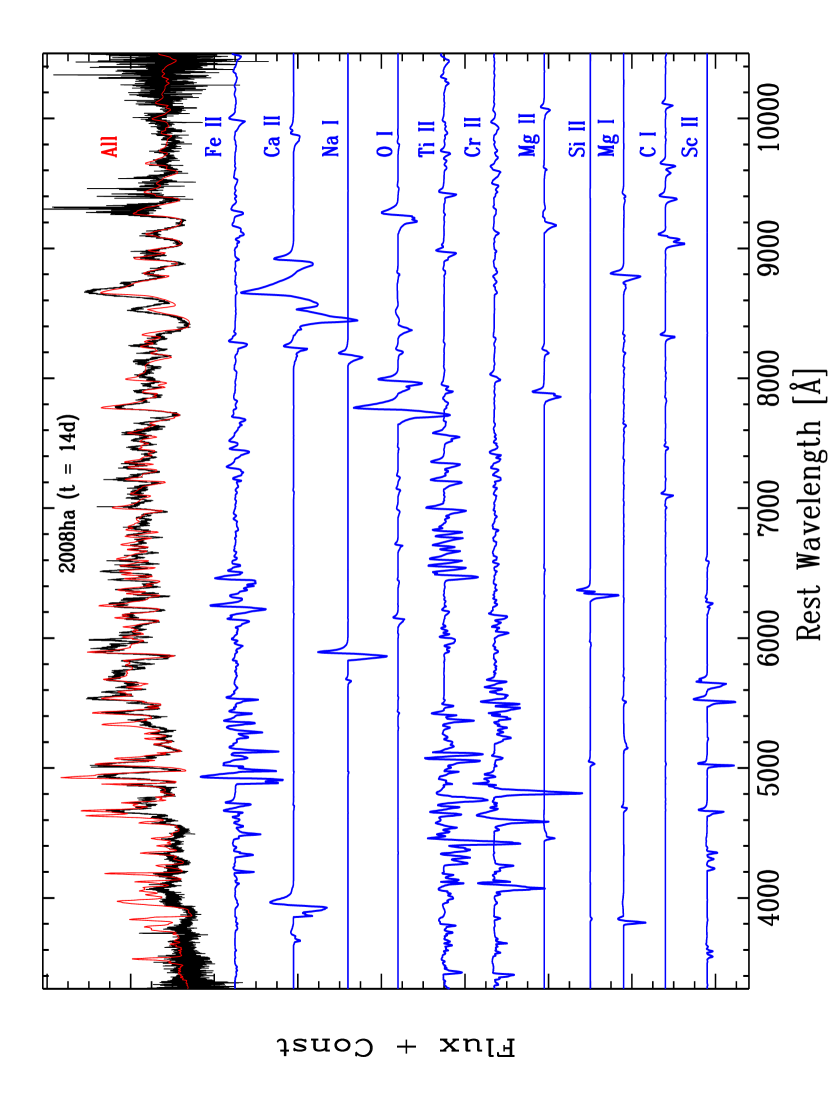
V09 presented a SYNOW fit to a spectrum taken a day after our day spectrum. Their fit used the parameters K and km s-1. Both of these values are higher than our fit. They also include He I while excluding Mg I and C I. We find that inclusion of Mg I and C I improves the fit more than Sc II; thus, Mg I and C I are more secure. We have attempted a fit that includes He I, and while it improves the fit in some wavelength regions, it makes it worse in others. Overall, we believe that adding He I to our particular model spectrum made it appear less like the spectrum of SN 2008ha.
If we simply take the ions used in our SN 2008ha model and increase the photospheric velocity to match that of SN 2002cx, the SYNOW fit is not a good match to SN 2002cx. However, if we take the SN 2008ha model, remove C I, reduce the strength of Ca II, and increase the strength of Fe II, Co I, and Co II, we can achieve a good match to SN 2002cx. This indicates that SN 2008ha has lower expansion velocities at the photosphere, stronger intermediate-mass element lines, and weaker Fe-peak element lines. These differences can all be explained by a lower energy explosion with less 56Ni production in SN 2008ha.
Because of the highly parameterized nature of the SYNOW fits, the derived quantities of the input parameters are often not unique and the associated uncertainties are difficult to estimate. Nonetheless, the distribution of the opacities in velocity space can provide useful information on the spectral formation of the SNe. In Figure 9, we plot the opacity distribution of two representative ions, Ca II for the intermediate-mass elements and Fe II for the Fe-peak elements. The opacities are normalized to be unity at the photosphere (to facilitate the making of the plot) and the high-velocity end of the curves marks . While the Ca II opacity shows a considerably flatter distribution than Fe II in SN 2002cx, the two distributions are nearly identical in SN 2008ha. The Ca II opacity distribution shows some overlap in velocity space among the SNe (SN 2008ha has significant opacity in the range 4000–6000 km s-1 because it has an enormous opacity at the photosphere). The Fe II opacity distribution, on the other hand, is nearly “stratified”; the opacity is only present between 600 and 3000 km s-1 for SN 2008ha and 5000 to 8000 km s-1 for SN 2002cx. The differences in the opacity distributions may offer clues to the nature of the explosions.

4. Energetics
Using our light curves, we are able to construct a quasi-bolometric light curve for SN 2008ha covering the wavelength range . We fit polynomials to our light curves to interpolate for dates where we have no photometry. We fit a blackbody spectrum to the data and extrapolate this fit for wavelengths longer than the band. Our resulting light curve is presented in Figure 10. We perform the same procedure for SN 2005hk (except without the band), using the light curves from Phillips et al. (2007). The SN 2005hk bolometric light curve from Phillips et al. (2007) is slightly different than the one we present. We used bands, while they used and included unpublished Swift UV photometry. To compensate for the lack of UV information, we have scaled the -band flux so that the peaks of our light curve and that of Phillips et al. (2007) have approximately the same luminosity at peak. For consistency, the same correction is applied to SN 2008ha.

The same technique is applied to the light curves of the underluminous SN II 2005cs (Pastorello et al., 2009) with the one difference that for regions where the light curve has good coverage, the light curves are interpolated between points rather than being fit by a polynomial, which does not produce a good fit to the peak and plateau stages simultaneously. The bolometric light curve of the normal SN Ia 2005cf (Wang et al., 2008) is also included.
Our bolometric light curve of SN 2008ha is poorly constrained before maximum brightness, where our photometric coverage is sparse. Similarly, beyond 40 days after explosion ( 30 days after maximum) the light curve is poorly constrained. Additional late-time data will improve the light curve by constraining the late-time decay rate.
From Figure 10, we see that SN 2008ha is an extremely low-luminosity event, with a peak luminosity of erg s-1. This indicates that at peak, SNe 2005cf and 2005hk were 170 and 40 times more luminous than SN 2008ha, respectively. Ignoring the SN IIn imposters, which are likely luminous outbursts of luminous blue variables (Van Dyk et al., 2003; Maund et al., 2006; Berger et al., 2009; Smith et al., 2008, LBVs; e.g.,), SN 2008ha is perhaps the least luminous SN ever observed (SN 1999br had a quasi-bolometric peak luminosity of , but a significant percentage of its luminosity may have been emitted at UV or NIR wavelengths; Pastorello et al. 2004). Integrating the light curves, we see that over the first 30 days after explosion, SN 2008ha emitted ergs, while SN 2005hk emitted 50 times more energy ( ergs) and SN 2005cs emitted 5 times more energy ( ergs).
While the bolometric light curves of SNe 2005hk and 2008ha are declining at 30 days after explosion, the bolometric light curve of SN 2005cs is relatively flat at 30 days after explosion, maintaining that luminosity until 100 days after explosion. The late-time energy emission can contribute significantly to the overall energy emitted by SN 2005cs, while the bulk of the energy emitted by SNe 2008ha and 2005hk is well represented by the early-time bolometric light curves. SN 2005cs emitted a similar amount of energy as SN 2008ha over the first month after explosion; however, the peak luminosity of SN 2008ha is smaller than the luminosity of SN 2005cs on its plateau.
Making some simple assumptions about the SN ejecta and assuming that the light curve is predominantly powered by 56Ni, we can determine the 56Ni mass from the rise time and peak of the bolometric light curve (Arnett, 1982). Using a rise time of 10 days and a peak luminosity of ergs s-1, we derive a 56Ni mass of M☉ (with the majority of the error coming from the uncertainty in the rise time). However, the decay of 56Ni may not be the main source of energy. Alternatively, the SN may be powered by other radioactive nuclei or circumstellar interaction (although no evidence of this is observed).
We can break the degeneracy of and by examining the rise time of the light curves. While the ejecta velocity is proportional to , the rise time of a SN light curve is proportional to (Arnett, 1982). Combining these equations and assuming that two objects have the same opacity, we have
| (1) |
and
| (2) |
Using a SN Ia as a reference with days and km s-1, we find and . Assuming ergs and M☉, we find ergs and M☉.
Additionally, we can measure the ejecta mass directly if we know the opacity. From Arnett (1982) and Pinto & Eastman (2000), we find
| (3) |
where is the rise time and is the opacity. A value of cm2 g-1 is reasonable for a spectrum dominated by Fe II lines (Pinto & Eastman, 2000). This value is consistent with what we found above; however, we gained no new information, since both assumed cm2 g-1. A smaller value of would result in a larger ejecta mass.
As discussed in § 2, V09 derived a peak absolute -band magnitude that is 0.2 mag brighter than what we have measured. They then scaled the 56Ni mass derived for SN 2005hk (Phillips et al., 2007) by the difference in the luminosities of SNe 2005hk and 2008ha in the band to derive . Although they ignored the difference in rise times between SNe 2005hk and 2008ha, our derived values for are similar because the rise-time effect is partially canceled by the difference in luminosity. They also derived a kinetic energy of ergs, an order of magnitude larger than what we have determined, and an ejecta mass of –0.7 M☉, slightly larger than what we have found. They do not measure a rise time for SN 2008ha, so presumably for their derived values they used the rise time of SN 2005hk. They also used their measured value of km s-1, which is slightly larger than our value of 2000 km s-1. Using their values, we would measure a kinetic energy and ejecta mass 3.1 and 2.3 times larger than our reported values, respectively. Making these changes brings their values closer to ours, but the kinetic energy is still discrepant.
5. Host Galaxies
Examining the host galaxies of SNe can indicate realistic potential progenitors. For instance, SNe Ia are routinely found in elliptical galaxies, indicating that at least some of them come from an older stellar population. V09 examined the host-galaxy morphology distribution of several SN 2002cx-like objects, finding that all 8 SNe in their sample (including SN 2007J, which may not be a true member of the class; see the Appendix) were in late-type hosts (Sb or later). They then claim that the probability that SNe Ia and SN 2002cx-like objects share the same parent population is between 5% and 14%. However, they did not include SNe 2008A (Blondin & Berlind, 2008), 2008ae (Blondin & Calkins, 2008), 2008ge (Stritzinger et al., 2008), or 2009J (Stritzinger, 2009), all of which have been classified as SN 2002cx-like objects in the literature. Two of the four objects that they did not include (SNe 2008ae and 2008ge) have S0 hosts, while another (SN 2008A) has an Sa host.
In this Section, we will first add three previously misclassified members to the SN 2002cx class. With this extended sample, we will compare the host-galaxy morphology distribution of SN 2002cx-like objects to other SN classes.
5.1. The Extended Sample of SN 2002cx-like Objects
In the literature, there are currently 10 SNe identified as SN 2002cx-like objects. In Figure 11, we present optical spectra of SNe 1991bj, 2004gw, and 2006hn, all of which we propose are new members of this class.

The spectra of SNe 1991bj and 2006hn were obtained with the UV Schmidt and Kast spectrographs, respectively, mounted on the Lick 3 m Shane telescope. The spectra of SN 2004gw were obtained with LRIS mounted on the Keck I telescope. Classifications based on these spectra were originally reported by Pollas et al. (1992), Foley & Filippenko (2005) and Filippenko & Foley (2005), and Foley et al. (2006) for SNe 1991bj, 2004gw, and 2005hn, respectively. SN 1991bj was recently identified as a potential member of this class (Stanishev et al., 2007). SN 2004gw was originally classified as a probable SN Ia with “a number of spectral peculiarities” (Foley & Filippenko, 2005), but Gal-Yam (2005) suggested that it may be a SN Ic. Finally, Filippenko & Foley (2005) reclassified the object as a SN Ia. Additional observing details can be found in those references as well as in Foley et al. (2009). In Figure 11, we compare the spectra of these objects to spectra of SN 2002cx. The spectra shown here demonstrate clearly that each of these SNe belongs to the SN 2002cx class. (Incidentally, a striking number of peculiar SN classes had their first members discovered in 1991.) In addition to these 14 objects, there is one potential member: SN 2007J.
SN 2007J, which had many similarities to SN 2002cx at early times (Filippenko et al., 2007a), eventually developed He emission lines (Filippenko et al., 2007b), unlike any other SN in this class. We discuss SN 2007J in detail in the Appendix. Although this object has many similarities to SN 2002cx, the presence of He I lines in its spectra casts doubt on its inclusion in this class. SN 2008ha also has some significant differences from SN 2002cx. However, we believe that these differences are caused mainly by the low-energy explosion in SN 2008ha rather than differences in progenitors.
5.2. Host Galaxies of SN 2002cx-like Objects
Using the extended sample of SN 2002cx-like objects, we investigate the host galaxies of the this class. In Table 5.2, the detailed host information for 14 members of this class and 1 potential member is presented. We exclude SN 2007J from the host-galaxy analysis, but its inclusion does not significantly change the results.
| SN Name | Reference | Host-Galaxy Name | Morphology |
|---|---|---|---|
| 1991bj | 1,2,3 | IC 344 | Sb |
| 2002cx | 4,5,6 | CGCG 044-035 | Sb |
| 2003gq | 7,8 | NGC 7407 | Sbc |
| 2004gw | 1,9,10 | PGC 16812 | Sbc |
| 2005P | 6 | NGC 5468 | Scd |
| 2005cc | 11 | NGC 5383 | Sb |
| 2005hk | 12,13,14 | UGC 272 | Sd |
| 2006hn | 1,15 | NGC 6154 | Sa |
| 2007JaaShows He I emission lines at late times and may not be a true member of the class. It has been removed from the sample when discussing host-galaxy properties. | 1,16,17 | UGC 1778 | Sd |
| 2007qd | 18 | SDSS J020932.74-005959.6 | Sc |
| 2008A | 19 | NGC 634 | Sa |
| 2008ae | 20 | IC 577 | S0 |
| 2008ge | 21 | NGC 1527 | S0 |
| 2008ha | 1,22,23 | UGC 12682 | Irr |
| 2009J | 24 | IC 2160 | Sbc |
References. — 1 = This paper, 2 = Pollas et al. (1992), 3 = Stanishev et al. (2007), 4 = Li et al. (2003), 5 = Branch et al. (2004), 6 = Jha et al. (2006), 7 = Filippenko et al. (2003b), 8 = Filippenko & Chornock (2003), 9 = Foley & Filippenko (2005), 10 = Filippenko & Foley (2005), 11 = Antilogus et al. (2005), 12 = Chornock et al. (2006), 13 = Phillips et al. (2007), 14 = Sahu et al. (2008), 15 = Foley et al. (2006), 16 = Filippenko et al. (2007a), 17 = Filippenko et al. (2007b), 18 = Goobar et al. (2007), 19 = Blondin & Berlind (2008), 20 = Blondin & Calkins (2008), 21 = Stritzinger et al. (2008), 22 = Foley (2008), 23 = V09, 24 = Stritzinger (2009).
None of the SN 2002cx-like objects have elliptical hosts. With six SN 2002cx-like objects and two potential members, V09 made the claim that all SN 2002cx-like objects have late-type hosts; however, with our extended sample, this claim does not hold. In our extended sample, which has twice the number of definitive SN 2002cx-like objects than the sample presented by V09, there is 1/14 (3/14) objects with S0 (S0 through Sa) host galaxies.
A comparison sample was generated using the SNe found in galaxies monitored by KAIT (which includes the host of SN 2008ha). Comparing the host-galaxy morphology of various (sub)classes of SNe may indicate similarities in progenitors. For consistency, we use the host-galaxy classification scheme presented in Leaman et al. (2009), derived mainly from NED, and we divide the galaxies into eight morphology bins. In Figure 12, the fraction of host galaxies in these eight morphological bins for several SN classes is presented.
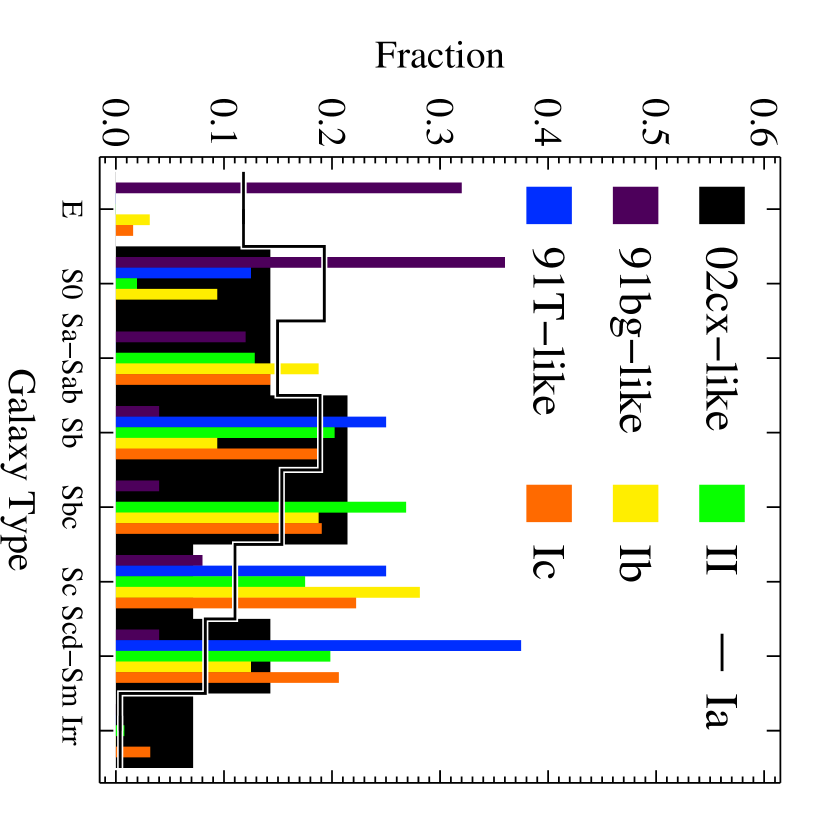
The well-known results that SN 1991bg-like objects (Filippenko et al., 1992a; Leibundgut et al., 1993) tend to be found in early-type galaxies (relative to normal SNe Ia; Howell 2001), while SNe Ib, Ic, II, and 1991T-like SNe have distributions skewed to later-type host galaxies relative to that of normal SNe Ia are immediately apparent in Figure 12. SN 2002cx-like events have, on average, later-type host galaxies than normal SNe Ia.
Examining Figure 12, all distributions other than that of SN 1991bg-like SN host galaxies are somewhat similar. Performing a Kolmogorov-Smirnov (K-S) test on the data, we find that SN 1991bg-like objects, SNe II, and SNe Ic have significantly different distributions from normal SNe Ia. SNe Ib and SN 1991T-like objects have marginally different distributions from normal SNe Ia. In a similar study, Kelly et al. (2008) found that the locations of SNe Ia, Ib, and II all followed the galaxy light, while SNe Ic were more likely to be found in the brightest regions of a galaxy, indicating more massive progenitors for SNe Ic than SNe Ib or II. Except for SN 1991bg-like objects, no SN class has a significantly different host-galaxy morphology distribution from SN 2002cx-like objects. Although these results may change with a slightly different sample (KAIT is biased to luminous galaxies) or with increased numbers, we cannot say that SN 2002cx-like objects have a different host-galaxy morphology distribution from any SN class other than SN 1991bg-like events.
Using the sample presented by V09, we find that SN 2002cx-like objects have a distribution marginally inconsistent with that of normal SNe Ia. We also find that their host-galaxy morphology distribution is very similar to that of the SN 1991T-like objects from the KAIT sample. Therefore, even with the incomplete sample of V09, SN 2002cx-like objects have a consistent host-galaxy morphology distribution to one subclass of SNe Ia.
We find that 12% of the normal SN Ia hosts in the KAIT sample are elliptical galaxies. If SN 2002cx-like events have the same host-morphology distribution as normal SNe Ia, we would expect to have found SNe ( if we include SN 2007J) of the SN 2002cx class in elliptical galaxies, consistent with our finding zero members in elliptical galaxies. We find that 31% of SNe Ia come from E through S0/a galaxies. If we assume that SN 2002cx-like objects and normal SNe Ia have the same host-galaxy morphology distribution, then we would expect SNe ( if we include SN 2007J) of the SN 2002cx class in early-type galaxies. This prediction is consistent with our measurement of 2 members in early-type galaxies.
5.3. The Host Galaxy of SN 2008ha
In addition to the morphology measurements for all SN 2002cx-like host galaxies, we have made additional measurements of UGC 12682, the host of SN 2008ha.
Takamiya et al. (1995) measured UGC 12682 to have mag and mag within an aperture of 84.5′′ radius. With our adopted distance modulus and correcting for Milky Way extinction (Schlegel et al., 1998), we find mag, comparable to the absolute magnitude of the Large Magellanic Cloud (LMC; mag).
For our LRIS observation, we positioned the slit to go through a bright knot in UGC 12682. The emission from the host galaxy in a 16′′ aperture around this bright knot displays intensity ratios of [N II] /H and [O III] /H. The N2 and O3N2 metallicity indicators of Pettini & Pagel (2004) give consistent estimates for the host-galaxy oxygen abundance of , well below the solar value of 8.9 or 8.7 (Delahaye & Pinsonneault, 2006; Asplund et al., 2005).
We can use the far-infrared luminosity of UGC 12682 to estimate its star formation rate (SFR). Assuming a distance of 21.3 Mpc and the IRAS measurements of the 60 and 100 m flux (Melisse & Israel, 1994), the calibration of Kennicutt (1998) yields an estimate for the SFR of 0.07 M☉ yr-1. Although this seems low for a “star forming” galaxy, it is consistent with its luminosity. Using the same calibration for the far-IR luminosity, Whitney et al. (2008) find a SFR for the LMC of 0.17 M☉ yr-1, about 2.5 times larger than that of UGC 12682 (while the LMC is about 1.5 times more luminous).
6. Model Comparisons
With our extensive data set, derived values for the energetics, host-galaxy properties, and knowledge of the host-galaxy morphology distribution of SN 2002cx-like objects, we can investigate various scenarios which may lead to a SN similar to SN 2008ha. These models can generally be separated into two classes: core-collapse and thermonuclear explosions. In the former, the progenitor is a massive star whose internal pressure support is surpassed by gravitational pressure, causing a collapse and subsequent explosion. The latter class requires a thermonuclear explosion of degenerate matter. We certainly have not examined all possible models, but we have addressed some of the more prevalent models for exotic SNe.
Based on their light curve, spectra, and host-galaxy information, V09 claim that SN 2008ha and all SN 2002cx-like objects are core-collapse events. Specifically, they suggest that SN 2008ha was either the result of a fallback event or an electron-capture event of the O-Ne-Mg core of a 7–8 M☉ star. We will examine both of these scenarios in addition to other models which may explain our observations of SN 2008ha.
A correct model for SN 2008ha must reproduce the following observations: a peak luminosity of erg s-1, a rise time of 10 days, ejecta velocities of 2000 km s-1, an ejecta mass of 0.15 M☉, a 56Ni mass (assuming that the light curve is powered by the radioactive decay of 56Ni) of M☉, and a kinetic energy of ergs. Additionally, if all SN 2002cx-like objects including SNe 2007J and 2008ha are to be explained by one model, it must explain the occurrence of some objects in S0 galaxies, large ranges of luminosity, rise time, and energy, and the presence of He in the progenitor star and/or circumstellar environment. With these constraints in mind, we examine each model in turn.
6.1. Direct Collapse/Fallback
It has been suggested that during the gravitational collapse of a massive star, the entire star may collapse directly to a black hole instead of creating a shock wave that disrupts the outer layers of the star. Alternatively, a massive star could produce a proto-neutron star near the limiting mass during collapse, which would then quickly create a black hole by accreting some material which falls back onto the proto-neutron star. These processes would not produce any or much electromagnetic radiation, resulting in a faint (or potentially no) SN.
The progenitors of these systems must be very massive stars to produce a black hole. Although other factors such as metallicity, binarity, or rotation may determine if a particular star will directly collapse to a black hole, most estimates suggest that an initial mass of M☉ is necessary (Heger et al., 2003). Similarly, an initial mass of M☉ is necessary to create a black hole through fallback (Fryer, 1999).
Massive SN Ic progenitor stars lose their outer hydrogen and helium layers through either stellar winds/outbursts or binary transfer. For a single-star system, the amount of mass loss through winds is directly dependent on the metallicity of the star. Modjaz et al. (2008) found that the sites of broad-lined SNe Ic (a subclass of SNe Ic with expansion velocities up to ) that are not associated with GRBs have metallicities similar to solar metallicity. The progenitors of weak SNe Ic (where a black hole is formed through fallback) should have lower metallicities than that of the progenitors of normal SNe Ic (Heger et al., 2003).
Since the progenitors of black holes must be very massive stars, we expect the distribution of their associated SNe to be heavily biased to star-forming galaxies. The host of SN 2008ha is an irregular galaxy. In § 5, we found for UGC 12682, the host of SN 2008ha, a subsolar oxygen abundance of and a SFR of 0.07 M☉ yr-1, which we determined was large considering its luminosity is comparable to that of the LMC. A 40 M☉ star with subsolar metallicity has a lifetime of yr (Schaller et al., 1992). With our measured SFR and an LMC initial-mass function (Massey et al., 1995), we calculate that there are 120 stars with M☉ in UGC 12682 at any given time. Using the lifetime of these stars, we estimate a SN rate of yr-1 for these stars.
All observations of SN 2008ha can be explained through this model if we assume that it had the precise initial conditions necessary to barely produce an explosion, rather than directly collapse to a black hole. V09 make no specific claims regarding this scenario. For the class of SN 2002cx-like objects, this model would explain the diversity of the class. While most objects in this class are hosted by a range of star-forming galaxies, one of these objects have S0 hosts. We do not expect there to be a large population of massive stars in these galaxies (although a more thorough search for current star formation in this particular host is necessary). It is therefore unlikely that this model is the mechanism for all members of the SN 2002cx-like class.
6.2. Electron Capture
Stars with an initial mass of 9 M☉ will evolve to a super-AGB stage with a massive, degenerate, O-Ne-Mg core. These stars may evolve further to become O-Ne WDs. Either in the AGB or white dwarf (WD) phases, electron capture can then induce a core-collapse event, triggering a SN (e.g., Miyaji et al., 1980; Nomoto, 1984; Kitaura et al., 2006; Metzger et al., 2008). These models predict a small 56Ni mass (– M☉) and explosion energy ( ergs) (Kitaura et al., 2006).
Since there is no hydrogen present in the spectra of SN 2008ha, its progenitor could not have been an AGB star. Similarly, the progenitors of SN 2002cx-like objects could not be AGB stars. However, this intermediate-mass range for progenitor stars is consistent with the host-galaxy morphology distribution of SN 2002cx-like events (see § 5.2). V09 suggest that electron capture of a star with a O-Ne-Mg core is a possible model for SN 2008ha. However, we conclude that if electron capture is the correct model for SN 2008ha, the progenitor must have been a WD.
Metzger et al. (2008) presents a model for a single WD collapsing to a neutron star through electron capture. In this model, they predict the creation of M☉ of 56Ni ejected at relativistic velocities, but essentially no intermediate-mass elements. However, if two WDs merge and subsequently collapse to a neutron star, there will be material at the radius of the recently formed WD and at the radius of the newly formed neutron star. The material around the neutron star would produce the same ejecta with the same energy as the single-star model, but the explosion would occur within the WD accretion disk, mass-loading the explosion, reducing the kinetic energy per unit mass, increasing the opacity (and thus the time scale of the event), and heating the WD accretion disk to temperatures where intermediate-mass elements may form (but not hot enough to produce additional 56Ni).
The conventional electron-capture scenario of an AGB star does not fit the observations of any of the SN 2002cx-like objects. If the progenitor is a single WD, the model fails to produce the intermediate-mass elements or low velocities seen for these objects. However, if there is a WD merger followed by the accretion-induced collapse of the newly formed WD, we may reproduce the observations of all SN 2002cx-like objects. Additionally, if one of the objects was a He WD, this model may explain the He I lines seen in the spectra of SN 2007J.
6.3. Deflagration
It has been suggested that SN 2002cx-like objects are the result of a pure deflagration of a possibly sub-Chandrasekhar-mass WD (e.g., Branch et al., 2004; Phillips et al., 2007). This scenario explains the low velocities and luminosities of these events. Such an event would retain a significant amount of unburned material in its core, leading to strong [O I] emission at late times (Kozma et al., 2005); however, this has not been seen in the late-time spectra of SNe 2002cx or 2005hk (Jha et al., 2006; Sahu et al., 2008, although this may only be the result of the high density at late times).
In the context of SN 2008ha, the energetics constrain the model further. If the progenitor star was a Chandrasekhar-mass WD, the energy released, , during the explosion must be larger than the binding energy, ergs, to unbind the star. With an expansion velocity of 2000 km s-1 and 1.4 M☉ of ejecta, SN 2008ha would have ergs or . This scenario requires that the energy created in the explosion be just above the binding energy of the star. Since the kinetic energy scales with the ejecta mass (which scales with the progenitor mass in this case), a sub-Chandrasekhar explosion does not improve the energy problem. This balancing problem means that it is unlikely that SN 2008ha was a deflagration of a WD that disrupted its progenitor star. Furthermore, in § 4, we found M☉, significantly below what is expected from a full disruption of a WD.
Numerical models of WD explosions have found some events which produce a deflagration burning front that rises from within the star to the surface, reaching a velocity of 5000 km s-1 at the surface with some material up to 10000 km s-1, but does not unbind the star (e.g., Calder et al., 2004; Livne et al., 2005). In this scenario, we expect relatively small 56Ni ( M☉) and ejecta masses.
Except for the lack of late-time [O I] emission, the higher-luminosity members of the SN 2002cx-like class are consistent with a full deflagration of a WD; however, SN 2008ha is inconsistent. On the other hand, the light curves, line velocities, composition, energetics, and host-galaxy properties of SN 2008ha are all consistent with a failed deflagration. If this model is correct for SN 2007J, the He lines must be the result of interaction with circumstellar material.
6.4. .Ia “Supernova”
For the “.Ia” model, first proposed by Bildsten et al. (2007), a binary WD system similar to AM CVn with a low accretion rate will eventually undergo a particularly luminous outburst caused by nuclear burning of a helium shell with M☉. This flash will generate Fe-peak radioactive nuclei similar to a SN Ia, but the smaller mass of radioactive elements and ejected material produce a less luminous, rapid light curve, with high-velocity ejecta.
This model makes several predictions. The 56Ni mass should be M☉ and the absolute magnitude should be in the range of to mag. Since the ejecta mass should be small (similar to the mass of the helium shell, 0.05 M☉), the rise time should be short (2–10 days). Because there is a large ratio, the ejecta velocity should be large ( 15000 km s-1). Given that the progenitors are AM CVn systems, the host-galaxy population should be dominated by early-type galaxies. The rise time and luminosity of SN 2008ha are on the extreme edges of the ranges found by Bildsten et al. (2007). However, the ejecta velocity of SN 2008ha is much lower than that predicted, and its host galaxy is an irregular galaxy, an unlikely galaxy in which to find such an event (but since there are old stellar systems in all galaxies, this alone should not eliminate the model).
If we take the model of Bildsten et al. (2007) and modify it so that the nuclear burning is less efficient, the explosion would produce less 56Ni but have a similar amount of ejecta, producing a fainter event with a lower ejecta velocity, while the rise time would be approximately the same. If the kinetic energy is proportional to the 56Ni mass, then to match the observed ejecta velocity, we would expect the 56Ni to be a factor of 50 smaller than that presented by Bildsten et al. (2007). This implies M☉, similar to what we found from an examination of the light curve in § 4.
The inefficient version of the .Ia model appears to reproduce the properties of SN 2008ha. Since this model involves a He WD, some of the ejecta (or alternatively, circumstellar material from the mass transfer) may be unburned He. This model may explain the He emission lines present in SN 2007J, but lack of strong [O I] in the late-time spectra of SN 2002cx. However, the ejecta mass and rise times predicted by this model do not match those observed for most SN 2002cx-like objects. Additionally, the progenitor systems of this model are members of an old stellar population, so we are unlikely to have discovered these objects exclusively in spiral galaxies. Thus, this model probably does not apply to all SN 2002cx-like events.
7. Discussion and Conclusions
SN 2008ha is spectroscopically a member of the SN 2002cx-like class of SNe, but it is an extreme case. Its luminosity, kinetic energy, and total energy released are all perhaps the smallest of any SN observed (excluding probable LBV outbursts misclassified as SNe; Van Dyk et al. 2003; Maund et al. 2006; Berger et al. 2009; Smith et al. 2008; and references therein). If SN 2008ha was a thermonuclear explosion (either a failed deflagration or a SN .Ia), the progenitor star survived the explosion. If the SN was a core-collapse event, there should be a black hole remnant.
Until recently, the SN 2002cx-like SNe Ia have been described as peculiar SNe Ia. The extremely low luminosity and kinetic energy of SN 2008ha require that we re-examine the accepted ideas regarding the progenitors of this class. These objects are hosted in non-elliptical galaxies, but their host-galaxy distribution is statistically similar to that of any SN type except for SN 1991bg-like objects. This distribution, including two objects found in S0 galaxies, makes the direct collapse/fallback scenario unlikely for some objects of this class. Similarly, the lack of objects in elliptical galaxies makes the SN .Ia model unlikely. Although they do not fit the observations perfectly, we prefer the electron-capture and deflagration scenarios for this class.
Our data do not exclude thermonuclear explosions for SN 2008ha or any SN 2002cx-like object. Although there are core-collapse models which are adequate at describing our observations of SN 2008ha, unlike V09 we do not claim that SN 2008ha (and more generally, all SN 2002cx-like objects) are definitively core-collapse events.
The LOSS and amateur SN searches, which have found the vast majority of the nearby SNe in the last decade and whose depth is typically mag 19, would only be able to detect objects similar to SN 2008ha to a distance modulus of mag, corresponding to 40 Mpc. In the past 10 years, there have been 60 SNe Ia discovered with mag. Considering that objects as faint as SN 2008ha would stay above the detection limit for a very short time in most of these galaxies, while normal SNe Ia would be observable for over a year, it is quite possible that SN 2008ha-like events could represent 2%–10% of SNe Ia; however, SN 2008ha may be a singular event. The rough rate determined from this single object is very similar to the rate determined by Bildsten et al. (2007) for AM CVn outbursts of 2%–6% in late-type galaxies as well as the WD merger rate.
Further observations of SN 2008ha will reveal additional information about this interesting object. Continuing imaging will provide a better comparison to other SN light curves and will constrain models. A late-time spectrum should reveal detailed information about the explosion and its byproducts. Deep early-time X-ray and radio observations of SN 2002cx-like objects may help distinguish between models.
Finally, the era of large, deep transient surveys is about to begin. Searches such as Pan-STARRS, PTF, SkyMapper, and LSST, which should find – SNe per year, may provide thousands of objects similar to SN 2008ha over their lifetimes, allowing a statistical analysis of a large sample of objects.
Appendix A SN 2007J
SN 2007J was discovered in UGC 1778, which has a recession velocity of 5034 km s-1 (Wegner et al., 1993) and Galactic coordinates (yielding a distance modulus mag), on 2008 Jan. 15.21 at mag 18.2 (Lee et al., 2007). It was originally classified as a SN 2002cx-like object (Filippenko et al., 2007a), but a later spectrum showed He I emission lines, causing Filippenko et al. (2007b) to reclassify SN 2007J as a SN Ib.
To determine if SN 2007J is truly a member of the SN 2002cx-like class, we examine its light curve and spectra in more detail. A finding chart of SN 2007J, its host galaxy, and comparison stars is shown in Figure 13.
A.1. Photometry
In Figure 14, we present our and unfiltered light curves of SN 2007J matched to SN 2008ha. Our KAIT photometry is given in Table 10 and calibration-star information can be found in Table 11. In Figure 14, we examine the absolute magnitude of SN 2007J by matching its light curves to those of SN 2008ha. We apply three different shifts of magnitude and in time to roughly match SN 2008ha with modest constraints. Despite the poor coverage of SN 2007J, the light curves appear to be very similar, with both having very fast declines. If we assume that our first observation of SN 2007J corresponds to its peak brightness, we can place an upper limit on the peak absolute magnitude of SN 2007J. Similarly, using our nondetection of SN 2007J and assuming that the light curves of SNe 2007J and 2008ha are similar, we can place a lower limit on its absolute magnitude at peak.
Assuming a Milky Way extinction of mag (Schlegel et al., 1998) and negligible host-galaxy extinction, we determine that the absolute magnitude of SN 2007J falls in the range mag. Matching the features in the light curves of SNe 2007J and 2008ha, which are of low significance, we find mag for SN 2007J.
| JD | (mag) | (mag) | (mag) | Unfiltered (mag) |
|---|---|---|---|---|
| 2454075.74 | ||||
| 2454107.69 | ||||
| 2454115.75 | 18.559 (050) | |||
| 2454117.75 | 18.683 (075) | |||
| 2454118.75 | 18.945 (058) | |||
| 2454123.66 | 19.634 (110) | 18.910 (065) | 18.526 (062) | 19.153 (092) |
| 2454124.61 | 19.749 (092) | 19.010 (058) | 18.498 (094) | |
| 2454125.62 | 19.891 (645) | 19.049 (363) | 18.519 (288) | |
| 2454133.69 | 19.289 (138) | 18.662 (138) | ||
| 2454134.62 | 19.532 (158) | 19.159 (174) | ||
| 2454135.64 | 19.511 (150) | 19.080 (163) | ||
| 2454136.64 | 19.837 (388) | 18.956 (306) | ||
| 2454137.62 | 19.615 (143) | 18.952 (140) |
Note. — Uncertainties are given in parentheses.
| Star | (J2000) | (J2000) | (mag) | (mag) | (mag) | (mag) | |
|---|---|---|---|---|---|---|---|
| SN | 02:18:51.70 | +33:43:43.3 | |||||
| 1 | 02:18:59.65 | +33:45:28.1 | 18.681(008) | 17.830(017) | 17.379(004) | 16.939(004) | 3 |
| 2 | 02:18:53.14 | +33:44:32.7 | 18.481(016) | 17.105(013) | 16.173(005) | 15.408(007) | 3 |
| 3 | 02:18:54.71 | +33:44:13.4 | 14.365(005) | 13.785(011) | 13.434(001) | 13.092(009) | 3 |
| 4 | 02:18:39.59 | +33:44:11.6 | 18.609(003) | 17.552(015) | 16.928(006) | 16.455(008) | 3 |
| 5 | 02:18:58.77 | +33:41:19.5 | 16.005(005) | 15.119(011) | 14.618(001) | 14.134(006) | 3 |
Note. — Uncertainties are given in parentheses.
We have assumed no color difference between SNe 2007J and 2008ha. When shifting to determine the luminosity limits, the colors are slightly different from SN 2008ha, while the best-fit shift has essentially the same colors as SN 2008ha. Although SN 2007J appears to have a lower luminosity than normal SNe Ia, and may have a luminosity below most SN 2002cx-like SNe and normal SNe Ib/c (although the limits are consistent with SN 2007J having a luminosity similar to those classes), it is still much more luminous than SN 2008ha which peaked at mag. As we discuss below, SN 2007J is spectroscopically similar to SN 2002cx, but develops He I lines at late times. Our light curves of SN 2007J do not cover this epoch.
A.2. Spectroscopy
From our analysis of its light curve above, we see that our SN 2007J spectra obtained on 2007 Jan. 21.4 and 2007 Mar. 18.3 correspond roughly to phases of and days, respectively. In Figure 15, we present our spectra of SN 2007J compared to spectra of SN 2008ha at similar phases.

Our first spectrum of SN 2007J is fairly similar to that of SN 2008ha at a similar epoch (after blueshifting the spectrum of SN 2008ha by 3000 km s-1), displaying most of the same line features. Even ignoring the differences in line velocity and width, there are additional differences between these spectra. Our second spectrum of SN 2007J is less similar to that of SN 2008ha. Both spectra contain many of the same features, but SN 2007J now shows prominent He I emission lines while SN 2008ha has strong Ca II and [Ca II] emission lines. Although there are several differences between the objects, SN 2007J is relatively similar to SN 2008ha and is a potential member of the SN 2002cx-like class.
The He I emission present in the spectrum of SN 2007J caused Filippenko et al. (2007b) to argue that SN 2007J was a core-collapse event. However, He I emission by itself simply indicates He in the SN environment, not necessarily that the progenitor underwent core collapse. The He I line with the least contamination from other lines in our SN 2007J spectrum is the line; with a FWHM of 3900 km s-1, it is wider than other lines in the spectra (typical FWHM km s-1). The He I line profiles are similar to those of the peculiar SN Ib 2006jc (Foley et al., 2007; Pastorello et al., 2007), perhaps indicating that the He I emission is the result of circumstellar interaction rather than forming in the SN photosphere. He I emission lines have not been seen in the spectra of any other SN 2002cx-like SNe, including very late-time spectra (Jha et al., 2006; Sahu et al., 2008), casting the SN 2002cx-like classification for SN 2007J in doubt.
References
- Alard (2000) Alard, C. 2000, A&AS, 144, 363
- Antilogus et al. (2005) Antilogus, P., Garavini, G., Gilles, S., Pain, R., Aldering, G., Bailey, S., Lee, B. C., Loken, S., Nugent, P., Perlmutter, S., Scalzo, R., Thomas, R. C., Wang, L., Weaver, B., Bonnaud, C., Pecontal, E., Blanc, N., Bongard, S., Copin, Y., Gangler, E., Sauge, L., Smadja, G., Kessler, R., Baltay, C., Rabinowitz, D., & Bauer, A. 2005, The Astronomer’s Telegram, 502, 1
- Arnett (1982) Arnett, W. D. 1982, ApJ, 253, 785
- Arnett et al. (1989) Arnett, W. D., Bahcall, J. N., Kirshner, R. P., & Woosley, S. E. 1989, ARA&A, 27, 629
- Asplund et al. (2005) Asplund, M., Grevesse, N., & Sauval, A. J. 2005, in Astronomical Society of the Pacific Conference Series, Vol. 336, Cosmic Abundances as Records of Stellar Evolution and Nucleosynthesis, ed. T. G. Barnes, III & F. N. Bash, 25–+
- Barbon et al. (1990) Barbon, R., Benetti, S., Rosino, L., Cappellaro, E., & Turatto, M. 1990, A&A, 237, 79
- Berger et al. (2009) Berger, E., Soderberg, A. M., Chevalier, R. A., Fransson, C., Foley, R. J., Leonard, D. C., Debes, J. H., Diamond-Stanic, A. M., Dupree, A. K., Ivans, I. I., Simmerer, J., Thompson, I. B., & Tremonti, C. A. 2009, ArXiv e-prints, 0901.0710
- Bildsten et al. (2007) Bildsten, L., Shen, K. J., Weinberg, N. N., & Nelemans, G. 2007, ApJ, 662, L95
- Blondin & Berlind (2008) Blondin, S. & Berlind, P. 2008, Central Bureau Electronic Telegrams, 1198, 1
- Blondin & Calkins (2008) Blondin, S. & Calkins, M. 2008, Central Bureau Electronic Telegrams, 1250, 1
- Blondin et al. (2006) Blondin, S., Dessart, L., Leibundgut, B., Branch, D., Höflich, P., Tonry, J. L., Matheson, T., Foley, R. J., Chornock, R., Filippenko, A. V., Sollerman, J., Spyromilio, J., Kirshner, R. P., Wood-Vasey, W. M., Clocchiatti, A., Aguilera, C., Barris, B., Becker, A. C., Challis, P., Covarrubias, R., Davis, T. M., Garnavich, P., Hicken, M., Jha, S., Krisciunas, K., Li, W., Miceli, A., Miknaitis, G., Pignata, G., Prieto, J. L., Rest, A., Riess, A. G., Salvo, M. E., Schmidt, B. P., Smith, R. C., Stubbs, C. W., & Suntzeff, N. B. 2006, AJ, 131, 1648
- Bloom et al. (2006) Bloom, J. S., Starr, D. L., Blake, C. H., Skrutskie, M. F., & Falco, E. E. 2006, in ASP Conf. Ser. 351: Astronomical Data Analysis Software and Systems XV, ed. C. Gabriel, C. Arviset, D. Ponz, & S. Enrique, 751–+
- Branch et al. (2004) Branch, D., Baron, E., Thomas, R. C., Kasen, D., Li, W., & Filippenko, A. V. 2004, PASP, 116, 903
- Brown et al. (2008) Brown, P. J., Holland, S. T., Immler, S., Milne, P., Roming, P. W. A., Gehrels, N., Nousek, J., Panagia, N., Still, M., & Vanden Berk, D. 2008, ArXiv e-prints, 0803.1265
- Burrows et al. (2005) Burrows, D. N., Hill, J. E., Nousek, J. A., Kennea, J. A., Wells, A., Osborne, J. P., Abbey, A. F., Beardmore, A., Mukerjee, K., Short, A. D. T., Chincarini, G., Campana, S., Citterio, O., Moretti, A., Pagani, C., Tagliaferri, G., Giommi, P., Capalbi, M., Tamburelli, F., Angelini, L., Cusumano, G., Bräuninger, H. W., Burkert, W., & Hartner, G. D. 2005, Space Science Reviews, 120, 165
- Calder et al. (2004) Calder, A. C., Plewa, T., Vladimirova, N., Lamb, D. Q., & Truran, J. W. 2004, ArXiv Astrophysics e-prints, 0405162
- Cardelli et al. (1989) Cardelli, J. A., Clayton, G. C., & Mathis, J. S. 1989, ApJ, 345, 245
- Chevalier & Fransson (2006) Chevalier, R. A. & Fransson, C. 2006, ApJ, 651, 381
- Chornock et al. (2006) Chornock, R., Filippenko, A. V., Branch, D., Foley, R. J., Jha, S., & Li, W. 2006, PASP, 118, 722
- Cohen et al. (2003) Cohen, M., Wheaton, W. A., & Megeath, S. T. 2003, AJ, 126, 1090
- Delahaye & Pinsonneault (2006) Delahaye, F. & Pinsonneault, M. H. 2006, ApJ, 649, 529
- Fabricant et al. (1998) Fabricant, D., Cheimets, P., Caldwell, N., & Geary, J. 1998, PASP, 110, 79
- Ferland & Persson (1989) Ferland, G. J. & Persson, S. E. 1989, ApJ, 347, 656
- Filippenko (1997) Filippenko, A. V. 1997, ARA&A, 35, 309
- Filippenko & Chornock (2003) Filippenko, A. V. & Chornock, R. 2003, IAU Circ., 8211, 2
- Filippenko et al. (2003a) Filippenko, A. V., Chornock, R., Swift, B., Modjaz, M., Simcoe, R., & Rauch, M. 2003a, IAU Circ., 8159, 2
- Filippenko & Foley (2005) Filippenko, A. V. & Foley, R. J. 2005, IAU Circ., 8486, 3
- Filippenko et al. (2003b) Filippenko, A. V., Foley, R. J., & Desroches, L. 2003b, IAU Circ., 8170, 2
- Filippenko et al. (2007a) Filippenko, A. V., Foley, R. J., Silverman, J. M., Blondin, S., Matheson, T., & Berlind, P. 2007a, Central Bureau Electronic Telegrams, 817, 1
- Filippenko et al. (2007b) Filippenko, A. V., Foley, R. J., Silverman, J. M., Chornock, R., Li, W., Blondin, S., & Matheson, T. 2007b, Central Bureau Electronic Telegrams, 926, 1
- Filippenko et al. (2001) Filippenko, A. V., Li, W. D., Treffers, R. R., & Modjaz, M. 2001, in ASP Conf. Ser. 246: IAU Colloq. 183: Small Telescope Astronomy on Global Scales, ed. B. Paczynski, W.-P. Chen, & C. Lemme, 121–+
- Filippenko et al. (1992a) Filippenko, A. V., Richmond, M. W., Branch, D., Gaskell, M., Herbst, W., Ford, C. H., Treffers, R. R., Matheson, T., Ho, L. C., Dey, A., Sargent, W. L. W., Small, T. A., & van Breugel, W. J. M. 1992a, AJ, 104, 1543
- Filippenko et al. (1992b) Filippenko, A. V., Richmond, M. W., Matheson, T., Shields, J. C., Burbidge, E. M., Cohen, R. D., Dickinson, M., Malkan, M. A., Nelson, B., Pietz, J., Schlegel, D., Schmeer, P., Spinrad, H., Steidel, C. C., Tran, H. D., & Wren, W. 1992b, ApJ, 384, L15
- Fisher et al. (1997) Fisher, A., Branch, D., Nugent, P., & Baron, E. 1997, ApJ, 481, L89+
- Foley (2008) Foley, R. J. 2008, Central Bureau Electronic Telegrams, 1576, 2
- Foley et al. (2009) Foley, R. J. et al. 2009, in prep.
- Foley & Filippenko (2005) Foley, R. J. & Filippenko, A. V. 2005, IAU Circ., 8465, 2
- Foley et al. (2006) Foley, R. J., Moore, M., Wong, D. S., Pooley, D., & Filippenko, A. V. 2006, Central Bureau Electronic Telegrams, 694, 1
- Foley et al. (2003) Foley, R. J., Papenkova, M. S., Swift, B. J., Filippenko, A. V., Li, W., Mazzali, P. A., Chornock, R., Leonard, D. C., & Van Dyk, S. D. 2003, PASP, 115, 1220
- Foley et al. (2007) Foley, R. J., Smith, N., Ganeshalingam, M., Li, W., Chornock, R., & Filippenko, A. V. 2007, ApJ, 657, L105
- Fransson & Chevalier (1989) Fransson, C. & Chevalier, R. A. 1989, ApJ, 343, 323
- Fryer (1999) Fryer, C. L. 1999, ApJ, 522, 413
- Gal-Yam (2005) Gal-Yam, A. 2005, The Astronomer’s Telegram, 391, 1
- Gehrels et al. (2004) Gehrels, N., Chincarini, G., Giommi, P., Mason, K. O., Nousek, J. A., Wells, A. A., White, N. E., Barthelmy, S. D., Burrows, D. N., Cominsky, L. R., Hurley, K. C., Marshall, F. E., Mészáros, P., Roming, P. W. A., Angelini, L., Barbier, L. M., Belloni, T., Campana, S., Caraveo, P. A., Chester, M. M., Citterio, O., Cline, T. L., Cropper, M. S., Cummings, J. R., Dean, A. J., Feigelson, E. D., Fenimore, E. E., Frail, D. A., Fruchter, A. S., Garmire, G. P., Gendreau, K., Ghisellini, G., Greiner, J., Hill, J. E., Hunsberger, S. D., Krimm, H. A., Kulkarni, S. R., Kumar, P., Lebrun, F., Lloyd-Ronning, N. M., Markwardt, C. B., Mattson, B. J., Mushotzky, R. F., Norris, J. P., Osborne, J., Paczynski, B., Palmer, D. M., Park, H.-S., Parsons, A. M., Paul, J., Rees, M. J., Reynolds, C. S., Rhoads, J. E., Sasseen, T. P., Schaefer, B. E., Short, A. T., Smale, A. P., Smith, I. A., Stella, L., Tagliaferri, G., Takahashi, T., Tashiro, M., Townsley, L. K., Tueller, J., Turner, M. J. L., Vietri, M., Voges, W., Ward, M. J., Willingale, R., Zerbi, F. M., & Zhang, W. W. 2004, ApJ, 611, 1005
- Goobar et al. (2007) Goobar, A., Nichol, R., Molla, M., Castander, F., Miquel, R., Galbany, L., Romani, R., Zheng, C., Sako, M., Wheeler, C., Schneider, D., Bender, R., Hopp, U., Kollatschny, W., Garnavich, P., Jha, S., Silverman, J., Filippenko, A., & Foley, R. 2007, Central Bureau Electronic Telegrams, 1137, 2
- Heger et al. (2003) Heger, A., Fryer, C. L., Woosley, S. E., Langer, N., & Hartmann, D. H. 2003, ApJ, 591, 288
- Hodapp et al. (2003) Hodapp, K. W., Jensen, J. B., Irwin, E. M., Yamada, H., Chung, R., Fletcher, K., Robertson, L., Hora, J. L., Simons, D. A., Mays, W., Nolan, R., Bec, M., Merrill, M., & Fowler, A. M. 2003, PASP, 115, 1388
- Horne (1986) Horne, K. 1986, PASP, 98, 609
- Howell (2001) Howell, D. A. 2001, ApJ, 554, L193
- Hoyle & Fowler (1960) Hoyle, F. & Fowler, W. A. 1960, ApJ, 132, 565
- Hughes et al. (2007) Hughes, J. P., Chugai, N., Chevalier, R., Lundqvist, P., & Schlegel, E. 2007, ApJ, 670, 1260
- Jha et al. (2006) Jha, S., Branch, D., Chornock, R., Foley, R. J., Li, W., Swift, B. J., Casebeer, D., & Filippenko, A. V. 2006, AJ, 132, 189
- Kasliwal et al. (2008) Kasliwal, M. M., Ofek, E. O., Gal-Yam, A., Rau, A., Brown, P. J., Cenko, S. B., Cameron, P. B., Quimby, R., Kulkarni, S. R., Bildsten, L., Milne, P., & Bryngelson, G. 2008, ApJ, 683, L29
- Kelly et al. (2008) Kelly, P. L., Kirshner, R. P., & Pahre, M. 2008, ApJ, 687, 1201
- Kelson (2003) Kelson, D. D. 2003, PASP, 115, 688
- Kennicutt (1998) Kennicutt, Jr., R. C. 1998, ARA&A, 36, 189
- Kitaura et al. (2006) Kitaura, F. S., Janka, H.-T., & Hillebrandt, W. 2006, A&A, 450, 345
- Kozma et al. (2005) Kozma, C., Fransson, C., Hillebrandt, W., Travaglio, C., Sollerman, J., Reinecke, M., Röpke, F. K., & Spyromilio, J. 2005, A&A, 437, 983
- Leaman et al. (2009) Leaman, J. et al. 2009, in prep.
- Lee et al. (2007) Lee, N., Li, W., Newton, J., & Puckett, T. 2007, Central Bureau Electronic Telegrams, 809, 1
- Leibundgut et al. (1993) Leibundgut, B., Kirshner, R. P., Phillips, M. M., Wells, L. A., Suntzeff, N. B., Hamuy, M., Schommer, R. A., Walker, A. R., Gonzalez, L., Ugarte, P., Williams, R. E., Williger, G., Gomez, M., Marzke, R., Schmidt, B. P., Whitney, B., Coldwell, N., Peters, J., Chaffee, F. H., Foltz, C. B., Rehner, D., Siciliano, L., Barnes, T. G., Cheng, K.-P., Hintzen, P. M. N., Kim, Y.-C., Maza, J., Parker, J. W., Porter, A. C., Schmidtke, P. C., & Sonneborn, G. 1993, AJ, 105, 301
- Li et al. (2003) Li, W., Filippenko, A. V., Chornock, R., Berger, E., Berlind, P., Calkins, M. L., Challis, P., Fassnacht, C., Jha, S., Kirshner, R. P., Matheson, T., Sargent, W. L. W., Simcoe, R. A., Smith, G. H., & Squires, G. 2003, PASP, 115, 453
- Li et al. (2006) Li, W., Jha, S., Filippenko, A. V., Bloom, J. S., Pooley, D., Foley, R. J., & Perley, D. A. 2006, PASP, 118, 37
- Livne et al. (2005) Livne, E., Asida, S. M., & Höflich, P. 2005, ApJ, 632, 443
- Marshall et al. (2008) Marshall, J. L., Burles, S., Thompson, I. B., Shectman, S. A., Bigelow, B. C., Burley, G., Birk, C., Estrada, J., Jones, P., Smith, M., Kowal, V., Castillo, J., Storts, R., & Ortiz, G. 2008, in Society of Photo-Optical Instrumentation Engineers (SPIE) Conference Series, Vol. 7014, Society of Photo-Optical Instrumentation Engineers (SPIE) Conference Series
- Martini et al. (2004) Martini, P., Persson, S. E., Murphy, D. C., Birk, C., Shectman, S. A., Gunnels, S. M., & Koch, E. 2004, in Society of Photo-Optical Instrumentation Engineers (SPIE) Conference Series, Vol. 5492, Society of Photo-Optical Instrumentation Engineers (SPIE) Conference Series, ed. A. F. M. Moorwood & M. Iye, 1653–1660
- Massey et al. (1995) Massey, P., Lang, C. C., Degioia-Eastwood, K., & Garmany, C. D. 1995, ApJ, 438, 188
- Maund et al. (2006) Maund, J. R., Smartt, S. J., Kudritzki, R.-P., Pastorello, A., Nelemans, G., Bresolin, F., Patat, F., Gilmore, G. F., & Benn, C. R. 2006, MNRAS, 369, 390
- Melisse & Israel (1994) Melisse, J. P. M. & Israel, F. P. 1994, A&AS, 103, 391
- Metzger et al. (2008) Metzger, B. D., Piro, A. L., & Quataert, E. 2008, ArXiv e-prints, 0812.3656
- Miller & Stone (1993) Miller, J. S. & Stone, R. P. S. 1993, Lick Obs. Tech. Rep. 66 (Santa Cruz: Lick Obs.)
- Miyaji et al. (1980) Miyaji, S., Nomoto, K., Yokoi, K., & Sugimoto, D. 1980, PASJ, 32, 303
- Modjaz et al. (2008) Modjaz, M., Kewley, L., Kirshner, R. P., Stanek, K. Z., Challis, P., Garnavich, P. M., Greene, J. E., Kelly, P. L., & Prieto, J. L. 2008, AJ, 135, 1136
- Nomoto (1984) Nomoto, K. 1984, ApJ, 277, 791
- Nomoto et al. (1984) Nomoto, K., Thielemann, F.-K., & Yokoi, K. 1984, ApJ, 286, 644
- Oke et al. (1995) Oke, J. B., Cohen, J. G., Carr, M., Cromer, J., Dingizian, A., Harris, F. H., Labrecque, S., Lucinio, R., Schaal, W., Epps, H., & Miller, J. 1995, PASP, 107, 375
- Pastorello et al. (2006) Pastorello, A., Sauer, D., Taubenberger, S., Mazzali, P. A., Nomoto, K., Kawabata, K. S., Benetti, S., Elias-Rosa, N., Harutyunyan, A., Navasardyan, H., Zampieri, L., Iijima, T., Botticella, M. T., di Rico, G., Del Principe, M., Dolci, M., Gagliardi, S., Ragni, M., & Valentini, G. 2006, MNRAS, 370, 1752
- Pastorello et al. (2007) Pastorello, A., Smartt, S. J., Mattila, S., Eldridge, J. J., Young, D., Itagaki, K., Yamaoka, H., Navasardyan, H., Valenti, S., Patat, F., Agnoletto, I., Augusteijn, T., Benetti, S., Cappellaro, E., Boles, T., Bonnet-Bidaud, J.-M., Botticella, M. T., Bufano, F., Cao, C., Deng, J., Dennefeld, M., Elias-Rosa, N., Harutyunyan, A., Keenan, F. P., Iijima, T., Lorenzi, V., Mazzali, P. A., Meng, X., Nakano, S., Nielsen, T. B., Smoker, J. V., Stanishev, V., Turatto, M., Xu, D., & Zampieri, L. 2007, Nature, 447, 829
- Pastorello et al. (2009) Pastorello, A., Valenti, S., Zampieri, L., Navasardyan, H., Taubenberger, S., Smartt, S. J., Arkharov, A. A., Baernbantner, O., Barwig, H., Benetti, S., Birtwhistle, P., Botticella, M. T., Cappellaro, E., Del Principe, M., Di Mille, F., Di Rico, G., Dolci, M., Elias-Rosa, N., Efimova, N. V., Fiedler, M., Harutyunyan, A., Hoeflich, P. A., Kloehr, W., Larionov, V. M., Lorenzi, V., Maund, J. R., Napoleone, N., Ragni, M., Richmond, M., Ries, C., Spiro, S., Temporin, S., Turatto, M., & Wheeler, J. C. 2009, ArXiv e-prints, 0901.2075
- Pastorello et al. (2004) Pastorello, A., Zampieri, L., Turatto, M., Cappellaro, E., Meikle, W. P. S., Benetti, S., Branch, D., Baron, E., Patat, F., Armstrong, M., Altavilla, G., Salvo, M., & Riello, M. 2004, MNRAS, 347, 74
- Pettini & Pagel (2004) Pettini, M. & Pagel, B. E. J. 2004, MNRAS, 348, L59
- Phillips (1993) Phillips, M. M. 1993, ApJ, 413, L105
- Phillips et al. (2007) Phillips, M. M., Li, W., Frieman, J. A., Blinnikov, S. I., DePoy, D., Prieto, J. L., Milne, P., Contreras, C., Folatelli, G., Morrell, N., Hamuy, M., Suntzeff, N. B., Roth, M., González, S., Krzeminski, W., Filippenko, A. V., Freedman, W. L., Chornock, R., Jha, S., Madore, B. F., Persson, S. E., Burns, C. R., Wyatt, P., Murphy, D., Foley, R. J., Ganeshalingam, M., Serduke, F. J. D., Krisciunas, K., Bassett, B., Becker, A., Dilday, B., Eastman, J., Garnavich, P. M., Holtzman, J., Kessler, R., Lampeitl, H., Marriner, J., Frank, S., Marshall, J. L., Miknaitis, G., Sako, M., Schneider, D. P., van der Heyden, K., & Yasuda, N. 2007, PASP, 119, 360
- Phillips et al. (1992) Phillips, M. M., Wells, L. A., Suntzeff, N. B., Hamuy, M., Leibundgut, B., Kirshner, R. P., & Foltz, C. B. 1992, AJ, 103, 1632
- Pinto & Eastman (2000) Pinto, P. A. & Eastman, R. G. 2000, ApJ, 530, 757
- Pollas et al. (1992) Pollas, C., Filippenko, A. V., Cappellaro, E., & della Valle, M. 1992, IAU Circ., 5420, 2
- Poole et al. (2008) Poole, T. S., Breeveld, A. A., Page, M. J., Landsman, W., Holland, S. T., Roming, P., Kuin, N. P. M., Brown, P. J., Gronwall, C., Hunsberger, S., Koch, S., Mason, K. O., Schady, P., vanden Berk, D., Blustin, A. J., Boyd, P., Broos, P., Carter, M., Chester, M. M., Cucchiara, A., Hancock, B., Huckle, H., Immler, S., Ivanushkina, M., Kennedy, T., Marshall, F., Morgan, A., Pandey, S. B., de Pasquale, M., Smith, P. J., & Still, M. 2008, MNRAS, 383, 627
- Puckett et al. (2008) Puckett, T., Moore, C., Newton, J., & Orff, T. 2008, Central Bureau Electronic Telegrams, 1567, 1
- Riess et al. (1999) Riess, A. G., Filippenko, A. V., Li, W., & Schmidt, B. P. 1999, AJ, 118, 2668
- Roming et al. (2005) Roming, P. W. A., Kennedy, T. E., Mason, K. O., Nousek, J. A., Ahr, L., Bingham, R. E., Broos, P. S., Carter, M. J., Hancock, B. K., Huckle, H. E., Hunsberger, S. D., Kawakami, H., Killough, R., Koch, T. S., McLelland, M. K., Smith, K., Smith, P. J. andSoto, J. C., Boyd, P. T., Breeveld, A. A., Holland, S. T., Ivanushkina, M., Pryzby, M. S., Still, M. D., & Stock, J. 2005, Space Science Reviews, 120, 95
- Sahu et al. (2008) Sahu, D. K., Tanaka, M., Anupama, G. C., Kawabata, K. S., Maeda, K., Tominaga, N., Nomoto, K., Mazzali, P. A., & Prabhu, T. P. 2008, ApJ, 680, 580
- Schaller et al. (1992) Schaller, G., Schaerer, D., Meynet, G., & Maeder, A. 1992, A&AS, 96, 269
- Schlegel et al. (1998) Schlegel, D. J., Finkbeiner, D. P., & Davis, M. 1998, ApJ, 500, 525
- Schmidt et al. (1989) Schmidt, G. D., Weymann, R. J., & Foltz, C. B. 1989, PASP, 101, 713
- Smith et al. (2008) Smith, N., Ganeshalingam, M., Li, W., Chornock, R., Steele, T. N., Silverman, J. M., Filippenko, A. V., & Mobberley, M. P. 2008, ArXiv e-prints, 0811.3929
- Stanishev et al. (2007) Stanishev, V., Taubenberger, S., Blanc, G., Anupama, G. C., Benetti, S., Cappellaro, E., Elias-Rosa, N., Féron, C., Goobar, A., Krisciunas, K., Pastorello, A., Sahu, D. K., Salvo, M. E., Schmidt, B. P., Sollerman, J., Thöne, C. C., Turatto, M., & Hillebrandt, W. 2007, in American Institute of Physics Conference Series, Vol. 924, The Multicolored Landscape of Compact Objects and Their Explosive Origins, ed. T. di Salvo, G. L. Israel, L. Piersant, L. Burderi, G. Matt, A. Tornambe, & M. T. Menna, 336–341
- Stritzinger (2009) Stritzinger, M. 2009, Central Bureau Electronic Telegrams, 1665, 1
- Stritzinger et al. (2008) Stritzinger, M., Folatelli, G., Pignata, G., Forster, F., & Hamuy, M. 2008, Central Bureau Electronic Telegrams, 1540, 1
- Takamiya et al. (1995) Takamiya, M., Kron, R. G., & Kron, G. E. 1995, AJ, 110, 1083
- Taubenberger et al. (2006) Taubenberger, S., Pastorello, A., Mazzali, P. A., Valenti, S., Pignata, G., Sauer, D. N., Arbey, A., Bärnbantner, O., Benetti, S., Della Valle, A., Deng, J., Elias-Rosa, N., Filippenko, A. V., Foley, R. J., Goobar, A., Kotak, R., Li, W., Meikle, P., Mendez, J., Patat, F., Pian, E., Ries, C., Ruiz-Lapuente, P., Salvo, M., Stanishev, V., Turatto, M., & Hillebrandt, W. 2006, MNRAS, 371, 1459
- Valenti et al. (2009) Valenti, S., Pastorello, A., Cappellaro, E., Benetti, S., Mazzali, P., Manteca, J., Taubenberger, S., Elias-Rosa, N., Ferrando, R., Harutyunyan, A., Hentunen, V.-P., Nissinen, M., Pian, E., Turatto, M., Zampieri, L., & Smartt, S. J. 2009, ArXiv e-prints, 0901.2074
- Van Dyk et al. (2003) Van Dyk, S. D., Li, W., & Filippenko, A. V. 2003, PASP, 115, 1289
- Wade & Horne (1988) Wade, R. A. & Horne, K. 1988, ApJ, 324, 411
- Wang et al. (2008) Wang, X., Li, W., Filippenko, A. V., Foley, R. J., Kirshner, R. P., Modjaz, M., Bloom, J., Brown, P. J., Carter, D., Friedman, A. S., Gal-Yam, A., Ganeshalingam, M., Hicken, M., Krisciunas, K., Milne, P., Suntzeff, N. B., Wood-Vasey, W. M., Cenko, S. B., Challis, P., Fox, D. B., Kirkman, D., Li, J. Z., Li, T. P., Malkan, M. A., Reitzel, D. B., Rich, R. M., Serduke, F., Shang, R. C., Silverman, J. M., Steele, T. N., Swift, B. J., Tao, C., Wong, D. S., & Zhang, S. N. 2008, ArXiv e-prints, 0811.1205
- Wegner et al. (1993) Wegner, G., Haynes, M. P., & Giovanelli, R. 1993, AJ, 105, 1251
- Wells et al. (1994) Wells, L. A., Phillips, M. M., Suntzeff, B., Heathcote, S. R., Hamuy, M., Navarrete, M., Fernandez, M., Weller, W. G., Schommer, R. A., Kirshner, R. P., Leibundgut, B., Willner, S. P., Peletier, S. P., Schlegel, E. M., Wheeler, J. C., Harkness, R. P., Bell, D. J., Matthews, J. M., Filippenko, A. V., Shields, J. C., Richmond, M. W., Jewitt, D., Luu, J., Tran, H. D., Appleton, P. N., Robson, E. I., Tyson, J. A., Guhathakurta, P., Eder, J. A., Bond, H. E., Potter, M., Veilleux, S., Porter, A. C., Humphreys, R. M., Janes, K. A., Williams, T. B., Costa, E., Ruiz, M. T., Lee, J. T., Lutz, J. H., Rich, R. M., Winkler, P. F., & Tyson, N. D. 1994, AJ, 108, 2233
- Whitney et al. (2008) Whitney, B. A., Sewilo, M., Indebetouw, R., Robitaille, T. P., Meixner, M., Gordon, K., Meade, M. R., Babler, B. L., Harris, J., Hora, J. L., Bracker, S., Povich, M. S., Churchwell, E. B., Engelbracht, C. W., For, B.-Q., Block, M., Misselt, K., Vijh, U., Leitherer, C., Kawamura, A., Blum, R. D., Cohen, M., Fukui, Y., Mizuno, A., Mizuno, N., Srinivasan, S., Tielens, A. G. G. M., Volk, K., Bernard, J.-P., Boulanger, F., Frogel, J. A., Gallagher, J., Gorjian, V., Kelly, D., Latter, W. B., Madden, S., Kemper, F., Mould, J. R., Nota, A., Oey, M. S., Olsen, K. A., Onishi, T., Paladini, R., Panagia, N., Perez-Gonzalez, P., Reach, W., Shibai, H., Sato, S., Smith, L. J., Staveley-Smith, L., Ueta, T., Van Dyk, S., Werner, M., Wolff, M., & Zaritsky, D. 2008, AJ, 136, 18
- Wood-Vasey et al. (2008) Wood-Vasey, W. M., Friedman, A. S., Bloom, J. S., Hicken, M., Modjaz, M., Kirshner, R. P., Starr, D. L., Blake, C. H., Falco, E. E., Szentgyorgyi, A. H., Challis, P., Blondin, S., Mandel, K. S., & Rest, A. 2008, ApJ, 689, 377