UNDERSTANDING THE AGN-HOST CONNECTION IN BROAD Mg II EMISSION SELECTED AGN-HOST HYBRID QAUSARS
Abstract
We study the issue of AGN-host connection in intermediate-z () galaxies with hybrid spectra (hybrid QSOs for short). The observed spectra redward of the Balmer limit are dominated by starlight, and the spectra at blue end by both an AGN continuum and a Mg II broad emission line. Such unique property allows us to examine both AGN and its host galaxy in individual galaxy simultaneously. At first, 15 hybrid QSOs are selected from the Sloan Digital Sky Survey Data Release 6. The spectra are then analyzed in detail in three objects: SDSS J162446.49+461946.7, SDSS J102633.32+103443.8 and SDSS J090036.44+381353.0. Our spectral analyzing shows that the current star formation activities are strongly suppressed, and that the latest burst ages range from 400Myr to 1Gyr. Basing upon the Mg II-based black hole masses, the three hybrid QSOs are consistent with the sequence that was previously established in local AGNs. The three hybrid QSOs are located in the middle range of the sequence, which implies that the hybrid QSOs are at the transition stage not only from young to old AGN, but also from host-dominated phase to AGN-dominated phase.
1 INTRODUCTION
Despite the fact that there are still a great deal of unresolved problems, recent numerous observational and theoretical studies showed that Active Galactic Nucleus (AGN) plays an important role in galaxy evolution. The mass of central supermassive black hole (SMBH) is believed to growth simultaneously with the formation of the bulge of the host where the SMBH resides in as clued by the well-established relation (e.g., Magorrian et al. 1998; Gebhardt et al. 2000; Tremaine et al. 2002; Ferrarese & Merritt 2000; Ferrarese et al. 2006; Greene & Ho 2006; Ho et al. 2008a,b). Another clue of the coevolution of SMBH and starburst is the fact that both quasar activity density and star formation rate (SFR) density apparently peak at (e.g., Nandra et al. 2005). By adopting a variety of mechanisms of feedback from black hole growth on star formation occurring in the bulge, a series of models were developed to explain the co-evolution of AGN and its host galaxy (e.g., Fabian 1999; Begelman & Nath 2005; Granato et al. 2004; Springel et al. 2005a,b; Hopkins et al. 2006 and references therein).
Understanding how AGN co-evolves with star formation in detail is, however, seriously impeded by the trouble caused by the orientation effect (see review in Antonucci 1993; Elitzur 2007). Briefly, the starlight component is usually masked by the strong continuum and broad emission lines emitted from the central engine in the spectra of type I AGNs. On the contrary, the starlight component can be much more easily detected in type II AGNs, however the AGN continuum and broad lines are blocked by the torus. So far, a variety of approaches have been adopted to overcome the problem by different authors. We refer the readers to Wang & Wei (2008, and references therein) for a recent comment on these approaches. In Wang & Wei (2008) and Xiao et al. (in preparation), these authors examined the co-evolution of AGN and star formation by using the local partially obscured AGNs (i.e., Seyfert 1.8/1.9 galaxies) selected from the MPA/JHU SDSS DR4 catalog (e.g., Kauffmann et al. 2003a,b,c). The spectra of these galaxies show good balance between the AGN and starlight components, which allows the authors to directly determine the properties of both AGN and stellar population simultaneously in individual object. They then proposed an evolutionary scenario that the Eddington ratio decreases as the circumnuclear stellar population ages (see also in Heckman et al. 2004; Kewley et al. 2006, Wild et al. 2007).
We attempt to extend these studies to objects within in this paper. Since the emission of evolved stars drops significantly at short wavelength region, the broad Mg II2800 emission line could be used to directly estimate the properties of central SMBH when broad H emission is weak or strongly contaminated by the star light and when H emission is shifted out of the optical region. Here, we focus on the quasars with hybrid spectral properties (hereafter “hybrid QSOs” for short): a) the spectrum redward of the Balmer limit is dominated by a starlight component; b) at the same time, the spectrum at blue end shows an evident broad Mg II2800 emission line that is emitted from the central AGN. To our knowledge at present, similar object is only studied in detail (for stellar population only) in the particular post-starburst QSO, UN J1025-0040, by Brotherton et al. (1999). Another striking case with similar spectrum is reported in SDSS J231055-090107 (Canalizo et al. 2006).
In this paper, we first select a sample of 15 hybrid QSOs from the SDSS. The detailed spectral analysis is then performed in three objects: SDSS J163446.49+461946.7 (at , abbreviated here as SDSS J1634+4619), SDSS J102633.32+103443.8 (at , abbreviated here as SDSS J1026+1034) and SDSS 090036.44+381353.0 (at , abbreviated here as SDSS 0900+3813). The spectra of the three objects have high adequate average signal-to-noise (S/N) ratios of whole spectra (see Table 1), appropriate Mg II emission profiles and stellar absorption features (especially the 4000Å break features). The sample selection and spectral analysis are described in §2 and §3, respectively. §4 presents the results and discussions. The CDM cosmology with parameters , and (Spergel et al. 2003) is adopted throughout the paper.
2 SAMPLE SELECTION
SDSS is an ambitious project designed to eventually survey one-quarter of the entire sky in images and spectra (York et al. 2000). The survey is carried out by a dedicated wide-field (3˚) 2.5m telescope located at Apache Point Observatory. The telescope is equipped with two fiber-fed spectrographs and a mosaic CCD camera. Each spectrum is taken with a 3˝ diameter fiber aperture. The spectra have a resolution (corresponds to ), and cover a wavelength range from 3800 to 9200Å in the observer’s frame. The spectra are spectrophotometrically calibrated within an accuracy of 20% by observing subdwarf F stars in each 3˚ field of view. The raw spectra are reduced automatically by the developed pipelines, spectro2d and specBS (Glazebrook et al. 1998; Bromley et al. 1998).
At first, according to the redshifts determined by the SDSS pipelines, we select the galaxies and quasars within from the SDSS Data Release 6 catalogs (Adelman-McCarthy et al. 2008). The redshift range ensures that both Mg II2800 emission line and 4000Å feature (at the rest frame) shift into the wavelength coverage at observer’s frame. The Mg II2800 line emission is then required to be detected above 3 significance level according to the emission-line measurements provided by the SDSS pipelines. The selected sample contains 1,946 galaxies and 7,694 quasars fulfilling the above criteria. An automatic routine is developed to select the hybrid quasars whose spectra have an evident break around the rest-frame wavelength 4000Å, i.e., , where (Bruzual 1983; Balogh et al. 1999). The selected spectra of quasars and galaxies are then inspected by eyes one by one. Finally, the selection results in a sample of totally 15 candidates of hybrid QSOs. We emphasize that the selection outlined above provides a representative sample of hybrid QSOs (though not necessarily complete). Given the criterion, our selection would miss the QSOs whose spectra are extremely blue or dominated by extremely hot stars. In the first case, the blue AGN continuum dilutes the 4000Å drop that is caused by the stellar absorptions. The starlight component is therefore hard to be identified and separated from the observed spectra (the same for the second case). The sample is listed in Table 1. For each object, the table shows its plate number, modified Julian date of the observation, number of fiber on the plate, redshift, equivalent width of the Mg II emission line, corresponding S/N ratio of Mg II, and average S/N ratio of the whole spectrum. The observed spectra are displayed in Figure 1.
Except the three objects SDSS J1634+4619, SDSS J1026+1034 and SDSS 0900+3813, detailed spectral analysis is a hard task for most of the candidates listed in the sample at the current stage, either because of the low average S/N ratios of the whole spectra or because of the poor Mg II profiles and blurry 4000Å break features. In order to determine their physical properties, deeper spectroscopic observations are necessary for the remaining objects. At first glance each of the three spectra is dominated by both an underlying powerlaw continuum and a broad Mg II emission line attributed to AGN at the blue part, and by a spectrum of an intermediate-massive star (i.e., A to G type) at the red part. The evident starlight component allows us to separate the contribution of the host galaxy from each observed spectrum. Additionally, the properties of the black hole accretion could be derived from the evident Mg II broad emission line.
3 SPECTRAL ANALYSIS
The observed spectra are at first smoothed with a boxcar of 6 pixels (10Å) to enhance the S/N ratios and the accuracy of spectral measurements. The smoothed spectra are then reduced through the standard procedures by IRAF package111IRAF is distributed by the National Optical Astronomical Observatories, which is operated by the Association of Universities for Research in Astronomy, Inc., under cooperative agreement with the National Science Foundation., including Galactic extinction and redshift corrections. The Galactic extinction is corrected for each spectrum by the color excess adopted from NED222The Schlegel, Finkeiner, and Davis Galactic reddening maps (Schlegel et al. 1998) are adopted for NED. assuming an extinction curve with (Cardilli et al. 1989). Each Galactic extinction-corrected spectrum is then transformed to the rest frame according to the redshift given by the SDSS pipelines. The reduced spectra at the rest frame are displayed in Figure 2 (see the solid curve in each panel). Each spectrum clearly shows not only a discontinuity at around 4000Å caused by the metal absorptions of stars, but also a strong Mg II broad emission line superposed on an underlying AGN continuum at blue end. Evident H and Ca II H,K absorption features can be identified in the spectra of both SDSS J1634+4619 and SDSS J1026+1034. Although the spectrum of SDSS 0900+3813 shows relatively weak H absorption, the Ca II H,K absorptions are still strong. The presence of nuclear accretion activity in the three objects is additionally supported by the marginally detectable high ionization lines, such as [Ne III]3868, [Ne V]3426, 3346.
The single stellar population (SSP) models developed by Bruzual & Charlot (2003, BC03) are used to interpret the observed starlight spectra for the three hybrid QSOs. At the beginning, we extract a series of spectra from the BC03 SSP models with the Chabrier IMF at different metallicities. For a given metallicity, we attempt to reproduce each observed starlight component by the linear combination of five instantaneous bursts at different ages. The ages range from 0.4 to 4.0Gyr (i.e., 0.4, 0.6, 0.8, 1.0, 4.0Gyr). Since a starlight spectrum is predicted to evolve slightly after 1.0 Gyr, the 4.0Gyr old stellar population is used to reproduce the underlying old stellar population. The bursts younger than 0.4Gyr are not considered in our spectral modeling both because of the evident H and Ca II absorptions and because of the likely degeneracy between the spectrum of very young stellar population and AGN blue continuum.
In summary, in order to model the observed spectra, our template contains the starlight spectra of the five instantaneous bursts at the given stellar population ages, a powerlaw continuum and an UV Fe II template that are both attributed to AGNs, and a Galactic extinction curve (Cardelli et al. 1989). Bruhweiler & Verner (2008) recently calculated a grid of Fe II emission spectra. The predicted spectrum giving the best fit to the observed I ZW 1 spectrum is adopted in the current study. The adopted Fe II template is calculated for , , , and 830 energy levels. The template is broadened by convolution with a Gaussian profile having the same width as the Mg II broad emission before our spectral modeling.
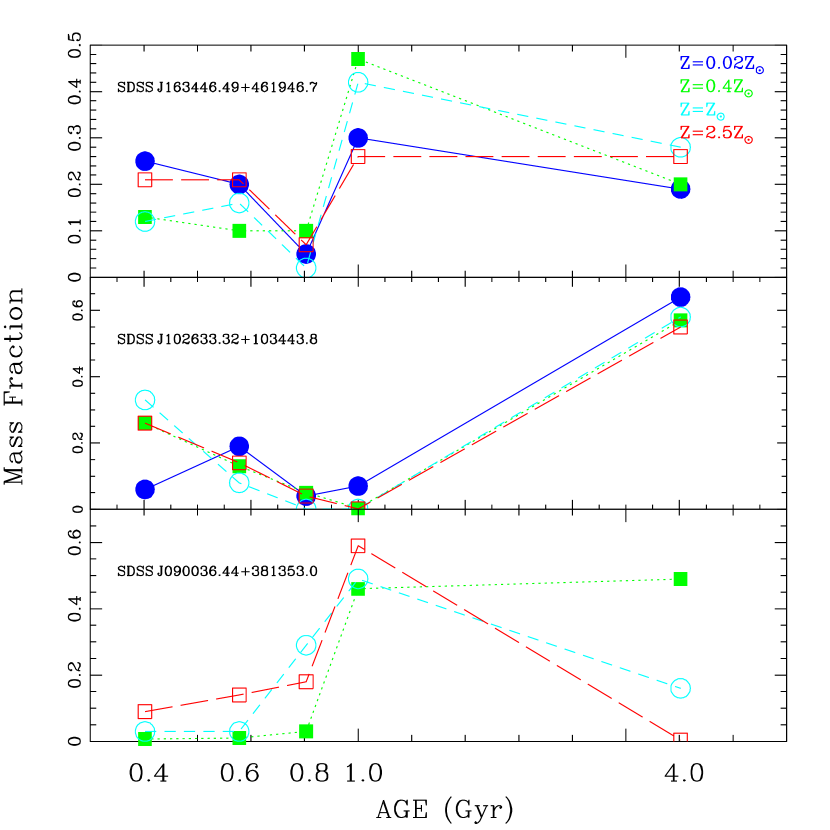
A minimization is performed over the rest wavelength range from 2900Å to 5500Å, except the range around the strong emission lines (e.g., Mg II, H, [O III]5007 and [O II]3727). For each object, the fitting is carried out for the several different metallicities (from 0.02 to 2.5) to test if the results are robust in light of changing the metallicity. The fitting at extremely low metallicity (i.e., 0.02) is excluded in the subsequent studies for SDSS 0900+3813 because a relatively high metallicity is required to reproduce the observed metal absorption lines. The fittings at the solar metallicity (the base models, see below) are illustrated in Figure 2. Figure 3 illustrates the fraction of mass associated to each of the five instantaneous bursts used in our fitting. As shown in the figure, the modeling results at the different metallicities are highly consistent with each other. For SDSS J1634+4619 and SDSS J1026+1034, their spectra can be interpreted by the combination of an old stellar population (Gyr) and a younger one (a few of 100Myr). Although there are uncertainties in the precise age estimates due to both metallicity effect and used models, a Myr and a Myr old young stellar populations are specifically required in SDSS J1026+1034 and SDSS J1634+4619, respectively. In contrast, SDSS 0900+3813 is dominated by a relatively old stellar population (Gyr), which is in agreement with its relatively weak H absorption feature that is already mentioned above. Since the spectral modeling results change little when the different metallicities are considered, the models with the solar metallicity are then used as the base models in our subsequent studies.
4 RESULTS AND DISCUSSION
Table 2 lists the results of the spectral measurements that are performed in the rest frame. The residual emission-line spectra are used to measure emission line features, and the modeled starlight spectra to measure the Lick indices. For each object, lines (1) and (2) lists the redshift and modeled intrinsic extinction, respectively. Lines (2) to (5) list the AGN continuum flux at the rest-frame wavelength 3000Å, the [O III] and [O II] emission line fluxes, and the FWHM of the Mg II broad emission line. All the fluxes quoted above are corrected for the modeled intrinsic extinction. The fluxes of [O III] and [O II] emission line are measured by direct integration333 The reported statistic errors are derived by the method given in Perez-Montero & Diaz (2003). That is , where is the error of line flux, the standard deviation of continuum in a box near the line, the number of pixel used to measure the line flux, equivalent width of the line, the wavelength dispersion in units of .. The FWHM of the Mg II emission is determined by a Gaussian fit through the SPLOT task. The measured two Lick indices, and H444 The index H measures the EW of absorption in A type stars, and is defined as by Worthey & Ottaviani (1997) as where is the flux within the feature bandpass, and the flux of the pseudo-continuum within two defined bandpasses: blue and red ., are listed in lines (11) and (12). The measured value of the Lick indices are in agreement with our spectral modelings described above.
4.1 Eddington Ratio vs. Sequence
The main goal of this paper is to study the coevolution of AGN and its host galaxy by taking advantage of the spectra of the hybrid QSOs. On account of the great progress in the reverberation mapping technique, a variety of empirical relationships are calibrated and used to estimate the black hole viral masses () in AGNs (e.g., Kaspi et al. 2000, 2005; Peterson et al. 2004). The commonly used calibrations are recently summarized in McGill et al. (2008). The prominent broad Mg II emission lines allow us to roughly estimate the and Eddington ratios () for the three hybrid QSOs. Mg II emission is an important coolant in high density BLR clouds in AGNs. Comparing with H, the Mg II emission is, in principle, less contaminated by star light. In addition, the equivalent width of Mg II peaks at lower ionizing flux, which means Mg II is emitted from the region that has a larger distance from an isotropic ionizing source (e.g., Korista et al. 1997).
We estimate the Mg II-based according to the calibration
| (1) |
given in Kollmeier et al. (2006), where is the AGN continuum luminosity at the rest-frame wavelength 3000Å. The is corrected for the intrinsic extinction according to the modeled color excess. The UV continuum-based calibration is adopted here because the total light spectra redward of the Balmer limit are dominated by the contribution from the starlight components. The bolometric luminosities are then obtained from the estimated by multiplying a factor of 5.9 (McLure & Dunlop 2004). The estimated and are listed in Table 2 for each object.
The bolometric luminosities estimated from the modeled UV continuum are compared with that from the [O III] emission lines. As a reasonable first approximation, [O III] emission is believed to be isotropic in AGNs (Kuraszkiewicz et al. 2000). The isotropy of the [O III] emission has been questioned by some studies of radio-loud AGNs (e.g., Baker & Hunstead 1995; Jackson & Rawlings 1997). Despite the large scatter, the [O III] luminosity () was reported to be correlated with the optical continuum luminosity for typical type I AGNs (e.g., Kauffmann et al. 2003a). Given the relationship , the ratio is estimated to be 0.8 for SDSS J1634+4619, 0.5 for SDSS 1026+1034, and 1.2 for SDSS 0900+3813, which means a high consistence between the two independent estimations.
As an additional test, the host stellar masses () are estimated from the modeling of the observed spectra, and listed in Table 2 as well. Similar as the results recently obtained in Alonso-Herrero et al. (2008), the of the three hybrid QSOs are close to that of AGNs (, e.g., Daddi et al. 2007; Kreik et al. 2007), and higher than those of local AGNs (, e.g., Kauffmann et al. 2003). The average ratio is for the three hybrid QSOs, which is highly consistent with the tight linear correlation between and the virial bulge mass. The tight correlation established in the local Universe has an average ratio (Marconi & Hunt 2003).
The role of in AGN evolution has been proposed for a long time (e.g., Grupe 2004; Mathur 2000). Wang & Wei (2008) established a smooth sequence by studying the nearby Seyfert 1.8/1.9 galaxies selected from the MPA/JHU SDSS DR4 catalog. The sequence indicates an evolutionary scenario that young AGN with high evolves to old AGN with low along the sequence as the associated stellar population ages. Similar evolutionary sequences has been proposed by different authors through different methods and technologies (e.g., Wang et al. 2006; Kewley et al. 2006; Wild et al. 2007). As one generally believes that star formation activity decreases as stellar population ages, the sequence is consistent with Watabe et al. (2008) who recently found a close correlation between and nuclear starburst luminosity assessed by the near infrared PAH emission. Similar as done in our previous studies, is plotted against by solid stars in Figure 4 for the three hybrid QSOs. The open circles show the sequence that is established in Wang & Wei (2008). The hybrid QSOs studied in this paper are clearly consistent with the sequence reported in the local Seyfert galaxies, which implies that the evolution sequence could continue out to .
Note that the three hybrid QSOs are located in the middle range of the evolutionary sequence, which implies that they are at the transition stage not only from young to old AGNs, but also from host-dominated to AGN-dominated phase. We propose that the hybrid QSOs are the progenitors of local optical luminous QSOs. The three hybrid QSOs show recent starbursts within 1Gyr (recall that QSO UN J1025-0040 is associated with a 400Myr old post-starburst, Brotherton et al. 1999). On the contrary, relatively old (or old post-starburst) stellar populations are frequently identified in nearby luminous QSOs. Nolan et al. (2001) found that the off-nuclear (5˝) stellar population is dominated by old stars (8-14Gyr) for optically selected QSOs. Dunlop et al. (2003) observed a sample of local QSOs at in imaging and spectroscopy. They claimed that the host galaxies of these luminous QSOs are dominated by old stellar populations without recent massive star formation. Canalizo et al. (2006) re-observed the 14 QSOs listed in the sample of Dunlop et al. (2003) by Keck LRIS spectrograph. The spectra with high S/N ratios allow the authors to identify relatively old post-starbursts (0.6-2.2Gyr) in the host galaxies. These timescales are comparable to the recent starburst ages recently inferred from the HST ACS deep imaging study of host galaxies of five low-redshift QSOs (Bennert et al. 2008). In addition, Tadhunter et al. (2005) detected relatively old post-starbursts (0.1-2Gyr) in the off-nuclear regions of a few nearby radio-loud AGNs.
Recent theoretical studies on the issue of co-evolution of AGN and its host galaxy suggest that AGNs are hard to be detected in the early host-dominated phase. Numerical simulations of galaxies merger including SMBHs predict the theoretical light curves of the central AGN activity and associated star formation activity (e.g., Di Matteo et al. 2005; Springel et al. 2005). At the beginning of evolution, the central AGN activity is predicted to be heavily obscured by the surrounding gas and dust, especially in UV/optical bands. After the obscuration material is dispersed by the feedback from the accretion activity and emission from young, hot stars fades out (i.e., at about 1Gyr after the beginning), luminous QSOs are observable because the star light from host is overwhelmed by the strong radiation from the luminous QSOs (Hopkins et al. 2005a,b). An alternative possibility is the differential growth of the black hole mass and bulge mass (e.g., Weedman 1983). This scenario is observationally supported by the detection of post-starburst stellar populations in Narrow-line Seyfert 1 galaxies with high (e.g., Wang & Wei 2006; Zhou et al. 2005). By observing local Seyfert galaxies with high spatial resolution down to 0.085˝, Davies et al. (2007) recently suggested that the black hole accretion delays for 50-100 Myr since the onset of star formation. The theoretical models developed by Kawakatu et al. (2003) and Granato et al. (2004) predict that the change in phase from starburst-dominated to AGN-dominated takes place at a few yr since the beginning of the star formation. Of course, we could not entirely exclude the possibility that the lack of extremely young stellar population in our three hybrid QSOs is caused by the used criterion (i.e., ).
Our studies show that the hybrid QSOs could be an ideal laboratory for studying the co-evolution of AGN and its host galaxy because of their unique spectral properties. Additional deep spectroscopic observations are required to search for more hybrid QSOs, and to test the validity of the sequence, especially in distant Universe. Moreover, observations in infrared are helpful to constrain the dust content in these objects.
4.2 Star Formation History/Rate
There is accumulating evidence supporting that argument that star formation activity is suppressed in luminous AGNs (e.g., Ho 2005; Wang & Wei 2008; Kim et al. 2006; Martin et al. 2007; Bundy et al. 2008; Schawinski et al. 2007; Zheng et al. 2007). We argue that the current SFRs are significantly suppressed in the three hybrid QSOs. At first, the inserted panel in Figure 4 shows the vs. H diagram for the three hybrid QSOs. The dot-dashed line shows the stellar population evolution locus for the model with exponentially decreasing SFR at solar metallicity (), and the dashed line the SSP model (BC03). The SSP model for a recent burst that ended 0.1-1 Gyr ago shows enhanced H value because the optical spectrum is dominated by the emission of A-type stars. All three hybrid QSOs fall close to the single burst model due to their large H values. Secondly, [O II]3727 line emission is a good indicator of current SFR for starforming galaxies (e.g., Kennicutt 1998; Kewley et al. 2004). The spectra of both SDSS J1634+4619 and SDSS J0900+3813 show marginally detectable [O II]3727 emission features, which indicates that the current SFRs could be ignored in these two hybrid QSOs. [O II]3727 emission is strong in SDSS J1026+1034. However, both AGN and H II region can contribute to [O II] emission (e.g., Yan et al. 2006; Kim et al. 2006). The measured line ratio [O II]/[O III] is 0.54 (after the correction of the intrinsic extinction), and line ratio [O III]/H. SDSS J1026+1034 is therefore located in the region occupied by typical AGNs in the [O II]/[O III] vs. [O III]/H diagram (see Figure 7 in Kim et al. 2006). Moreover, the intrinsic [O III] luminosity is estimated to be . At the given luminosity, the anticorrelation for typical AGNs between and [O II]/[O III] predicts the line ratio [O II]/[O III] varies from 0.03 to 0.32 (see Figure 5 in Kim et al. 2006), which means no more than 20% of the total [O II] emission is contributed from the star formation activity. We consequently conclude that the narrow emission lines in SDSS J1026+1034 are mainly contributed from the central AGN.
4.3 Radio Emission In SDSS J1634+4619
The radio emission of SDSS J1634+4619 is detected by the NRAO VLA Sky Survey (NVSS; Condon et al. 1998) and Faint Images of the Radio Sky Survey at Twenty cm (FIRST) survey (Becker et al. 1995) at 1.4GHz. The map of the FIRST survey shows an unresolved source with integrated flux mJy including a correction of 0.25mJy caused by Clean-Bias. The position of the radio source deviates from the corresponding optical source by 0.˝36. The radio luminosity is calculated to be through a -correction by assuming a spectral shape from optical to radio band.
It is well known that the decimeter radio emission could be contributed from the supernova explosion of massive stars (i.e., ) with a life time yr. In fact, the most radio-luminous starburst has a radio luminosity (Smith et al. 1998). The radio luminosity contributed from the recent starburst could be estimated from the past average SFR as (Condon 1992). Recall that the observed spectrum has been modeled in terms of the linear combination of the five instantaneous bursts, we define the average SFR for each burst as , where is the star mass formed in each burst, and the step of time adopted in the spectral modeling. The average SFR of the latest burst is therefore estimated to be for SDSS J1634+4619. Given the Salpeter IMF (Salpeter 1955), the starburst-contributed radio luminosity is , which is one order of magnitude lower than the calculated total radio luminosity.
4.4 A Companion Galaxy Of SDSS J1634+4619?
It is widely accepted that galaxies interaction can trigger extreme nuclear accretion and star formation activity (e.g., Toomre & Toomre 1972; Larson & Tinsely 1978; Sanders et al. 1988; Stockton 1999; Heckman et al. 1984; Di Matteo et al. 2005; Springel et al. 2005a, b). Recent HST ACS deep imaging study identified significant fine structures such as shells and tidal tails in a small sample of host galaxies of low redshift QSOs (Bennert et al. 2008). A companion galaxy at post-starburst phase (Myr) is identified in the particular case UN J1025-0040 (Brotherton et al. 1999; Canalizo et al. 2000). The HST image shows an interacting companion for the “Q+A” object SDSS J231055-090107 (Canalizo et al. 2006).
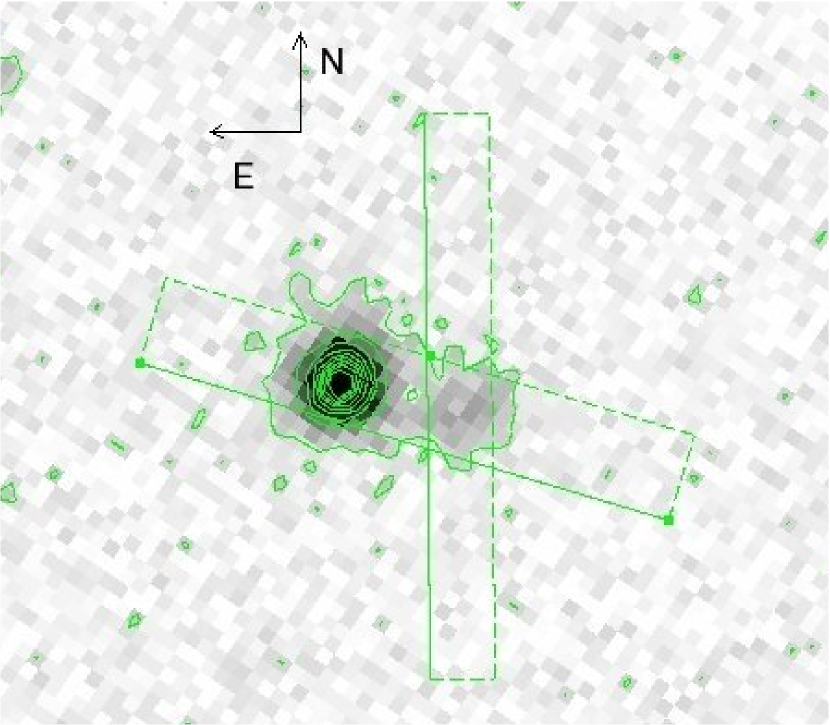
The optical images of SDSS J1634+4619 taken by SDSS show an unresolved source neighbored by a marginally detectable, very faint source to southwest in appearance. Figure 5 shows the -band image. The intensity contours are over-plotted on the image after the background level determined around the source is subtracted. To identify the faint companion more clearly, we project the image along the long sides of the two rectangles overlaid in Figure 5. Figure 6 presents the count distributions along the two directions. As shown by the left panel in Figure 6, the peaks of SDSS J1634+4619 and the possible companion are separated by about 8 pixels. This separation corresponds to a projected physical distance 11 kpc if the companion is at z=0.576. Finally, more deep spectroscopic observations and imagings are necessary to determine whether the companion interacts with SDSS J1634+4619 physically or is just a foreground star/galaxy.
5 SUMMARY
We select 15 intermediate-z galaxies with hybrid spectra from SDSS DR6 to study the issue of AGN-host connection. The spectra redward of the Balmer limit are dominated by starlight, and the spectra at blue end by both an AGN continuum and a Mg II broad emission line. The spectra are analyzed in detail in three objects: SDSS J162446.49+461946.7, SDSS J102633.32+103443.8 and SDSS J090036.44+381353.0. Without intensive current star formation activities, the modeled recent burst ages range from 400Myr to 1Gyr. Based on the Mg II-based black hole masses, the three hybrid QSOs are consistent with the sequence previously established in local AGNs.
References
- Adelman-McCarthy et al. (2008) Adelman-McCarthy, J. K., et al. 2008, ApJS, 175, 297
- Alonso-Herrero et al. (2008) Alonso-Herrero, A., Perez-Gonzelez, P. G., Rieke, G. H., et al. 2008, ApJ, 677, 127
- Antonucci (1993) Antonucci, R. R. J. 1993, ARA&A, 31, 473
- Baker & Hunstead (1995) Baker, J. C., & Hunstead, R. W. 1995, ApJ, 452, 95
- Balogh et al. (1999) Balogh, M. L., et al. 1999, ApJ, 527, 54
- Becker et al. (1995) Becker, R. H., White, R. L., & Helfand, D. J. 1995, ApJ, 450, 559
- Bennert et al. (2008) Bennert, N., Canalizo, G., Jungwiert, B., et al. 2008, ApJ, 677, 846
- Begelman & Nath (2005) Begelman, M. C., & Nath, B. B. 2005, MNRAS, 361, 1387
- Bruhweiler & Verner (2008) Bruhweiler, F., & Verner, E. 2008, 675, 83
- Bromley et al. (1998) Bromley, B. C., et al. 1998, ApJ, 505, 2
- Brotherton et al. (1999) Brotherton, M. S., van Breugel, Wil., Stanford, S. A., et al. 1999, ApJ, 520, 87
- Bruzual (1983) Bruzual, A. G. 1983, ApJ, 273, 105
- Bruzual & Charlot (2003) Bruzual. G., & Charlot. S. 2003, MNRAS, 344, 1000
- Bundy et al. (2005) Bundy, K., Ellis, R. S., & Conselice, C. J. 2005, ApJ, 625, 621
- Canalizo et al. (2000) Canalizo, G., Stockton, A., Brotherton, M. S., et al. 2000, AJ, 119, 59
- Canalizo et al. (2006) Canalizo, G., Stockton, A., Brotherton, M. S., et al. 2006, NewA, 2006, 50, 650
- Cardilli et al. (1989) Cardilli, J. A., Clayton, G. C., & Mathis, J. S. 1989, ApJ, 345, 245
- Condon (1992) Condon, J. J. 1992, ARA&A, 30, 575
- Condon et al. (1998) Condon, J. J., Cotton, W. D., Greisen, E. W., et al. 1998, AJ, 115, 1639
- Daddi et al. (2007) Daddi, E., et al. 2007, ApJ, 670, 173
- Davies et al. (2007) Davies, R. I., Mueller Sanchez, F., Genzel, R., et al. 2007, ApJ, 671, 1388
- Di Matteo et al. (2005) Di Matteo, T., Springel, V., & Hernquist, L. 2005, Nature, 433, 604
- Dunlop et al. (2003) Dunlop, J. S., McLure, R. J., Kukula,M. J., et al. 2003, MNRAS, 340, 1095
- Elitzur (2007) Elitzur, M. 2007, ASPC, 373, 415
- Fabian (1999) Fabian, A. C. 1999, MNRAS, 308, L39
- Ferrarese & Merritt (2000) Ferrarese, L., & Merritt, D. 2000, ApJ, 529, 13
- Ferrarese et al. (2006) Ferrarese, L., Cote, P., Dalla Bonta, E., et al. 2006, ApJ, 644, L21
- Gebhardt et al. (2000) Gebhardt, K., Bender, R., Bower, G., et al. 2000, ApJ, 539, 13
- Granato et al. (2004) Granato, J. E., et al. 2004, ApJ, 600, 580
- Glazebrook et al. (1998) Glazebrook, K., Offer, A., R., & Deeley, K. 1998, ApJ, 492, 98
- Greene & Ho (2006) Greene, J. E., & Ho, L. C. 2006, ApJ, 641, L21
- Heckman et al. (1984) Heckman, T. M., Bothun, G. D., Balick, B., et al. 1984, ApJ, 89, 7
- Heckman et al. (2004) Heckman, T. M., Kauffmann, G., Brinchmann, J., et al. 2004. ApJ, 613, 109
- Ho (2005) Ho, L. C. 2005, ApJ, 629, 680
- (35) Ho, L. C., Darling, J., & Greene, J. E. 2008a, ApJ, 681, 128
- (36) Ho, L. C., Darling, J., & Greene, J. E. 2008b, ApJS, 177, 103
- (37) Hopkins, P. F., Hernquist, L., Cox, T. J., et al. 2005a, ApJ, 630, 705
- (38) Hopkins, P. F., Hernquist, L., Martini, P., et al. 2005b, ApJ, 625, 71
- Hopkins et al. (2006) Hopkins, P. F., Hernquist, L., Cox, T. J., et al. 2006, ApJS, 163, 1
- Jackson & Rawlings (1997) Jackson, N., & Rawlings, S. 1997, MNRAS, 286, 241
- Kaspi et al. (2005) Kaspi, S., Maoz, D., Netzer, H., et al. 2005, ApJ, 629, 61
- Kaspi et al. (2000) Kaspi, S., Smith, P. S., Netzer, H., et al. 2000, ApJ, 533, 631
- (43) Kauffmann, G., Heckman, T. M., Tremonti, C., et al. 2003a, MNRAS, 346, 1055
- (44) Kauffmann, G., Heckman, T. M., White, S. D. M., et al. 2003b, MNRAS, 341, 54
- (45) Kauffmann, G., Heckman, T. M., White, S. D. M., et al. 2003c, MNRAS, 341, 33
- Kewley et al. (2004) Kewley, L. J., Geller, M. J., & Jansen, R. A. 2004, AJ, 127, 2002
- Kewley et al. (2006) Kewley, L. J., Groves, B., Kauffmann, G., & Heckman, T. 2006, MNRAS, 372, 961
- Kim et al. (2006) Kim, M., Ho, L. C., & Im, M. 2006, ApJ, 642, 702
- Kollmeier et al. (2006) Kollmeier, J. A., Onken, C. A., Kochanek, C. S., et al. 2006, ApJ, 648, 128
- Korista et al. (1997) Korista, K., Baldwin, J., Ferland, G., et al. 1992, ApJS, 108, 401
- Kuraszkiewicz et al. (2000) Kuraszkiewicz, J., Wilkes, B. J., Brandt, W. N., et al. 2000, ApJ, 542, 631
- Larson & Tinsley (1978) Larson, R. B., & Tinsley, B. M. 1978, ApJ, 219, 46
- Magrorrian et al. (1999) Magorrian, J., et al. 1999, AJ, 115, 2285
- Marconi & Hunt (2003) Marconi, A., & Hunt, L. K. 2003, ApJ, 589, L21
- Martin et al., (2007) Martin, D. C., et al. 2007, ApJS, 173, 342
- Mathur (2000) Mathur, S. 2000, MNRAS, 314, L17
- McGill et al. (2008) McGill, K. L., Woo, Jong-Hak., Treu, T., et al. 2008, ApJ, 673, 703
- McLure & Dunlop (2004) McLure, R. J., & Jarvis, M. J. 2004, MNRAS, 353, L45
- Nandra et al. (2005) Nandra, K., Laird, E. S., & Steidel, C. C. 2005, MNRAS, 360, L39
- Nolan et al. (2001) Nolan, L. A., Dunlop, J. S., Kukula, M. J., et al. 2001, MNRAS, 323, 308
- Perez-Montero & Diaz (2003) Perez-Montero, E., & Diaz, A. I. 2003, MNRAS, 346, 105
- Peterson et al. (2004) Peterson, B. M., et al. 2004, ApJ, 613, 682
- Salpeter (1955) Salpeter, E. E. 1955, ApJ, 121, 161
- Sanders et al. (1988) Sanders, D. B., Soifer, B. T., Elias, J. H., et al. 1988, ApJ, 325, 74
- Schawinski et al. (2007) Schawinski, K., Thomas, D., Sarzi, M., et al. 2007, MNRAS, 382, 1415
- Schlegel et al. (1998) Schlegel, D, Finkbeiner, D. P., & Davis, M. 1998, ApJ, 500, 525
- Smith et al. (1998) Smith, D. A., Herter, T., & Haynes, M. P. 1998, ApJ, 494, 150
- Spergel et al. (2003) Spergel, D. N., et al. 2003, ApJS, 148, 175
- (69) Springel, V., Di Matteo, T., & Hernquist, L. 2005a, ApJ, 620, L79
- (70) Springel, V., Di Matteo, T., & Hernquist, L. 2005a, MNRAS, 339, 289
- Stockton (1999) Stockton, A. 1999, IAUS, 186, 311
- Tadhunter et al. (2005) Tadhunter, C., Robinson, T. G., Gonzalez Delgado, R. M., et al. 2005, MNRAS, 356, 480
- Toomre & Toomre (1972) Toomre, A., & Toomre, J. 1972, ApJ, 178, 623
- Tremaine et al. (2002) Tremaine, S., Gebhardt, K., Bender, R., et al. 2002, ApJ, 574, 740
- Wang & Wei (2006) Wang, J., & Wei, J. Y. 2006, ApJ, 648, 158
- Wang & Wei (2008) Wang, J., & Wei, J. Y. 2008, ApJ, 679, 86
- Watabe et al. (2008) Watabe, Y., Kawakatu, N., & Imanishi, M. 2008, ApJ, 677, 895
- Wild et al. (2007) Wild, V., et al. 2007, MNRAS, 381, 543
- Worthey & Ottaviani (1997) Worthey, G., & Ottaviani, D. L. 1997, ApJS, 111, 377
- York et al. (2000) York, D. G., et al. 2000, AJ, 120, 1579
- Zheng et al. (2007) Zheng, X. Z., et al. 2007, ApJ, 661, L41
- Zhou et al. (2005) Zhou, H. Y., Wang, T. G., Dong, X. B., et al. 2005, Mem. Soc. Astron. Italiana, 76, 93


| Name | fiber ID | Plate ID | MJD ID | z | EW(Mg II)††The signal-to-noise ratio of Mg II emission line measured by the SDSS pipelines. | S/N Mg II††The signal-to-noise ratio of Mg II emission line measured by the SDSS pipelines. | S/N spec‡‡The average signal-to-noise ratio of whole observed spectrum |
|---|---|---|---|---|---|---|---|
| Å | |||||||
| (1) | (2) | (3) | (4) | (5) | (6) | (7) | (8) |
| SDSS J074156.79+345405.5 | 394 | 542 | 51993 | 0.448 | 18.9 | 5.0 | |
| SDSS J074524.97+375436.7 | 170 | 433 | 51873 | 0.406 | 8.7 | 5.0 | |
| SDSS J081535.89+552558.4 | 590 | 1871 | 53384 | 0.413 | 7.3 | 4.7 | |
| SDSS J082718.94+294204.3 | 600 | 1207 | 52672 | 0.408 | 9.3 | 5.5 | |
| SDSS J090036.44+381353.0**Studied in this paper. | 478 | 936 | 52705 | 0.434 | 21.2 | 5.9 | |
| SDSS J093912.82+455358.8 | 380 | 1202 | 52672 | 0.422 | 11.5 | 6.2 | |
| SDSS J101011.59+444212.0 | 193 | 943 | 52376 | 0.406 | 3.6 | 3.9 | |
| SDSS J101036.80+294520.1 | 69 | 1953 | 53358 | 0.483 | 3.5 | 5.2 | |
| SDSS J102633.32+103443.8**Studied in this paper. | 142 | 1598 | 53033 | 0.435 | 10.8 | 6.0 | |
| SDSS J115507.20+351058.7 | 375 | 2099 | 53469 | 0.421 | 17.0 | 2.1 | |
| SDSS J141324.27+530527.0 | 133 | 1325 | 52762 | 0.455 | 17.1 | 2.9 | |
| SDSS J154901.16+071247.6 | 272 | 1727 | 53859 | 0.501 | 10.8 | 4.2 | |
| SDSS J160616.23+223242.1 | 237 | 1852 | 53534 | 0.408 | 8.8 | 5.6 | |
| SDSS J163446.49+461946.7**Studied in this paper. | 163 | 627 | 52144 | 0.576 | 10.0 | 5.3 |
| Properties | SDSS J1634+4619 | SDSS J1026+1034 | SDSS 0900+3813 |
|---|---|---|---|
| (1) | (2) | (3) | (4) |
| z(1) | 0.576 | 0.435 | 0.434 |
| E(B-V)(2) | 0.11 | 0.26 | 0.22 |
| (3) | |||
| (4) | |||
| (5) | |||
| FWHM(Mg II)/(6) | |||
| (7) | |||
| (8) | 0.026 | 0.12 | 0.09 |
| (9) | |||
| S.P. Age/Gyr(10) | |||
| (11) | 1.32 | 1.27 | 1.39 |
| H(12) | 8.06 | 9.93 | 6.78 |