Heavily obscured AGN with SIMBOL-X
Abstract
By comparing an optically selected sample of narrow lines AGN with an X-ray selected sample of AGN we have recently derived an estimate of the intrinsic (i.e. before absorption) 2-10 keV luminosity function (XLF) of Compton Thick AGNs. We will use this XLF to derive the number of Compton Thick AGN that will be found in the SIMBOL-X survey(s).
Keywords:
X-ray; Active Galaxies; X-ray sources; Observational Cosmology:
95.85.Nv; 98.54.Cm; 98.70.Qy; 98.80.Es1 Introduction
The discovery of quiescent Super-Massive Black-Holes (SMBH) in the nuclei of non-active nearby galaxies with prominent bulges (Kormendy & Richstone (1995), Magorrian et al. (1998)), along with the discovery of scaling relations between the central BH mass and galaxy properties (e.g. bulge luminosity/mass and velocity dispersion, Gebhardt et al. (2000), Ferrarese & Merritt (2000)) strongly suggest a tight link between BH growth and galaxy evolution (commonly referred to as ”co-evolution”) and a physical mechanism linking accretion and ejection of material occurring in the central (sub-parsec scale) galaxy nucleus to the rest of the galaxy. This implies that AGN are not only sources where high energy physical processes take place but are leading actors in the formation and evolution of galaxies and, in general, of cosmic structures in the Universe.
However the largest fraction of the AGN population is obscured by a large amount of cold matter around the Active Nuclei that does not permit a direct view to the central energy source. For absorbed AGN having column densities () up to few times the current missions at E¡10 keV (XMM-Newton and Chandra) are producing a wealth of useful data that can be used to evaluate their physical and cosmological properties (e.g. see Della Ceca et al. (2008) and Ebrero et al. (2009) and references therein). On the contrary, the situation is almost completely unconstrained for the sources having greater than (the so called Compton Thick AGN, where the matter is optically thick to Compton scattering). According to the synthesis modeling of the cosmic X-ray background (XRB) (Treister & Urry (2005), Gilli et al. (2007)), these objects should represent 50% of the total absorbed AGN population, although recent revisions (Treister et al. (2009)) seem to suggest a smaller contribution.
In Della Ceca et al. (2008) we have reviewed the Compton Thick AGN studied so far (using the current and past X-ray missions, i.e. ASCA, BeppoSAX, XMM-Newton, Chandra, INTEGRAL, SWIFT and SUZAKU) and discussed the X-ray spectral improvements offered by the Simbol-X mission (see also the contributions of W. Beckmann, F. Panessa and F. Fiore at this meeting). We discuss here their expected cosmological properties (LogN-LogS and z distribution). (,,)=(65,0.3,0.7) are used in this paper. Finally we are considering here only Compton Thick AGN with between and cm-2.
2 The XLF of Compton-Thick AGN
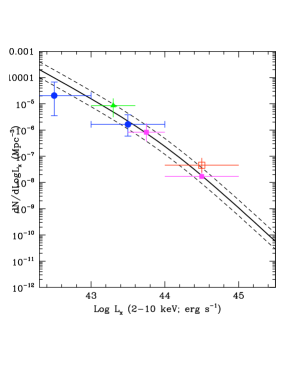
In Della Ceca et al. (2008) by comparing the results obtained using an hard (4.5-7.5 keV) X-ray selected sample of AGN with those derived by using an optically selected sample of narrow lines AGN (Simpson (2005)), we have evaluated, in an indirect way, the intrinsic (i.e. before the absorption) XLF of Compton Thick AGN (at z=0) in the 2-10 keV energy range. This XLF (thick solid line in figure 1, left panel) is described by a smoothly connected two power-law function, , with , , Log and A = . A comparison with the results from other projects is also reported in figure 1 (left panel). As can be clearly noted the different estimates of the space density of Compton Thick AGN are consistent (roughly within a factor 2, see the two dashed lines) with the proposed XLF of Compton Thick AGN, with a possible hint of a XLF flattening below few times ; we emphasize that this agreement is remarkably good if we consider that the different estimates have been derived using very different selection criteria and methods. Finally the consideration that the total number of Compton Thick AGN cannot be increased arbitrarily, without violating the limits imposed by the local black mass density derived from dynamical studies of local galaxy bulgesMarconi et al. (2004), allows us to put some constraints on the space density of optically/infrared-elusive Compton Thick AGN; this limit is violated if the total density of Compton Thick AGN (including also the optically-elusive ones) is above the upper dashed envelope reported in figure 1 (left panel, see Della Ceca et al. (2008) for details).

3 Predictions for the SIMBOL-X mission
Having derived an estimate of the intrinsic XLF of Compton Thick AGN (at z=0) we can now make predictions for the Compton Thick AGN population that will be detected above 10 kev (in particular in the 10-40 keV energy range) with SIMBOL-X.
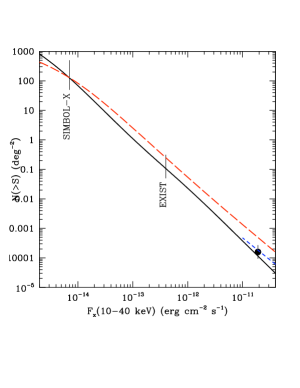
By integrating the XLF reported in figure 1 ( from to ; z from 0 to 3) using the best fit cosmological evolution parameters reported in Della Ceca et al. (2008) and convolving the results with a) the modeling of X-ray spectra transmitted through Compton-thick absorbers as discussed in Matt et al. (1999) and b) a flat distribution between and cm-2, we predict the LogN(S)-LogS reported as solid line in figure 1 (middle panel).
In this figure we also shown:
a) the surface density of Compton Thick AGN obtained from the SWIFT/BAT survey (Tueller et al. (2008)) 111The SWIFT/BAT results are fully consistent with those obtained from the INTEGRAL surveys (L.Bassani, private communication). To this purpose we have used the 5 Compton Thick AGN (as revised in Treister et al. (2009), i.e. MKN3, NGC3281, NGC4945, NGC5728 and NGC7582) having between and and (where we have a flat sky coverage and a covered area of 30526 deg-2). To convert the fluxes from the different energy bands we have used an absorbed power law spectral model having photon index and ();
b) the LogN(S)-LogS of Compton Thick AGN ( between and cm-2) as derived by Treister et al. (2009) (short-dashed line) using SWIFT/BAT and INTEGRAL data and
c) the predictions based on the XRB modeling (long-dashed line. R. Gilli, private communication).
As can be clearly seen we find a very good agreement between our predictions and the measurements performed so far with SWIFT/BAT, making us confident that our predictions for the SIMBOL-X mission are robust. We also find that the predictions based on the XRB modeling are about a factor 3 above the observed value at , probably requiring a revision on the current XRB model’s parameters (see also Treister et al. (2009)).
At the SIMBOL-X flux limit of (1 Msec exposure) we predict a Compton Thick AGN surface density of 125 deg-2, i.e. around 5 Compton Thick AGN for each SIMBOL-X deep field. Thus with about 10 deep fields we will be able to constrain the density of Compton Thick AGN with an error of about 15-20% in the redshift range between 0.8 and 1.5, where the peak of the redshift distribution is expected (see Figure 1, right panel: z distribution). For a typical SIMBOL-X exposure of 30 Ksec the flux limit (10-40 keV band) is expected to be . At this flux limit heavily obscured AGN can be assembled by looking for serendipitous sources in pointed observations; considering a total number of SIMBOL-X pointings we should collect “for free” other serendipitous Compton Thick AGN spanning a redshift range from 0.05 to 0.6.
Finally it is worth noting that in the bright flux regime (few times above ), a complementary mission to SIMBOL-X is represented by the Energetic X-ray Imaging Survey Telescope (EXIST; Grindlay (2005)) that is expected to perform an all sky survey. At the ”1 year survey flux limit” (5) of the predicted surface densities of Compton Thick AGN is deg-2 (see Figure 1, middle panel), so 3000 Compton Thick AGN should be detected at high galactic latitude (the large majority of them expected at ). In this respect SIMBOL-X and EXIST are synergic and not competing for what concerns the cosmological studies of the Compton Thick AGN population: with EXIST it will be possible to derive the census (e.g. XLF) of these objects in the local Universe while the much deeper surveys that will be carried out with SIMBOL-X will be a fundamental and unique tool to study the evolution of their XLF up to cosmological distances (). As already stressed by Treister et al. (2009) the study of these surveys at E keV is the only way to constrain, on firm and solid statistical bases, the census of heavily obscured accretion in AGN.
References
- Alexander et al. (2008) Alexander, D. M., et al. 2008, Ap.J. , 687, 835
- Daddi et al. (2007) Daddi, E., et al. 2007, Ap.J., 670, 173
- Della Ceca et al. (2008) Della Ceca, R., et al. 2008, A&A, 487, 119
- Della Ceca et al. (2008) Della Ceca, R., et al. 2008, Mem.S.A.It., 79, 65.
- Ebrero et al. (2009) Ebrero, J., et al. 2009, A&A, 493, 55
- Ferrarese & Merritt (2000) Ferrarese, L., & Merritt, D. 2000, Ap.J.l, 539, L9
- Fiore et al. (2008) Fiore, F., et al. 2008, Ap.J., 672, 94
- Gilli et al. (2007) Gilli, R., Comastri, A., & Hasinger, G. 2007, A&A, 463, 79
- Gebhardt et al. (2000) Gebhardt, K., et al. 2000, Ap.J. Letters, 539, L13
- Grindlay (2005) Grindlay, J. E. 2005, New Astronomy Review, 49, 436
- Kormendy & Richstone (1995) Kormendy, J., & Richstone, D. 1995, ARAA, 33, 581
- Magorrian et al. (1998) Magorrian, J., et al. 1998, A.J, 115, 2285
- Marconi et al. (2004) Marconi, A., Risaliti, G., Gilli, R., Hunt, L. K., Maiolino, R., & Salvati, M. 2004, MNRAS, 351, 169
- Matt et al. (1999) Matt, G., Pompilio, F., & La Franca, F. 1999, New Astronomy, 4, 191
- Sazonov et al. (2007) Sazonov, S., Revnivtsev, M., Krivonos, R., Churazov, E., & Sunyaev, R. 2007, A&A, 462, 57
- Simpson (2005) Simpson, C. 2005, MNRAS, 360, 565
- Treister & Urry (2005) Treister, E., & Urry, C. M. 2005, Ap.J., 630, 115
- Treister et al. (2009) Treister, E., Urry, C. M., & Virani, S. 2009, arXiv:0902.0608
- Tueller et al. (2008) Tueller, J., et. al., 2008, Ap.J., 681, 113