Doppler-Broadened Iron X-ray Lines from Tycho’s Supernova Remnant
Abstract
We use Suzaku observations to measure the spatial variation of the Fe K line with radius in the Tycho supernova remnant. The Fe line widths show a significant decrease from a FWHM value of 210 eV at the center to 130 eV at the rim. Over the same radial range the line center energy remains nearly constant. These observations are consistent with a scenario in which the shell of Fe-emitting ejecta in Tycho is expanding at speeds of 2800–3350 km s-1. The minimum line width we measure is still a factor of two larger than expected from a single component plasma emission model. If thermal Doppler broadening is the dominant additional source of broadening, we infer an ion temperature of K.
1 Introduction
Type Ia supernovae (SNe) play an important role in the chemical evolution of the universe by providing a significant fraction of the Fe group elements in stars, the interstellar medium and the intracluster medium. They have also become a prime tool to explore the expansion history of the universe. Yet, in spite of their importance, the physical processes involved in the actual explosions remain unclear.
The SN seen by Tycho Brahe in 1572 can be classified with some degree of confidence as Type Ia based on the light curve and color evolution from the historical record (Ruiz-Lapuente, 2004). The remnant (hereafter Tycho) is located at Galactic coordinates = (120∘.0879, 1∘.4460) and its estimated distance is 1.5–3.1 kpc (Chevalier et al., 1980; Albinson et al., 1986; Smith et al., 1991; Ruiz-Lapuente, 2004), but still debated (Schwarz et al., 1995).
Tycho is now a young and X-ray bright supernova remnant (SNR) that has been studied extensively for investigations of the SN Ia explosion mechanism. In the radio and X-ray bands, Tycho shows a relatively smooth and regular diameter limb-brightened shell with several protuberances and indentations notably toward the southeast (SE) and northeast (NE) parts of the shell, possibly driven by fingers of SN ejecta or the consequence of the blast wave interacting with a nonuniform ambient medium. The good angular resolution and photon statistics of Tycho observations by Chandra and XMM-Newton have enabled detailed studies of the spatial structure (Warren et al., 2005) and have set significant constraints on allowed explosion models by comparing observed and simulated X-ray spectra (Badenes et al., 2006). Among the results revealed by Chandra is one that finds the region between the forward shock and contact discontinuity to be very narrow and dominated by nonthermal emission, concentrated in geometrically thin filamentary structures (Hwang et al., 2002; Bamba et al., 2005; Warren et al., 2005; Cassam-Chenai et al., 2007). No thermal emission has yet been detected from the forward shock region; all the observed metal lines in the X-ray spectrum are produced predominantly by the ejecta.
A direct measurement of the expansion velocity of Tycho has not yet been obtained. Reynoso et al. (1997) reported the expansion rate obtained from the radial displacement of the radio-emitting shell over the course of a decade. Hughes (2000) obtained the rate from a difference of brightness profiles measured from two ROSAT HRI observations taken in 1990 and 1995. These studies indicate expansion velocities of the outer rim of Tycho of 2000–4300 km s-1 (radio) and 2200–4600 km s-1 (X-ray), where the large range is dominated by the distance uncertainty. Reynoso et al. (1997) found a variation with azimuth of the outer rim expansion rate and expansion parameter from 0.25 to 0.75. Combining a distance of 2.3 kpc with their age (416 yr) and their radii leads to a range of observed rim velocities versus azimuth of 1700–4300 km s-1.
Tycho shows a strong Balmer line with a profile consisting of narrow and broad components. The width of the broad component and intensity ratio have been used to measure the shock velocity without distance dependence. (Chevalier et al., 1980; Smith et al., 1991; Ghavamian et al., 2001). These studies yield velocities of 1800–1900 km s-1 (Hα width) and 1800–3500 km s-1 for the optical bright knot ”g”.
In this Letter we determine, for the first time, the expansion velocity of the Fe ejecta in Tycho from Doppler broadening of the Fe K lines, utilizing the modest imaging capability and well calibrated instrument response of the Suzaku CCD cameras (Ozawa et al., 2009). We refer the reader to Tamagawa et al. (2009) for more details on the broadband continuum emission of Tycho and the discovery of faint lines from the Fe-group elements Cr and Mn in the integrated Suzaku spectra.
2 Observation
Suzaku, the fifth Japanese X-ray astronomy satellite (Mitsuda et al., 2007), was launched into a 550 km high orbit on 2005 July 10. It contains two types of functioning instruments: X-ray CCD cameras (Koyama et al., 2007, XIS) covering the 0.2–12 keV energy range, and a nonimaging hard X-ray detector (Takahashi et al., 2007; Kokubun et al., 2007, HXD) sensitive to X-rays in the 10–70 keV band (PIN diodes) and 30–600 keV band (GSO scintillators). The four XIS cameras are each located at the focus of an independent X-ray telescope (Serlemitsos et al., 2007, XRT). One of the four XIS cameras utilizes a back-illuminated (BI) CCD, whereas the other three use front-illuminated (FI) CCDs. (N.B., one of the FI CCD cameras mentioned was lost in 2006 November.)
Tycho was observed by Suzaku on 2006 June 27–29 during the time allocated to the Science Working Group. The XIS was operated in normal full-frame clocking mode without spaced-row charge injection (Uchiyama et al., 2009).
We started with data processed through the standard pipeline (version 2.0.6.13) using calibration reference files publicly released on 2008 February 1. Data accumulated during passage through, and for an additional 436 s after emerging from, the South Atlantic Anomaly (SAA) were discarded as were orbital periods of low cut-off rigidity (less than 6 GV). We also rejected data taken at low elevation angles to the Earth’s rim (less than from the limb of the sunlit Earth and less than from the rim of the dark Earth). Hot and flickering pixels were removed with SISCLEAN and only events with grades of 0, 2, 3, 4 and 6 were retained.
Suzaku also observed an offset region close to Tycho on 2006 June 29–30 for purposes of background estimation. We applied the same screening criteria and event selection described above to this background observation. Two faint unidentified X-ray sources appear in the offset pointing roughly 4’ and 7’ southwest of the center of the field of view (FOV) (see Figure 2 in Tamagawa et al., 2009). These sources are located in the Tycho annular analysis regions numbered 6 and 7 (see Section 3 below). We can, however, safely neglect these sources, since their emission is 10 times fainter than that of Tycho in the 2–5 keV band.
The net exposures of on-source and offset data after the data reductions are 101 ks and 51 ks, respectively. Details of these observations have been summarized in Tamagawa et al. (2009).
3 Spatially Resolved Line Spectra
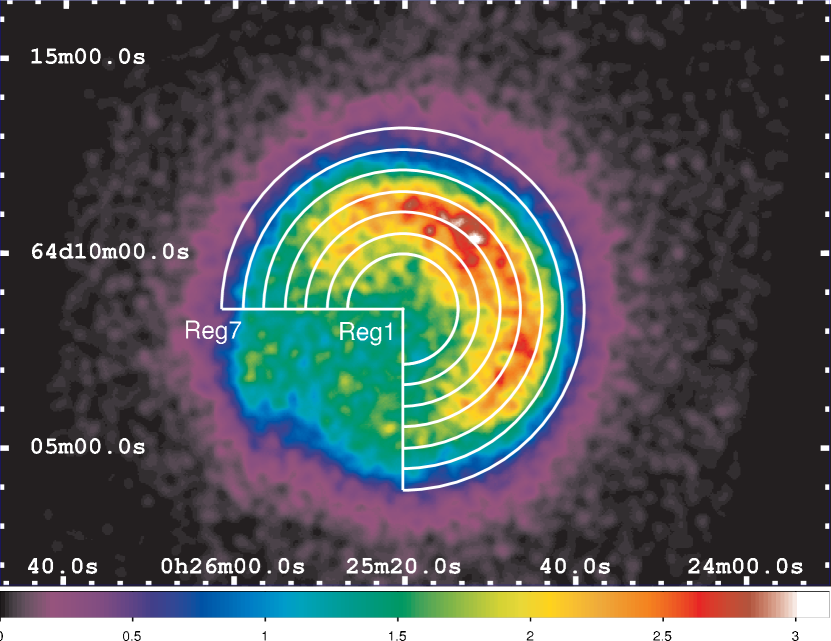
Guided by the nearly circular, shell-like structure of Tycho we divided the XIS FOV into a central region 1’.41 in radius, surrounded by six additional annular regions each 0’.54 wide in order to examine radial variations in the spectral parameters. Since the structure of the remnant is distorted toward the SE, as clearly seen in the Chandra and XMM-Newton observations (Decourchelle et al., 2001; Warren et al., 2005), we have excluded the SE quadrant, as indicated in Figure 1. The remaining NE, NW, and SW quadrants of Tycho show a similar shell-like morphology in the Fe K line (Warren et al., 2005). Background spectra were accumulated from the offset observation using the same region in detector space.
Our spectral model consists of a power-law component (which which well approximates the continuum emission in Tycho see Tamagawa et al., 2009) and several Gaussians to account for the prominent emission lines. At the energy resolution of the XIS, most observed line features include multiple emission lines. In order to reduce the effects of line blending from different transitions or even different elemental species, the spectral fits were performed in the following narrow bands separately: 1.784–1.894 keV for He-like Si K, 2.40–2.60 keV for He-like S K and 6.00–6.90 keV for Fe K. For this Letter, we focus primarily on the Fe K line profiles. The lower energy lines, and Si He-like K in particular, are subject to complexities in the calibration of the energy scale, and thus require a much more careful analysis. We defer this to a subsequent paper, but use the Si and S line profiles for illustrative purposes only in this Letter.
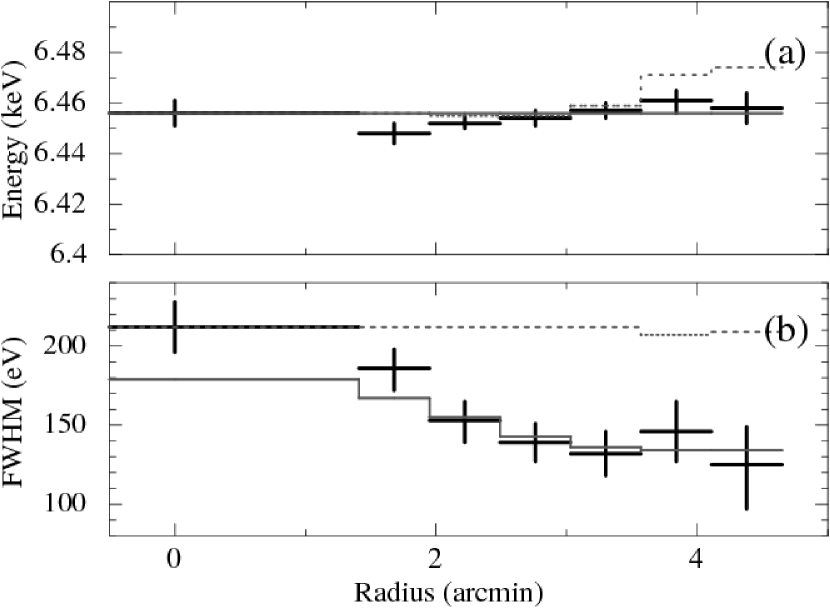
Best-fit values and uncertainties (at 90% confidence) are quoted in Table 1 for the Fe K spectra (labeled from the center, Reg1, to the rim, Reg7) and Figure 2 shows the radial dependence of these parameters. The average centroid energy we find, eV is consistent with previous measurements by ASCA and XMM-Newton (Hwang and Gotthelf, 1997; Badenes et al., 2006). Tamagawa et al. (2009) used the same Suzaku observation data and obtained the centroid over the whole remnant as eV. The difference of 10 eV is caused by using different calibration reference files, since calibration reference files publicly released in 2007 were used in Tamagawa et al. (2009). The line centroids prefer a slight radial gradient corresponding to an increase of 12 eV from the center to the rim. The line widths on the other hand show a highly significant gradient from a FWHM value of 210 eV near the center to values of 140 eV at the rim. A flat profile can be rejected with high confidence (greater than ).
To estimate the calibration error of the current response function, the width of the Mn K calibration line from the built-in calibration source (55Fe), which illuminates the two far-end corners from the readout node, has been examined. The width of the calibration line has been obtained to be eV FWHM. In the source detected region, the broadening due to the charge transfer inefficiency (CTI) is smaller than that of the calibration source because of the reduced number of charge transfers. Our obtained widths (130–210 eV) in Tycho are significantly larger than that of CTI induced broadening.
We note that because of the broad point-spread function (PSF) of the Suzaku XRT (half-power diameter of 2′) the radial bins used here are not fully independent. To assess the effects of smearing, we used XISSIM to simulate an XIS image assuming a thin shell model for the radial surface brightness profile of the Fe K line intensity (as given in Warren et al., 2005). Only 25% of the observed events in region 6 actually originate from this sky region; 60% come from regions 4 and 5 where the Fe K brightness peaks. Virtually all of the photons in region 7 (the rim) come from regions 4, 5 and 6. Thus any true intrinsic spatial variation of the line parameters in the outermost three radial bins has been smeared out by the XRT PSF. On the other hand, smearing effects of the XRT are much less important for the variation interior to radii of 3′.
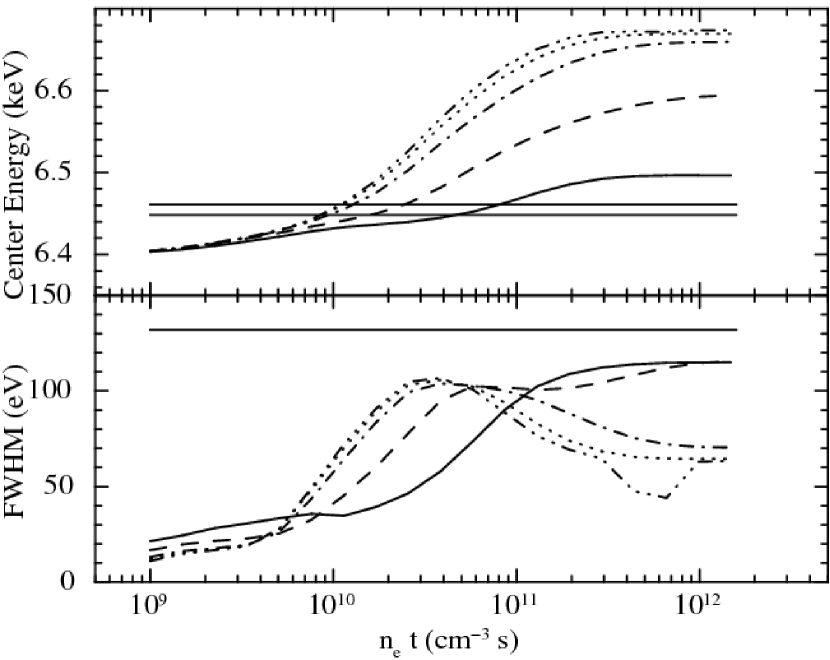
The ionization age can be estimated from the line center energy. Our measured central energies of 6448–6461 eV and widths of 130–210 eV FWHM indicate the existence of low ionized Fe below FeXVIII. Of the nonequilibrium plasma emission models in XSPEC, only the NEI version 1.1 model includes low ionized (below He-like) ions. We therefore use this model. Figure 3 shows the ionization age dependence of the centroid energy and width at various electron temperatures when the modeled Fe K blend is fitted by a single Gaussian line.
Our measured central energies of 6448–6461 eV correspond to Fe ionization ages in the range for all electron temperature values keV. Simulated spectra over this range of thermodynamic parameters yield expected Gaussian widths for the Fe K blend of only 50–110 eV FWHM. These values are far below what we measure in the central region ( 210 eV) and even at the rim (130 eV), implying the presence of additional line broadening mechanisms in TychoṘesults from the independent Si and S band analyses also show similar tendencies in the radial dependence of line centroids and widths. Calibration uncertainties and line blending complicate the analysis of these lower energy lines; we defer a quantitative discussion of these results to a future study.
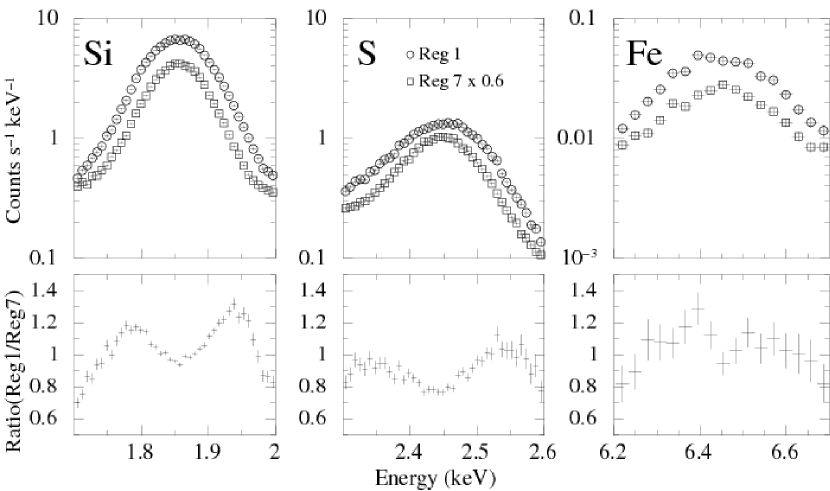
In order to directly compare the line profiles without model fitting, we took the ratio of the narrowband spectrum in region 7 (rim) to that in region 1 (center) for the Si, S and Fe K lines (Figure 4). All three ratios show a similar profile characterized by an “M” shape (lower in the middle, higher at the edges). The ratios show that the line shape in the central region is significantly broader than at the rim for all three lines.
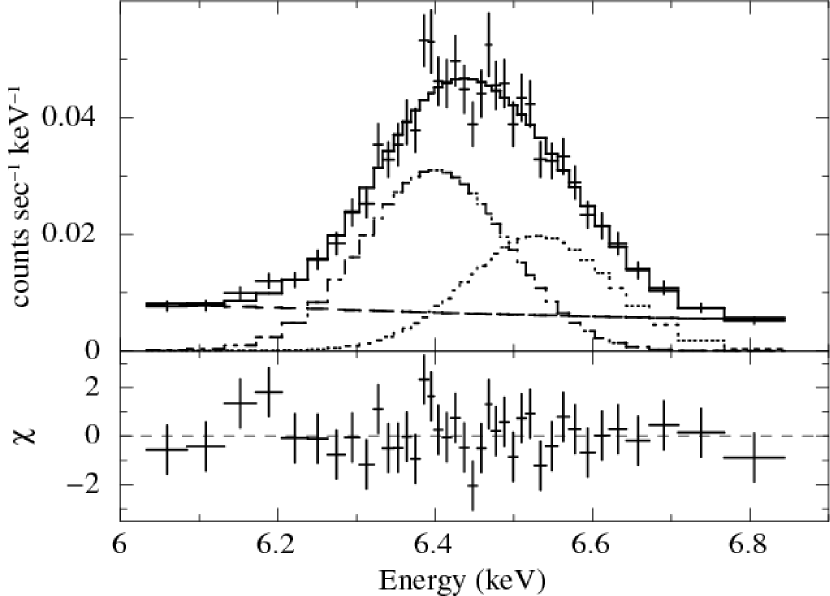
To investigate further the broad Fe K line profile, we next fitted a double Gaussian line plus power-law continuum model to the spectrum extracted from the remnant’s center. Both Gaussian widths were fixed at the value obtained from the rim (130 eV FWHM). The fits were acceptable as shown in Figure 5 with best-fit center energy values of eV and eV and normalizations of photons cm-2 s-1 and photons cm-2 s-1, respectively. The difference in line energies corresponds to a velocity difference of km s-1 or it can be interpreted as contributions from ionization timescales of cm-3 s and cm-3 s. When we change the fixed width within the 90% confidence level (100–150 eV FWHM), the center energy values vary by only eV, well within the 90% error range.
4 Discussion and Conclusion
The excellent energy resolution of the Suzaku XIS has enabled us to discover significant broadening of the Si, S and Fe emission lines in Tycho as well as a clear decrease in the line widths from the center toward the rim. In the following discussion we consider, in turn, two simple astrophysical interpretations of these observations: (1) radial variations of the thermodynamic state of the X-ray-emitting plasma and (2) expansion of a spherical shell.
The presence of two Gaussian lines in the central region can be explained naturally by the presence of two (or more) different plasma states: hot gas with low ( cm-3 s) and high ( cm-3 s) ionization timescales. There is some independent evidence for this, resting on the observation that the Fe K emission in Tycho peaks interior to that of Fe L and Si K (Hwang and Gotthelf, 1997; Decourchelle et al., 2001; Hwang et al., 2002). The theoretical interpretation (Badenes et al., 2006) is that the shocked ejecta exhibit a radial temperature and ionization timescale variation in the sense that near the contact discontinuity the ejecta are cool with high ionization age, while near the reverse shock they are hot with low ionization age. Guided by this theoretical picture, let us consider a simple two-zone model in which the interior half of the Fe-emitting shell produces a 6.41 keV line while the exterior half produces a line at 6.54 keV. The relative proportions of the emission from each of these shells seen in projection will vary from the center to the rim, which will produce a radial change in the observed line width. However our calculations show that the broad PSF of the telescope smears out the radial variation in width which, under this scenario, occurs most rapidly near the rim where the differences in the projected surface brightnesses of the emission zones are most extreme. This is unlike the smooth gradual drop with radius in the observed profile. Another problem for this model is that it produces a fairly large shift (greater than 30 eV) in the centroid of the Fe K line between the center and the rim. This is somewhat larger than the shallow gradient of 12 eV observed in Tychoİn Figure 2, profiles expected for the two-zone model (with assumptions of low ionized Fe shell (6.41 keV line) of 3′–3′.5 and high ionized shell (6.54 keV line) of 3′.5–4′) are shown. It suggests that the two-zone model cannot describe the constant center energy in the outer portion and gradual drop of the width.
If the Fe emission comes from a radially expanding shell, then the projection of redshifted and blueshifted lines from the rear (receding) and front (approaching) parts of the shell will produce a double line near the center. Furthermore, the energy separation of the lines depends on the velocity component along the line of sight, which varies as a cosine function with projected distance from the center. At the rim the shell velocity is transverse to the line of sight and so the line width there should be minimum. In the ideal case the energy centroid of the line should be constant with radius, although deviations from spherical symmetry can introduce some variation. In general the centroid and width profiles of the Fe K line we measure in Tycho are more consistent with an expanding shell interpretation than multiple thermodynamic emission zones. In Figure 2, the radial profiles expected for the expanding shell model (with assumptions of expansion velocity of 3000 km s-1 and radius of the shell of ) are shown.
The minimum line width of 130 eV FWHM we obtain at the rim, where velocity broadening should be minimal, is still wider than that expected from a single-component NEI model (50–110 eV FWHM). An additional source of broadening, at the level of 70–120 eV, is therefore required. Under the assumption that this comes fully from thermal Doppler broadening (i.e., ignoring macroscopic turbulence), we estimate the ion temperature to be (1–3) K. This is consistent with the shock temperature expected in models that well describe the ejecta spectrum of Tycho (see Figure 8 in Badenes et al., 2006).
Our observations thus indicate that the Fe-emitting ejecta of the Tycho SNR is expanding at a velocity of 3000 km s-1. If macroscopic mixing of the ejecta has not taken place, then we would expect the intermediate mass elements (Si and S) to show even larger velocities. Estimating the expansion speed for these other species is going to be important for further investigation of the three-dimensional structure and dynamics of TychoḞor that purpose, careful calibration of the energy scale around the Si K emission line and more precise modeling of the X-ray spectrum are needed. More detailed results including these other elements will be presented in a forthcoming paper (A. Hayato et al. 2009, in preparation).
References
- Albinson et al. (1986) Albinson, J. S., Tuffs, R. J., Swinbank, E., & Gull, S. F., 1986, MNRAS, 219, 427
- Badenes et al. (2006) Badenes, C., Borkowski, K. J., Hughes, J. P., Hwang, U., & Bravo, E., 2006, ApJ, 645, 1373
- Bamba et al. (2005) Bamba, A., Yamazaki, R., Yoshida, T., Terasawa, T., & Koyama, K., 2005, ApJ, 621, 793
- Cassam-Chenai et al. (2007) Cassam-Chenai, G., Hughes, J. P., Ballet, J., & Decourchelle, A., 2007, ApJ, 665, 315
- Chevalier et al. (1980) Chevalier, R. A., Kirshner, R. P., & Raymond, J. C., 1980, ApJ, 235, 186
- Decourchelle et al. (2001) Decourchelle, A. et al., 2001, A&A, 365, L218
- Ghavamian et al. (2001) Ghavamian, P., Raymond, J., Smith, R. C., & Hartigan, P., 2001, ApJ, 547, 995
- Hughes (2000) Hughes, J. P., 2000, ApJ, 545, L53
- Hwang et al. (2002) Hwang, U., Decourchelle, A., Holt, S. S., & Petre, R., 2002, ApJ, 581,1101
- Hwang and Gotthelf (1997) Hwang, U., & Gotthelf, E. V., 1997, ApJ, 475, 665
- Kokubun et al. (2007) Kokubun, M. et al., 2007, PASJ, 59. S53
- Koyama et al. (2007) Koyama, K. et al., 2007, PASJ, 59, S23
- Mitsuda et al. (2007) Mitsuda, K. et al., 2007, PASJ, 59, S1
- Ozawa et al. (2009) Ozawa, M. et al., 2009, PASJ, 61, S1
- Reynoso et al. (1997) Reynoso, E. M., et al., 1997, ApJ, 491, 816
- Ruiz-Lapuente (2004) Ruiz-Lapuente, P., 2004, ApJ, 612, 357
- Schwarz et al. (1995) Schwarz, U. J., Goss, W. M., Kalberla, P. M., & Benaglia, P., 1995, A&A, 299, 193
- Serlemitsos et al. (2007) Serlemitsos, P. J. et al., 2007, PASJ, 59, S9
- Smith et al. (1991) Smith, R. C., Kirshner, R. P., Blair, W. P., & Winkler, P. F., 1991, ApJ, 375, 652
- Takahashi et al. (2007) Takahashi, T. et al., 2007, PASJ, 59, S35
- Tamagawa et al. (2009) Tamagawa, T. et al., 2009, PASJ, 61, S167
- Uchiyama et al. (2009) Uchiyama, H. et al., 2009, PASJ, 61 S9
- Warren et al. (2005) Warren, J. S. et al.,2005, ApJ, 634, 376
| Region | Centroid | Width (FWHM) |
|---|---|---|
| (eV) | (eV) | |
| Reg1 | ||
| Reg2 | ||
| Reg3 | ||
| Reg4 | ||
| Reg5 | ||
| Reg6 | ||
| Reg7 |
Note. — All errors are quoted at the 90% confidence level.