Detection of Star Formation in the Unusually Cold Giant Molecular Cloud G216111Based on observations made with ESO telescopes at the La Silla Observatory
Abstract
The giant molecular cloud G216-2.5, also known as Maddalena’s cloud or the Maddalena-Thaddeus cloud, is distinguished by an unusual combination of high gas mass ( M⊙), low kinetic temperatures (10 K), and the lack of bright far infrared emission. Although star formation has been detected in neighboring satellite clouds, little evidence for star formation has been found in the main body of this cloud. Using a combination of mid-infrared observations with the IRAC and MIPS instruments onboard the Spitzer space telescope, and near-IR images taken with the Flamingos camera on the KPNO 2.1-meter, we identify a population of 41 young stars with disks and 33 protostars in the center of the cloud. Most of the young stellar objects are coincident with a filamentary structure of dense gas detected in CS (). These observations show that the main body of G216 is actively forming stars, although at a low stellar density comparable to that found in the Taurus cloud.
1 Introduction
The weak CO emission from the cold giant molecular cloud G216-2.5 was first discovered by Maddalena & Thaddeus (1985) in a survey of the Orion-Monocerous region. The cloud is unusual because it has the typical size ( pc, Maddalena & Thaddeus 1985) and mass ( M⊙, Lee et al. 1994) of a giant molecular cloud (hereafter: GMC), yet it has a kinetic temperature of only 10 K (Williams & Blitz 1998). The low temperature is unusual for GMCs and is more typical of dense cores in the Taurus dark cloud (Jijina et al. 1999). Perhaps the most unusual characteristic of the cloud is the lack of star formation. Maddalena & Thaddeus (1985) found no clear evidence for star formation within the G216-2.5 GMC (hereafter: G216); a result supported by subsequent IRAS maps showing a distinct absence of emission from dust heated by internal young stars (Lee et al. 1996). Considering the current distance estimate of 2.2 kpc (Lee et al. 1991), the absence of bright far-IR emission only rules out the presence of young high mass stars. Young low to intermediate mass stars could have escaped the detection by IRAS. Nevertheless, the evident lack of massive star formation is in itself unusual since GMCs almost ubiquitously contain young massive stars (Williams & McKee 1997).
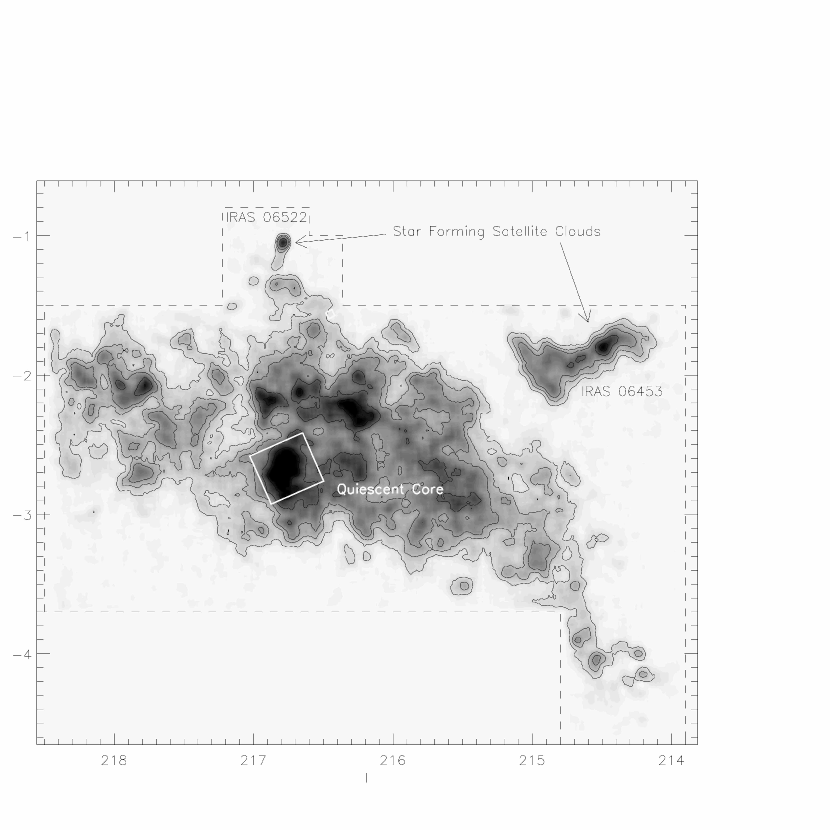
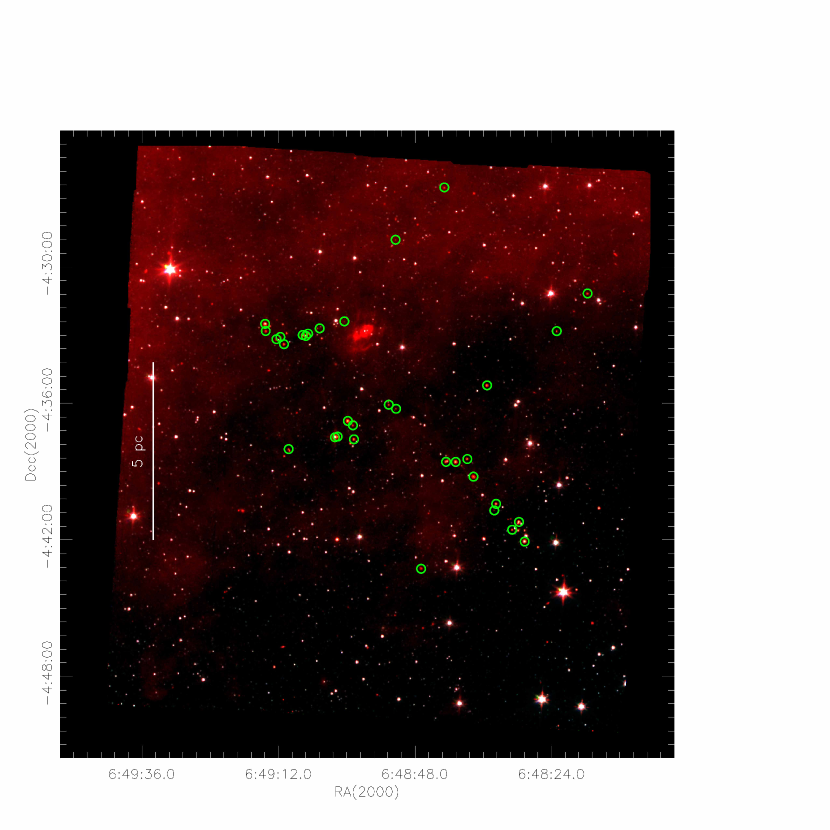
Because of the lack of evident star formation, G216 has been considered the best example of a quiescent GMC and potentially, a rare example of a GMC before the onset of star formation (Maddalena & Thaddeus 1985). In the 1990s, near-IR imaging by Lee et al. (1996) revealed two small groups of young stars in satellite clouds on the northern edge of G216 (Fig. 1). One of these regions is associated with a radio source/HII region which was first noted by Maddalena & Thaddeus (1985), but Maddalena et al. could not reliably associate the radio source with the satellite cloud. Near-IR observations of the main body of the cloud failed to detect any stellar groups similar to those in the satellite clouds.
Lee et al. (1994) argued that the main body of the cloud was the site of past star formation. Their evidence was the the presence of shell-like structures in the cloud, the existence of a large scale velocity gradient across the cloud, and a virial mass five times the mass estimated from the luminosity of the 13CO emission; all of these features could be the result of previous episodes of star formation which stirred up motions in the cloud. In support of this idea, HI mapping by Williams & Maddalena (1996) showed that G216 is linked by a 50 pc photodissociation region to two neighboring molecular clouds containing young OB stars. In total, these observations have established that G216 is part of a larger complex; however, it is not clear whether G216 is a relic of past star formation or a quiescent component of a larger cloud complex containing star forming clouds. To date, the relic scenario has one major drawback: the lack of a detectable population of stars in the cloud. Interestingly, the only sites of previously known star formation directly associated with G216 are found in satellite clouds near the surface of G216 that faces the Sh287 star forming region (Fig. 1). This geometry suggests that star formation may have been initiated by interactions with Sh287.
Despite the controversy over the nature of G216, it remains an unusually cold and quiescent cloud compared to other GMCs with similar masses. For this reason, detailed studies of this cloud may offer new insights into the condition necessary for star formation and the factors that drive the rate and efficiency of star formation. We have recently completed a Spitzer space telescope survey of the core of G216. This core region shows an extended region of relatively high column density gas (Lee et al. 1991, Heyer et al. 2006), but previous to this study showed little evidence for ongoing star formation. Using Spitzer and data from the KPNO 2.1 meter and SEST telescopes, we show that the central core contains a complex of dense cores undergoing star formation. A total of 33 protostars is found, indicating that the region is currently undergoing vigorous star formation. In addition 41 young pre-main sequence stars with disks are identified. We compare the rate of star formation in G216 to that in nearby molecular clouds in Orion and Taurus.
2 Observations & Data Reduction
G216 was observed with the IRAC and MIPS instruments onboard the Spitzer space telescope for the GO program PID 3178 (Fazio et al. 2004, Rieke et al. 2004). The field was mapped with the IRAC instrument in two separate observations on March 25, 2005. During each observation, images were taken at series of pointing positions defined by a rectangular grid with a spacing between adjancent grid points of . This resulted in four overlapping but offset maps in the separate IRAC bands providing complete four band coverage over a region. Three dithered 30 second frames were taken at every grid position. The high dynamic range mode was selected; each 30 second frame was accompanied by a 1.2 second frame. The total integration time for the two observations and three dithers was 160.8 seconds. The MIPS data were obtained in four separate observations: two on October 10, 2004, one on April 01, 2005 and one on April 08, 2005. In total, four scan maps centered on the same position were obtained; these were executed with the medium scan rate. Since the direction of the scanning depended on the date observed, the four maps have three different scan orientations. This improves the redundancy of the data and minimizes artifacts. The scan maps are in extent with spacings between the scan legs.
Photometric magnitudes in the four IRAC bands were extracted with PhotVis version 1.10, an IDL GUI-based photometry visualization tool (Gutermuth et al. 2004). The aperture size was 2 pixels () and the sky annulus extended from 2 () to 6 () pixels. To convert the signal (measured in DN s-1) to magnitudes, we used zero points of 19.6642, 18.9276, 16.8468 and 17.3909 in the 3.6, 4.5, 5.8 and 8 m bands respectively (these are derived from the calibration of Reach et al. 2005). The signal was multiplied by an aperture correction to take into the small aperture size; the adopted values were 1.213, 1.234, 1.379, and 1.584 for 3.6, 4.5, 5.8 and 8 m bands, respectively. The magnitudes from the 1.2 s frames were used if the long frame magnitudes were less than 11, 10, 7, and 8 at 3.6, 4.5, 5.8 and 8 m, respectively; at this point, a comparison of the 30 and 1.2 s frame photometry showed that the long frames were becoming non-linear. A total of 11,195 sources were detected in at least the 3.6 and 4.5 m bands and 2508 sources were detected in all four IRAC bands.
The MIPS data were processed using the MIPS instrument team’s Data Analysis Tool (Gordon et al. 2005), which calibrates the data, corrects distortions, and rejects cosmic rays during the co-adding and mosaicking of individual frames. The MIPS 24 m mosaic created from the four scan maps has a pixel size of and units of DN s-1 pix-1. MIPS 24 m photometric magnitudes were extracted using the IDL implementation of DAOPHOT in the IDL Astronomy User’s Library (Landsman 1993). Sources were first identified with PhotVis. An initial determination of their magnitudes was then obtained by aperture photometry with PhotVis; the aperture was set to 5 pixels () and the sky annulus extended from 12 () to 15 () pixels. The zero point magnitude for the mosaicked 24 m data was 16.05. This assumed a mosaic pixel that was 1/2 the diameter of an instrument pixel, a calibration factor of Jy per DN s-1 per inst. pix, a zero magnitude flux of 7.17 Jy, and a correction from 12 pixels to infinity of 1.146 (Engelbracht et al. 2007). Since we measured our photometry with a 5 pixel aperture, a correction from a 5 pixel to 12 pixel aperture was determined from the brighter stars in our sample; the correction of -0.428 mag was included in the zero point magnitude. A PSF with a 15 pixel radius was then generated using 10 bright, isolated stars scattered around the 24 micron image; these were selected to be relatively free of contamination from nearby sources and nebulosity. The aperture photometry of these 10 stars set the calibration of the PSF fitting photometry. The PSF was fit to all the point sources identified in the image using a 2 pixel fitting radius (i.e. only pixels in an inner 2 pixel radius were used in the fit). The PSF fit to each source was then subtracted and the above procedure was repeated to identify faint point sources hidden in the wings of brighter sources. In the second iteration, 13 additional sources were found. A total of 253 sources had detection in all four IRAC bands and the MIPS 24 m band.
The 70 m mosaic created from the four scan maps has a pixel size of and units of DN s-1. We performed point source identification and photometry on the MIPS 70 m mosaic with Photvis. An aperture size of and a sky annulus extending from to were used. The adopted zero magnitude was of ; this was based on an aperture correction of 2.07, a calibration factor of 1.6 Jy (DN/s/pix)-1, and a zero flux of 0.778 Jy (Gordon et al. 2007).
Deep near-IR data were obtained with the Flamingos camera on the KPNO 2.1-m telescope on November 2, 2004. Flamingos data reduction was performed using custom IDL routines, including modules for linearization, flat-field creation and application, background frame creation and subtraction, distortion measurement and correction, and mosaicking. Point source detection and synthetic aperture photometry of all point sources were carried out using PhotVis. Aperture photometry was performed using radii of 2”.73, 3”.64, and 6”.06 for the aperture, inner, and outer sky limits, respectively. The photometry was calibrated by measuring the magnitude offset between the instrumental magnitudes derived from the Flamingos data and the apparent magnitudes from the 2MASS point source catalog. For the -band data, the offset was dependent on the pixel location of the point source. A position dependent offset was derived by fitting a 3rd order polynomial to the offset as a function of row and column number.
We observed in the CS () line during 12 nights in January of 1993 with the SEST 15 m telescope. We used the 3 mm schottky receiver coupled to a 2000 channel acousto–optic spectrometer with a 80 kHz resolution. The image sideband response was 26 db below that of the signal. The object was observed using position switching, with an integration time of 60 seconds on source followed by 60 seconds on the reference position. This was repeated 10 times per position, giving a total on source integration time of 10 minutes per position on source. We mapped the cloud using a grid in RA and Dec (1950). The beamsize was 50″.
The calibration was made using the chopper wheel method (Rohlfs & Wilson 2004). The Orion SiO maser was used for pointing. RMS pointing uncertainties were less than 8″. The total CS() flux of the Orion SiO maser was repeatable to within 10%, except on the last night. We note that only 21 points were observed on the last night: these points were typically non-detections. The average system noise (after correcting for the effect of the atmosphere) was 450 K, the maximum was 590 K. The data were reduced using the Grenoble CLASS software using standard procedures. A beam efficiency of 0.75 was used to convert the antenna temperatures into main beam temperatures (Henkel et al. 1994); all our results are on a main–beam temperature scale.
3 Results
3.1 Identification and Classification of Young Stellar Objects
Young stellar objects (YSOs) with infrared excesses due to dusty envelopes and disks were identified and classified in G216 using methodologies developed in a series of publications (for a detailed discussion see Allen et al. 2007, Winston et al. 2007, Gutermuth et al. 2008). Since these methologies were developed for star forming regions in the nearest kiloparsec, they were modified to take into account the greater distance to G216. In addition, a new method for identifying protostars was also implemented (also see Megeath et al. 2009). The overall approach can be decomposed into three steps: the identification of candidate YSOs with infrared-excesses, the rejection of extragalactic sources contaminating the sample of candidate YSOs, and finally, the classification of the remaining YSOs as either protostars or pre-main sequence stars with disks. These steps were implemented using a suite of mid-IR color and magnitude criteria. In the following overview of our methodology, we do not entirely segregate these three steps since the details depend on the specific colors and magnitudes employed.
For the purposes of this paper, we divide our sample of YSOs with infrared excesses into two gross evolutionary categories: protostars and young stars with disks. We effectively classify objects by the slope of the spectral energy distribution (SEDs). Flat or rising SEDs with increasing wavelength (i.e. where ) are indicative of an infalling envelope; these include Class 0, Class I and flat spectrum sources. Decreasing SEDs with increasing wavelengths ( ) are indicative of stars surrounded by circumstellar disks. This approach is derived from the pre-Spitzer classification scheme of Greene et al. (1994).
The starting point of our analysis was the catalog of all point sources detected by 2MASS, Flamingos, IRAC and/or MIPS; this was compiled from the point source photometry described in Sec. 2. The first steps were to eliminate point sources which were only partially covered in our Spitzer observations and to reject photometric magnitudes with high uncertainties. In this paper, we only consider the 0.16 sq. degree region covered by all four IRAC bands as well as the MIPS 24 and 70 m bands; the Flamingos data cover a somewhat smaller region. In the following analysis, uncertainties of mag were required for the [3.6] and [4.5] photometry, mag for the [5.8] and [8] photometry, mag for the [24] photometry and mag for the Flamingos photometry. Sources were kept in the inital point source catalog as long as they contained at least one photometric magnitude
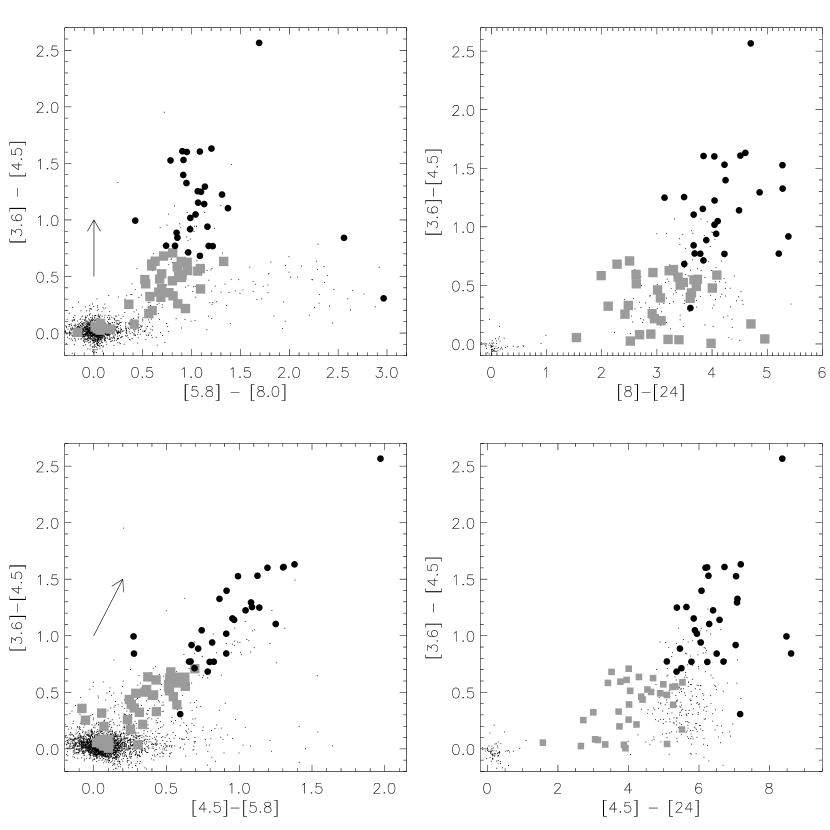
Using models of protostars and young stars with disks, Allen et al. (2004) and Megeath et al. (2004) found the IRAC [3.6]-[4.5] vs. [5.8]-[8] diagram a powerful means for identifying infrared excess sources (Fig. 2); these sources include both protostars and young stars with disks. We select IR-excess sources which satisfy the following criteria:
| (1) |
Many sources can be detected in the IRAC 3.6 m and 4.5 m bands but are not detected in the longer wavelength IRAC and MIPS bands because of the lower sensitivity to photospheres in these bands. Gutermuth et al. (2004) and Winston et al. (2007) used combined IRAC and near-IR color-color diagrams to identify young stellar objects that lack detections longward of 4.5 m. However, given our exceptionally sensitive 5.8 and 8 m data (compared to other surveys of star forming regions - this results from our relatively long integrations and the lack of a bright nebulous background), the comparatively low sensitivity of the 2MASS data for this distant region, and the mag. scatter in the deeper Flamingos photometry, we find the combined IRAC/near-IR diagrams do not show reliable new YSOs. We do find that the addition of the 24 m data does result in the identification of new YSOs. In particular, young stars with disks may not show strong excesses in the IRAC bands due to holes in their inner disks; these are the transition disks sources (Muzerolle et al. 2004). Among the sources with detections in the MIPS 24 m band, we search for young stars with transition disks by using the color criteria (Fig. 2, also see Winston et al. 2007):
| (2) |
The sample of infrared excess objects selected by the above criteria is contaminated by galaxies with strong PAH emission and AGN (Stern et al. 2005). PAH dominated galaxies exhibit colors distinct from those of YSOs; we eliminate such galaxies using the empirically derived color criteria given in the appendix of Gutermuth et al. (2008). In contrast, AGN show colors similar to those of YSOs and must be distinguished by their fainter magnitudes. We determined the optimal threshold magnitude by examining the density of AGN in survey data from the SWIRE legacy program; the SWIRE fields were chosen to study extragalactic populations with a minimum of contamination from galactic objects (Lonsdale et al. 2003). We used the point source catalog the from Elias-N2 field obtained from the NASA/IPAC Infrared Science Archive. In Fig. 3 we show the number of AGN with colors satisfying our YSO color criteria (Equations 1 & 2) as a function of their 4.5 m magnitude. The number is corrected for the smaller size of the G216 field. Assuming that the density of AGN is the same in the SWIRE and G216 fields, the histograms show that the number of expected AGN exceeds the number of YSOs for . However, instead of adopting a constant magnitude threshold, we use the color dependent magnitude threshold of Gutermuth et al. (2008). We retain the color dependence of the Gutermuth et al. criteria, but we lower the magnitude threshold by 0.5 mag to account for the greater distance to G216. Consequently, for a source to be classified as an AGN, it must satisfy all of the following criteria:
In addition, a source would have to satisfy one of the following three criteria before it is classified as an AGN:
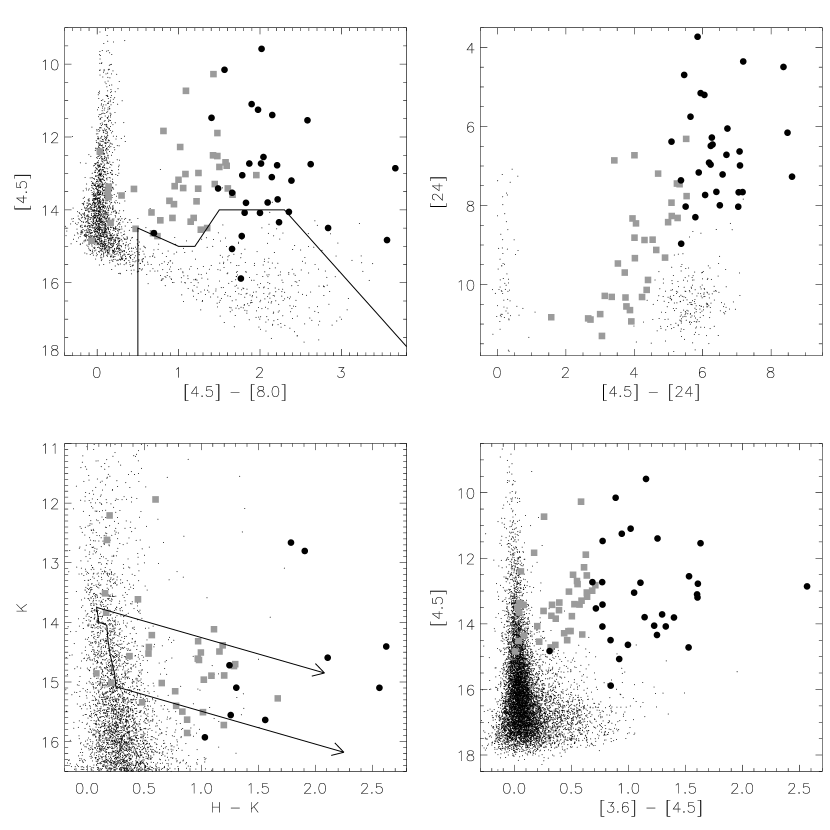
Sources with colors consistent with Equations 1 and 2 but satisfing the above criteria are rejected from the YSO sample. The division between sources selected as YSOs and AGN is shown in the [4.5]-[8] vs. [4.5] diagram displayed in Fig. 4. This figure shows that the adopted threshold is typically brighter than 15 mag at 4.5 m, and consequently, will reject the vast majority of contaminating AGN (Fig. 3). Finally, to minimize galactic contamination in the sample of transition disks (which do not have the colors of AGN), we deleted one transition disk candidate with mag.
The above criteria result in a sample of YSOs containing a mixture of protostars and young stars with disks. To distinguish between protostars and young stars with disks in that sample, and to further increase the sample of protostars, we apply criteria utilizing only the three most sensitive bands for detecting protostellar sources: the 3.6 m, 4.5 m and 24 m bands. Protostars may not be detected in the 5.8 m and 8 m bands because of the lower sensitivity in these bands, the bright nebulosity from the strong hydrocarbon features between 5 and 9 m, and the flattening and dip in the protostellar SED apparent in the 5-10 m spectral regime. Furthermore, protostars may not be detected in the near-IR bands due to their high extinction.
We identify protostars by adopting the criteria that objects exhibiting SEDs with spectral indices are protostars (Greene et al. 1994, Megeath et al. 2009). We implement this criteria by determining the photometric colors of a power-law SED with using the IRAC and MIPS spectral response curves posted on the Spitzer Science Center website. We find that protostars exhibit the following colors (Fig. 2):
| (3) |
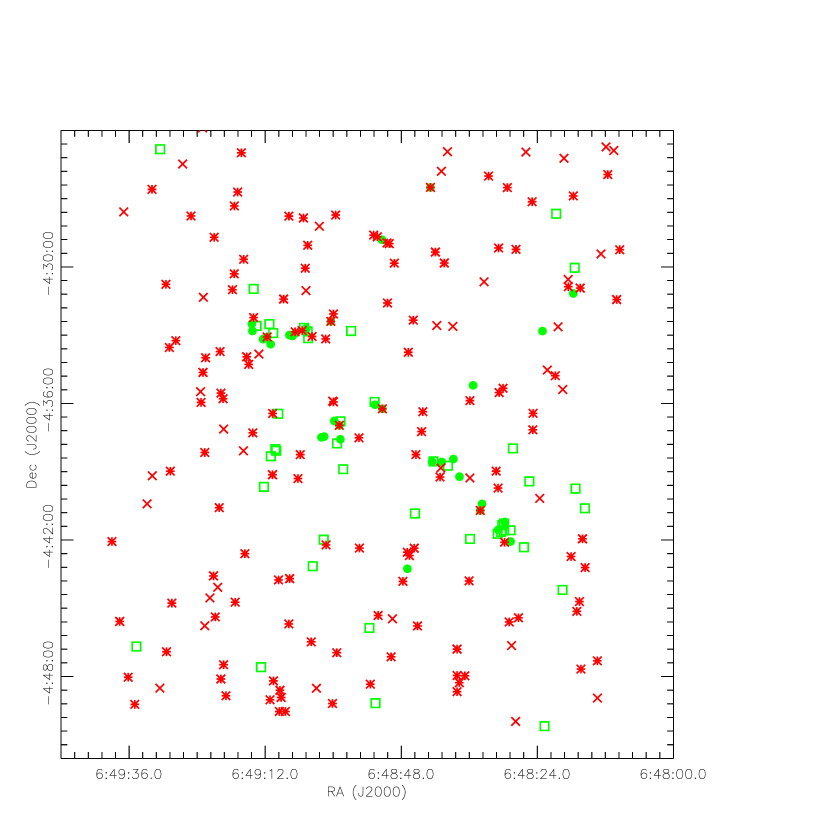
The sample of protostars selected by these color criteria also suffers from contamination by galaxies. Specifically, the [4.5]-[24] vs. [24] diagram (Fig. 4) shows a distinct clump of faint sources that satisfy our color criteria; these sources are scattered evenly across the sky and are probably extragalactic (Fig. 5). In Fig. 3, we plot the the number of galaxies in the SWIRE field which satisfy the protostar color criteria (Eqn. 3) as a function of 24 m magnitude; once again the number has been scaled to account for the smaller size of the G216 field. We compare this to the number of protostars candidates identified in the G216 field. We find that for , the number of protostar candidates exceeds the number of expected galaxies. To minimize contamination from galaxies, we adopt the following empirical criteria for YSO:
| (4) |
We find one faint protostar candidate ([24] = 9.1 mag.) clustered with the brighter protostars; we have set the threshold for YSOs to 9.15 mag so that this source is included in our YSO list. The application Equations 3 & 4 results in a sample of protostars with the following three pedigrees:
-
1.
objects identified as YSOs using the previous critiera but not previously classified as protostars
-
2.
resurrected YSOs which were previousy rejected as AGN but are now considered protostars (since deeply embedded protostars can have weak 4.5 m emission, the rejection of galaxies from the protostar sample is better done at 24 m).
-
3.
newly identified protostars which were not previously identified as infrared excess sources because of a lack of [5.8] and/or [8] photometry.
Although limited by a lower angular resolution and sensitivity than the other Spitzer bands, the 70 m data adds an additional means to identify cold protostars. One additional source is identified as a protostar on the basis of the 70 m data. This source was not initially identified as a protostar since its [3.6]-[4.5] color is similar to a young star with disk. Because of its faintness and its color, it was initially classified as an AGN. However, given its brightness in the 70 m band and its extremely red color, we include this in our protostar sample (source 14 in Table 1). The remaining sources with 70 m band detections were not classified as YSOs; these sources are fainter in the 70 m band than the previously identified YSOs and have a 70 m magnitude . In comparison, only one previously identified YSO has a 70 m magnitude ; this was identified as a protostar through its 3.6 m, 4.5 m and 24 m photometry (source 12 in Table 1). To further test whether the unclassified sources with [70] mag are background galaxies or YSOs, we examine their spatial distribution. We find that these faint sources are distributed uniformly in the 70 m mosaic; this is in distinct contrast to the protostellar sources with 70 m magnitudes which are concentrated in the center of the field. We conclude that the unclassified sources with [70] mag are primarily galaxies and do not include them in our YSO sample.
In total, 33 protostars were identified (Table 1). An alternative approach to classify protostars using the [4.5]-[5.8] colors of YSOs was proposed by Gutermuth et al. (2008). With only three exceptions, the colors of our protostars are consistent with this other criteria (Fig. 2). The remaining YSOs with infrared excesses which were not classified as protostars were classifed as young stars with disks. A total of 41 stars with disks were identified (Table 1). The distribution of protostars and young stars with disks are shown in Fig. 6.
The criteria described above are designed to minimize the contamination of the YSO sample by galaxies. The success of these criteria are apparent in Fig. 5, where we show the distribution of the YSOs and the identified contaminating galaxies. While the galaxies are uniformly distributed across the field, the YSOs do not exhibit the same uniform distribution. Nevertheless, we expect a residual of galaxies in the YSO sample. To determine the level of residual extragalactic contamination, we applied the full suite of criteria described above to the SWIRE catalog for the Elias-N2 field. After the rejection of likely galaxies, we estimate the remaining contribution of extragalactic contamination to our sample is approximately 6.2 protostars and 7.5 stars with disks. After the subtraction of this background, the corrected numbers of bona-fide protostars and young stars with disks are 27 and 33.5, respectively. We note that most of the protostars contamination occurs at the fainter magnitudes, with half of the extragalactic sources misidentified as protostars having [24] magnitudes between 8.65 and 9.15 (Fig. 3).
3.2 Distribution of Young Stellar Objects and Dense Cores
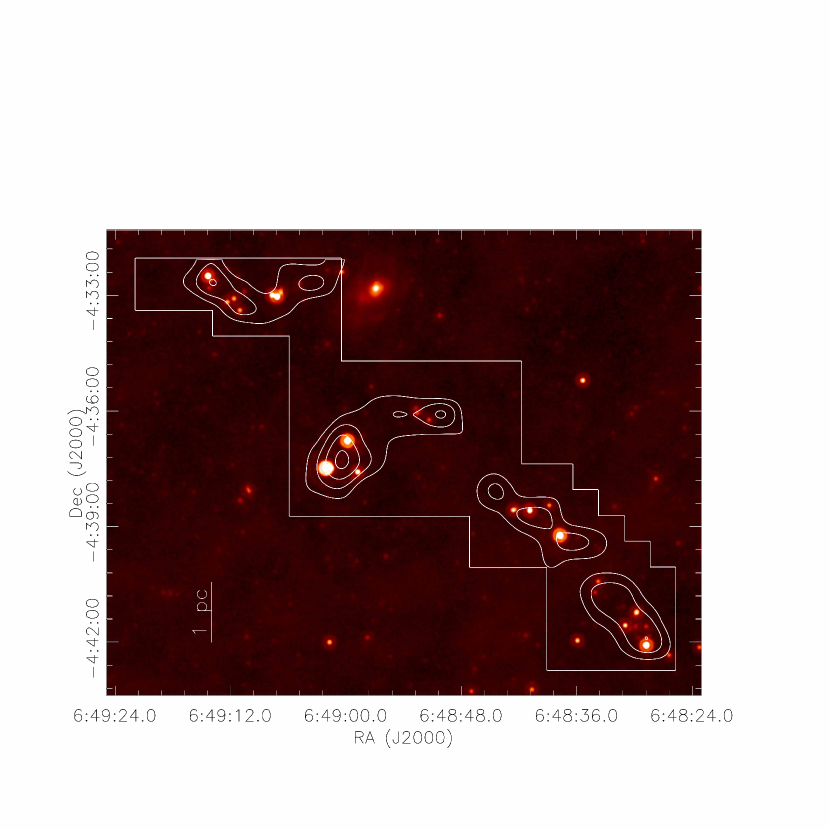
In Fig. 6, we show the distribution of young stellar objects overlaid on the IRAC images of the region. The MIPS 24 m image is displayed in Fig. 7; overlaid on the MIPS data are contours of velocity integrated CS () emission. The extent of the CS map, which is smaller than the 24 m mosaic, is also displayed. The 33 protostars and 41 stars with disks are concentrated in a region which extends diagonally through the map. The dense gas traced by the CS () emission forms a clumpy ridge extending 10 pc diagonally across the field. Most of the protostars are coincident with detectable CS emission; the six exceptions are outside the region mapped with the SEST. Most of the stars with disks are also concentrated near the dense gas ridge; the remainder are found to the south of the ridge. The region north of the ridge is almost devoid of YSOs. The number of protostars outside the ridge is equal to the number of expected contaminating galaxies; this suggests that the protostars are confined to the ridge with the sources outside the ridge being likely misidentified galaxies.
The H-K vs. K plot in Fig. 4 shows the Baraffe et al. (1998) pre-main sequence tracks for 1 Myr YSOs plotted over the G216 sources. Adopting an age of 1 Myr, most of the pre-mains sequence stars would have masses of 0.25-1.2 M⊙ (Fig. 4), with the faintest identified stars having masses close to the Hydrogen burning limit. A compact red nebula is apparent in Fig. 6; the nebula exhibits bright 8 m emission indicative of UV heated hydrocarbons. The UV source is likely to be a young star with disk found within the nebula (source 56 in Table 1). Interestingly, the infrared excess from this star is weak except at 24 m. The photometry may be affected by the nebular emission; however, visual inspection of the PSF subtracted 24 m mosaic shows that the photometry is not significantly contaminated by the nebula. The star is one of the more luminous pre-main sequence stars in this region of the cloud. Adopting an age of 1 Myr, the bright source toward the nebula lies well above the 1.2 solar mass upper limit for the tracks in Fig. 4. Two others star/disks (sources 38 and 59 in Table 1) have similar near-IR luminosities. A comparison of the photometry of these sources with Herbig Ae/Be stars from Hillenbrand et al. (1992) shows that these sources are consistent with A type stars, with K-band magnitudes and H-K colors similar to the A2 star HD 245185. Although spectroscopy is needed to confirm spectral types, these data suggest that the most massive young stars in the region are early A type stars. This would explain why the central core of G216 is not prominent in IRAS maps of the far-IR emission.
4 Discussion
Although these observations clearly demonstrate that star formation is ongoing in the central core of G216, the 74 YSOs are both small in number and distributed over a region of 230 pc2. The high proportion of protostars indicates that this is a young population of stars, and is not the result of the past episode of star formation proposed by Lee et al. (1994). However, such an older population may not exhibit the bright infrared excesses used to identify the YSOs in this study, and we cannot rule out its existence.
How does this compare to other molecular clouds? We compare G216 to two of the best studied molecular clouds near the Sun: the Taurus dark cloud complex, the prototype cloud for distributed star formation, and the Orion A giant molecular cloud, the prototype cloud for clustered star formation. Since a comprehensive Spitzer catalog for Taurus has not been published, we cannot estimate the number of YSOs with IR-excesses that would be selected in a 2200 pc distant Taurus cloud. Instead, we take a recent compilation of all known YSOs in Taurus (K. Luhman, P. Com); this contains a total of 296 sources. The entire Taurus cloud is extended over a region 1408 sq pc; the YSOs fill only a fraction of this region (Ungerechts & Thaddeus 1987). For Orion A, we use the Spitzer Orion survey and apply similar criteria as applied to G216 for identifying YSOs with IR-excesses (Megeath et al. 2009). A total of 1935 YSOs are identified in the Spitzer survey, which covers 261 sq pc (Megeath et al. 2009).
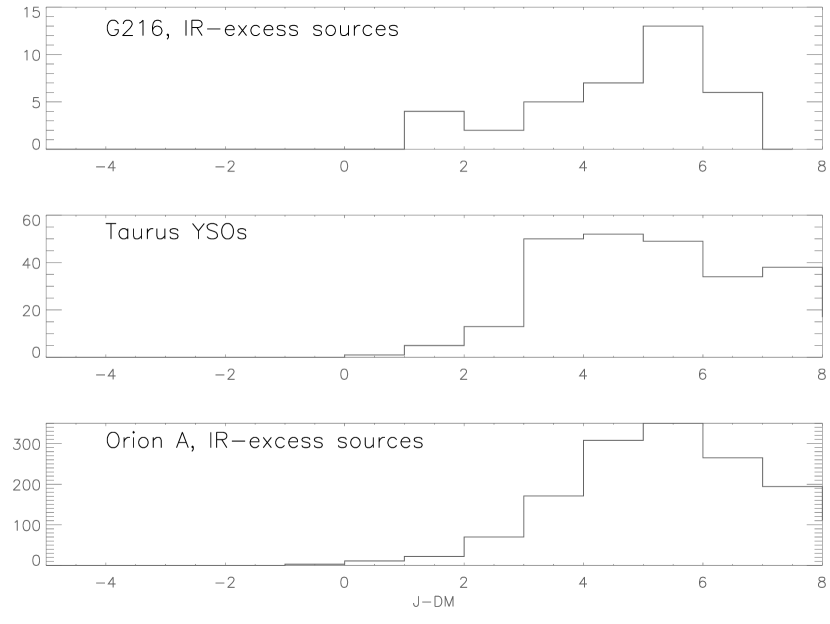
We now compare the densities of YSOs in the G216, Orion and Taurus samples. To compare these three samples, we must account for the larger distance of G216. This can be done by invoking a cutoff in the -band magnitude equivalent to the faintest -band magnitude of the G216 YSO sample. From Fig. 8, this value is , where is the distance modulus. Sources undetected in the -band, typically prototstars, were not eliminated. This is not a rigorous determination of the completeness in the G216 data; however, this crude approach is sufficient for our comparison of stellar densities. Using the magnitude cutoff, we estimate that we would detect 1372 sources in the Orion A cloud if it were placed at 2200 pc. In Taurus, we would detect 183 sources at 2200 pc.
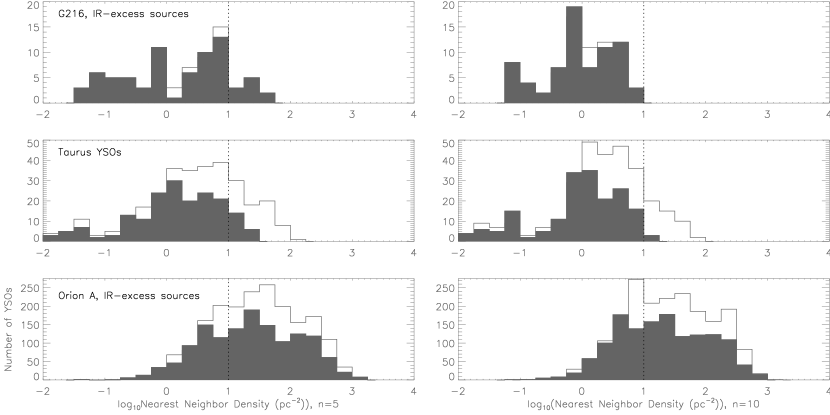
In Fig. 9, we show the distribution of local YSO surface densities measured around each YSO for G216, Taurus and Orion A. The surface density was calculated using the nearest neighbor method, in which where is the distance to the nth nearest YSO (Gutermuth et al. 2005, Casertano & Hut 1985). This was done for and using the total sample of YSOs in each cloud and using the sample of YSOs that satified the criteria. The resulting surface densities in G216 are much lower than the Orion A cloud, but are similar to those found in the Taurus dark cloud complex.
The density and configuration of YSOs in G216 are similar to those in the Taurus cloud; with small, low density groups of stars distributed among filamentary clouds. However, the cloud mass of G216 is ten times that of the Taurus cloud and is comparable to that of the Orion A cloud (Wilson et al. 2005). Interestingly, the properties of the turbulence in G216 seems to be similar to more active star forming GMCs (Heyer et al. 2006). It is, however, unlikely that G216 will evolve into an Orion cloud given the estimated star formation rate. Assuming a 0.43 Myr year lifetime for protostars (Hatchell et al. 2007), we estimate a star formation rate of 60 stars per Myr for G216. Thus, at this rate, it would take 17 Myr for G216 to form 1000 stars. This is longer than the measured lifetimes of molecular clouds (Hartmann et al. 2001). G216 could produce a Taurus-like region in 3 million years. The CS emission in G216 exhibits lower brightness temperatures and slightly lower linewidths than those typically exhibited by star forming dense cores in GMCs (Lee et al. 1994, Williams & Blitz 1998). Lee et al. (1994) suggested that the G216 cores are similar to those in Taurus; however, a direct comparison of the dense gas is complicated by the low spatial resolution (0.6 pc) of the G216 CS () map. We defer this analysis to a future paper using existing multi-transition CS data.
5 Summary
We present the first detection of ongoing star formation in the main body of G216, otherwise known as Maddalena’s cloud or the Maddalena-Thaddeus cloud. We identify 33 protostars (6.2 of which are expected to be contamination) and 41 young stars with disks (7.5 of which are expected to be contamination). This demonstrates that G216 is not quiescent, but forming young stars at an approximate rate of 60 stars per million years. The most luminous pre-main sequence stars have near-IR luminosities similar to Herbig Ae stars, consistent with the lack of massive star formation in the cloud inferred from IRAS far-IR maps. The star formation is concentrated in a 10 pc long molecular ridge detected in CS () observations. The density of star formation is much lower than that found in more active GMCs such as Orion GMCs, and is similar that in the Taurus dark clouds. This may result from the presence of less dense gas and smaller dense cores compared to active star forming regions such as Orion. Future work should concentrate on detailed comparisons of the molecular cores of G216 with those in Taurus, Orion and other molecular clouds, with the goal of understanding how the properties of the gas determines the rate and density of star formation.


References
- Allen et al. (2007) Allen, L., Megeath, S. T., Gutermuth, R., Myers, P. C., Wolk, S., Adams, F. C., Muzerolle, J., Young, E., & Pipher, J. L. 2007, in Protostars and Planets V, ed. B. Reipurth, D. Jewitt, & K. Keil, 361–376
- Allen et al. (2004) Allen, L. E., Calvet, N., D’Alessio, P., Merin, B., Hartmann, L., Megeath, S. T., Gutermuth, R. A., Muzerolle, J., Pipher, J. L., Myers, P. C., & Fazio, G. G. 2004, ApJS, 154, 363
- Baraffe et al. (1998) Baraffe, I., Chabrier, G., Allard, F., & Hauschildt, P. H. 1998, AA, 337, 403
- Casertano & Hut (1985) Casertano, S., & Hut, P. 1985, ApJ, 298, 80
- Engelbracht et al. (2007) Engelbracht, C. W., Blaylock, M., Su, K. Y. L., Rho, J., Rieke, G. H., Muzerolle, J., Padgett, D. L., Hines, D. C., Gordon, K. D., Fadda, D., Noriega-Crespo, A., Kelly, D. M., Latter, W. B., Hinz, J. L., Misselt, K. A., Morrison, J. E., Stansberry, J. A., Shupe, D. L., Stolovy, S., Wheaton, W. A., Young, E. T., Neugebauer, G., Wachter, S., Pérez-González, P. G., Frayer, D. T., & Marleau, F. R. 2007, PASP, 119, 994
- Fazio et al. (2004) Fazio, G. G., Hora, J. L., Allen, L. E., Ashby, M. L. N., Barmby, P., Deutsch, L. K., Huang, J.-S., Kleiner, S., Marengo, M., Megeath, S. T., Melnick, G. J., Pahre, M. A., Patten, B. M., Polizotti, J., Smith, H. A., Taylor, R. S., Wang, Z., Willner, S. P., Hoffmann, W. F., Pipher, J. L., Forrest, W. J., McMurty, C. W., McCreight, C. R., McKelvey, M. E., McMurray, R. E., Koch, D. G., Moseley, S. H., Arendt, R. G., Mentzell, J. E., Marx, C. T., Losch, P., Mayman, P., Eichhorn, W., Krebs, D., Jhabvala, M., Gezari, D. Y., Fixsen, D. J., Flores, J., Shakoorzadeh, K., Jungo, R., Hakun, C., Workman, L., Karpati, G., Kichak, R., Whitley, R., Mann, S., Tollestrup, E. V., Eisenhardt, P., Stern, D., Gorjian, V., Bhattacharya, B., Carey, S., Nelson, B. O., Glaccum, W. J., Lacy, M., Lowrance, P. J., Laine, S., Reach, W. T., Stauffer, J. A., Surace, J. A., Wilson, G., Wright, E. L., Hoffman, A., Domingo, G., & Cohen, M. 2004, ApJS, 154, 10
- Flaherty et al. (2007) Flaherty, K. M., Pipher, J. L., Megeath, S. T., Winston, E. M., Gutermuth, R. A., Muzerolle, J., Allen, L. E., & Fazio, G. G. 2007, ApJ, 663, 1069
- Gordon et al. (2007) Gordon, K. D., Engelbracht, C. W., Fadda, D., Stansberry, J., Wachter, S., Frayer, D. T., Rieke, G., Noriega-Crespo, A., Latter, W. B., Young, E., Neugebauer, G., Balog, Z., Beeman, J. W., Dole, H., Egami, E., Haller, E. E., Hines, D., Kelly, D., Marleau, F., Misselt, K., Morrison, J., Pérez-González, P., Rho, J., & Wheaton, W. A. 2007, PASP, 119, 1019
- Gordon et al. (2005) Gordon, K. D., Rieke, G. H., Engelbracht, C. W., Muzerolle, J., Stansberry, J. A., Misselt, K. A., Morrison, J. E., Cadien, J., Young, E. T., Dole, H., Kelly, D. M., Alonso-Herrero, A., Egami, E., Su, K. Y. L., Papovich, C., Smith, P. S., Hines, D. C., Rieke, M. J., Blaylock, M., Pérez-González, P. G., Le Floc’h, E., Hinz, J. L., Latter, W. B., Hesselroth, T., Frayer, D. T., Noriega-Crespo, A., Masci, F. J., Padgett, D. L., Smylie, M. P., & Haegel, N. M. 2005, PASP, 117, 503
- Greene et al. (1994) Greene, T. P., Wilking, B. A., Andre, P., Young, E. T., & Lada, C. J. 1994, ApJ, 434, 614
- Gutermuth et al. (2004) Gutermuth, R. A., Megeath, S. T., Muzerolle, J., Allen, L. E., Pipher, J. L., Myers, P. C., & Fazio, G. G. 2004, ApJS, 154, 374
- Gutermuth et al. (2005) Gutermuth, R. A., Megeath, S. T., Pipher, J. L., Williams, J. P., Allen, L. E., Myers, P. C., & Raines, S. N. 2005, ApJ, 632, 397
- Gutermuth et al. (2008) Gutermuth, R. A., Myers, P. C., Megeath, S. T., Allen, L. E., Pipher, J. L., Muzerolle, J., Porras, A., Winston, E., & Fazio, G. 2008, ApJ, 674, 336
- Hartmann et al. (2001) Hartmann, L., Ballesteros-Paredes, J., & Bergin, E. A. 2001, ApJ, 562, 852
- Hatchell et al. (2007) Hatchell, J., Fuller, G. A., Richer, J. S., Harries, T. J., & Ladd, E. F. 2007, AA, 468, 1009
- Henkel et al. (1994) Henkel, C., Whiteoak, J. B., & Mauersberger, R. 1994, AA, 284, 17
- Heyer et al. (2006) Heyer, M. H., Williams, J. P., & Brunt, C. M. 2006, ApJ, 643, 956
- Hillenbrand et al. (1992) Hillenbrand, L. A., Strom, S. E., Vrba, F. J., & Keene, J. 1992, ApJ, 397, 613
- Jijina et al. (1999) Jijina, J., Myers, P. C., & Adams, F. C. 1999, ApJS, 125, 161
- Landsman (1993) Landsman, W. B. 1993, in Astronomical Society of the Pacific Conference Series, Vol. 52, Astronomical Data Analysis Software and Systems II, ed. R. J. Hanisch, R. J. V. Brissenden, & J. Barnes, 246–+
- Lee et al. (1991) Lee, Y., Snell, R. L., & Dickman, R. L. 1991, ApJ, 379, 639
- Lee et al. (1994) —. 1994, ApJ, 432, 167
- Lee et al. (1996) —. 1996, ApJ, 472, 275
- Lonsdale et al. (2003) Lonsdale, C. J., Smith, H. E., Rowan-Robinson, M., Surace, J., Shupe, D., Xu, C., Oliver, S., Padgett, D., Fang, F., Conrow, T., Franceschini, A., Gautier, N., Griffin, M., Hacking, P., Masci, F., Morrison, G., O’Linger, J., Owen, F., Pérez-Fournon, I., Pierre, M., Puetter, R., Stacey, G., Castro, S., Polletta, M. d. C., Farrah, D., Jarrett, T., Frayer, D., Siana, B., Babbedge, T., Dye, S., Fox, M., Gonzalez-Solares, E., Salaman, M., Berta, S., Condon, J. J., Dole, H., & Serjeant, S. 2003, PASP, 115, 897
- Maddalena & Thaddeus (1985) Maddalena, R. J., & Thaddeus, P. 1985, ApJ, 294, 231
- Megeath et al. (2004) Megeath, S. T., Allen, L. E., Gutermuth, R. A., Pipher, J. L., Myers, P. C., Calvet, N., Hartmann, L., Muzerolle, J., & Fazio, G. G. 2004, ApJS, 154, 367
- Megeath et al. (2009) Megeath, S. T., Gutermuth, R. A., Muzerolle, J., Allgaier, E., Allen, L. E., Hora, J., Flaherty, K., Hartmann, L., Myers, P. C., Pipher, J. L., Stauffer, J., Young, E., & G., F. G. 2009, in prep.
- Muzerolle et al. (2004) Muzerolle, J., Megeath, S. T., Gutermuth, R. A., Allen, L. E., Pipher, J. L., Hartmann, L., Gordon, K. D., Padgett, D. L., Noriega-Crespo, A., Myers, P. C., Fazio, G. G., Rieke, G. H., Young, E. T., Morrison, J. E., Hines, D. C., Su, K. Y. L., Engelbracht, C. W., & Misselt, K. A. 2004, ApJS, 154, 379
- Reach et al. (2005) Reach, W. T., Megeath, S. T., Cohen, M., Hora, J., Carey, S., Surace, J., Willner, S. P., Barmby, P., Wilson, G., Glaccum, W., Lowrance, P., Marengo, M., & Fazio, G. G. 2005, PASP, 117, 978
- Rieke et al. (2004) Rieke, G. H., Young, E. T., Engelbracht, C. W., Kelly, D. M., Low, F. J., Haller, E. E., Beeman, J. W., Gordon, K. D., Stansberry, J. A., Misselt, K. A., Cadien, J., Morrison, J. E., Rivlis, G., Latter, W. B., Noriega-Crespo, A., Padgett, D. L., Stapelfeldt, K. R., Hines, D. C., Egami, E., Muzerolle, J., Alonso-Herrero, A., Blaylock, M., Dole, H., Hinz, J. L., Le Floc’h, E., Papovich, C., Pérez-González, P. G., Smith, P. S., Su, K. Y. L., Bennett, L., Frayer, D. T., Henderson, D., Lu, N., Masci, F., Pesenson, M., Rebull, L., Rho, J., Keene, J., Stolovy, S., Wachter, S., Wheaton, W., Werner, M. W., & Richards, P. L. 2004, ApJS, 154, 25
- Rohlfs & Wilson (2004) Rohlfs, K., & Wilson, T. L. 2004, Tools of radio astronomy (Tools of radio astronomy, 4th rev. and enl. ed., by K. Rohlfs and T.L. Wilson. Berlin: Springer, 2004)
- Stern et al. (2005) Stern, D., Eisenhardt, P., Gorjian, V., Kochanek, C. S., Caldwell, N., Eisenstein, D., Brodwin, M., Brown, M. J. I., Cool, R., Dey, A., Green, P., Jannuzi, B. T., Murray, S. S., Pahre, M. A., & Willner, S. P. 2005, ApJ, 631, 163
- Ungerechts & Thaddeus (1987) Ungerechts, H., & Thaddeus, P. 1987, ApJS, 63, 645
- Williams & Blitz (1998) Williams, J. P., & Blitz, L. 1998, ApJ, 494, 657
- Williams & Maddalena (1996) Williams, J. P., & Maddalena, R. J. 1996, ApJ, 464, 247
- Williams & McKee (1997) Williams, J. P., & McKee, C. F. 1997, ApJ, 476, 166
- Wilson et al. (2005) Wilson, B. A., Dame, T. M., Masheder, M. R. W., & Thaddeus, P. 2005, AA, 430, 523
- Winston et al. (2007) Winston, E., Megeath, S. T., Wolk, S. J., Muzerolle, J., Gutermuth, R., Hora, J. L., Allen, L. E., Spitzbart, B., Myers, P., & Fazio, G. G. 2007, ApJ, 669, 493