The nature of late-type spiral galaxies: structural parameters, optical and near-infrared colour profiles, and dust extinction
Abstract
We analyse and -band surface photometry of a sample of 18 Sb-Sd galaxies. Combining high resolution HST images with ground-based NIR observations, we extract photometric profiles, which cover the whole disk and provide the highest possible resolution. This is the first photometric study of late-type spirals for which the stellar kinematics have been measured. For 10 out of the 18 galaxies, HST data in both F160W () and F606W () are available, and, for those, we present colour maps and radial colour profiles at the resolution of the Hubble Space Telescope.
Colours vary significantly from galaxy to galaxy, but tend to be highly homogeneous within each galaxy, with smooth and flat colour profiles. Some of the colour maps show jumps in the inner regions, likely due to dust. We determine extinction-maps in an almost model-independent way using the colour map and the SAURON Mg b absorption line map of Ganda et al. (2007). The maps show that AV ranges from 0 to 2 mag, in the center from 0 to 1.5 mag, in agreement with the models of Tuffs et al. (2004).
We describe the surface brightness profiles as the superposition of an exponential disk and a Sérsic bulge. The bulges are small (0.1-2.5 kpc), and show a shape parameter ranging from 0.7 to 3, with a mean value smaller than two: well below the value for the classical de Vaucouleurs bulges. Most galaxies (16 out of 18) show a central light excess above the Sérsic fit to the bulge, which can be interpreted as a nuclear cluster, as shown by previous studies. We provide zero-order estimates for the magnitude of these components. We discuss the correlations among the structural galaxy parameters and with other relevant quantities such as Hubble type and stellar velocity dispersion. We compare these results with a recent paper by Graham & Worley (2008), who present a summary of most of the near-IR surface photometry of spirals in the literature. For both early and late type spirals, bulge luminosity strongly correlates with central velocity dispersion; at constant velocity dispersion, later-type bulges are larger and less dense, and have lower Sérsic values.
keywords:
galaxies: bulges - galaxies: evolution - galaxies: formation - galaxies: photometry - galaxies: spiral - galaxies: structure1 INTRODUCTION
It has been known for many years that the inner regions of spiral galaxies are fundamentally different from their outer parts. The inner parts are generally rounder, redder, and show a higher fraction of random vs. ordered motion. Images of spirals show that less star formation is present in the central regions. Radial surface brightness profiles can be fitted well by a large exponential disk and a central, steeper component (e.g., Kent 1984). When looking at the stellar kinematics, one finds that v/ in the inner parts is much lower than in the outer parts, where the rotation velocity is high and the stellar dispersion low (e.g., Noordermeer 2006). As a result, people traditionally viewed spiral galaxies as a combination of a flattened disk and a spheroidal central component called ‘bulge’, which are assumed to be physically and dynamically different: in this picture, the disk component is rotationally supported against gravity, and the bulge is a hotter system, similar to an elliptical galaxy. To understand how spiral galaxies are built, one generally does a bulge-disk decomposition and studies the parameters of both components. If one wants to go into more details, one can go one step further, and also study possible components such as bars, spiral arms, rings, and inner disks (see for example de Jong 1996a, Prieto et al. 2001 and Erwin & Sparke 2002).
When doing the bulge-disk decomposition, it is imperative that the decomposition is well-defined. The bulge-disk decomposition can be based e.g. on the surface brighteness profile (photometric decomposition), the stellar kinematics (kinematic decomposition) or on the two-dimensional axis ratio (morphological definition) (see Peletier 2008). The physical interpretation of the resulting parameters then depends strongly on the definition. Up to now most B/D decompositions have used the photometric decomposition, using a one-dimensional azimuthally averaged surface brightness profile. Such profiles can generally be fitted well by an exponential disk and a central Sérsic r1/n distribution (Andredakis, Peletier & Balcells 1995, Graham 2001). The Sérsic index has been found to correlate with the morphological type of the galaxy, and generally ranges between 1 and 4. For a comprehensive review about the Sérsic index see Graham & Driver (2005). In recent years it has been discovered that the bulges with surface brightness profiles that are close to exponential (i.e. Sérsic index close to 1) are different from bulges with larger Sérsic indices, which resemble more elliptical galaxies. Bulges with exponential profiles appear to contain more dust, show more recent star formation, are more flattened and more rotationally supported (Kormendy 1992, Kormendy & Kennicutt 2004, Fisher & Drory 2008). These objects are called pseudo-bulges, but one might also call them central disks. For more detailed examples and references we refer the reader to the comprehensive review by Kormendy & Kennicutt (2004), which presents a complete summary of observational evidence for this kind of bulge and their formation via secular evolution: bulges could result from the evolution of disk dynamical instabilities. Numerical simulations seem in fact to suggest that the dissolution of bars inside the disks may trigger the formation of three-dimensional stellar structures with roughly exponential profiles (Pfenniger & Norman 1990, Combes et al. 1990, Raha et al. 1991, Norman, Sellwood, Hasan 1996). It is also known that these processes are more effective in late-type galaxies rather than in early-types, despite the fact that there are examples of pseudobulges in Sa and even S0 galaxies (Erwin et al 2003, Kormendy & Kennicutt 2004). In this paper, we will also adopt the photometric bulge-disk decomposition.
Our purpose in this paper is to investigate the nature and interconnection of disks and bulges in a class of rather poorly studied objects: late-type spiral galaxies, full of dust and star forming regions, and characterised by relatively low-surface brightness; in the last years, galaxies towards the end of the Hubble sequence have been the target for a number of HST-based imaging surveys (Carollo et al. 1997, Carollo & Stiavelli 1998, Carollo, Stiavelli & Mack 1998, Carollo 1999, Carollo et al. 2002, Böker et al. 2002, Laine et al. 2002) which revealed the presence of a variety of structures in their inner regions: bulges, nuclear star clusters, stellar disks, small bars, double bars, star forming rings, whose formation and evolutionary patterns are not properly understood yet. Because of the extinction, a photometric analysis based on near-infrared data gives more reliable results ( is roughly a factor 8 lower than : Rieke & Lebofsky 1985). Another advantage of working in the NIR is that the NIR light is much less affected by recent episodes of star formation than optical light, and traces the old stellar populations hosting most of the luminous mass of galaxies. For the analysis of HST-NICMOS data the problem is, however, that the field of view is very small (about 20′′ 20′′ for NIC2, so that an accurate determination of the sky background is very difficult. Here we use data from the 2MASS survey to solve this problem.
The sample that we study here is special, in that accurate stellar kinematic maps, stellar absorption line maps of a few strong lines, as well as emission line strengths of [OIII] and H have been determined, making it possible for us to study the relation between structural parameters and stellar populations, the behaviour of ionized gas and the stellar potential. These maps come from SAURON (Bacon et al. 2001) integral field spectroscopy. The stellar and gas kinematics has been published in Ganda et al. (2006), while the absorption line maps have been analyzed in Ganda et al. (2007). Our sample of late-type galaxies can be easily compared to the early-type spirals of the SAURON Survey (de Zeeuw et al. 2002), presented in Falcón-Barroso et al. (2006) and Peletier et al. (2007). The fact that kinematic parameters are available for this sample makes it possible to study the position of late-type spirals on the MBulge - relations, establishing in this way whether these bulges are similar in structure and formation to bulges of early-type spirals.
Given the renewed interest in the extinction in spiral galaxies (Driver et al. 2007, Graham & Worley 2008, hereinafter GW) we decided to use the unique property of this sample that the amount of extinction can be calculated by combining absorption line maps, which are basically independent of extinction, with broad band colour maps, such as the Mg b maps, which are affected by it. To do this, we determined high resolution maps for the 10 galaxies for which HST-F606W () images were available, in addition to F160W (). The combination of colour and line strength gives the colour excess EV-H in a model-independent way, which can easily be converted to AV. This method is in principle very powerful, but has not been applied much in the literature, because of the lack of well-calibrated line strength data.
The paper is structured as follows. Section 2 describes the sample selection; Section 3 the photometric profiles and the methods applied for their extraction; Section 4 the actual bulge-disk decomposition; Section 5 compares the photometry in the NIR with the optical band, and presents extinction maps; Section 6 investigates the correlations between the structural parameters and other galaxy properties; Section 7 addresses the frequent presence of inner additional components, and, finally, Section 8 summarizes the main results.
2 THE SAMPLE
The sample of galaxies on which we perform our bulge-disk decomposition is the
same for which we presented the two-dimensional kinematical maps from SAURON
integral-field spectroscopy in the paper by Ganda et al. (2006) and the line-strengths
maps in the paper by Ganda et al. (2007).
The galaxies were optically
selected ( 12.5, according to the values given in de Vaucouleurs et al. 1991,
hereafter RC3) with HST imaging available from WFPC2 and/or NICMOS. Their
morphological type ranges between Sb and Sd, following the classification given
in NED (from the RC3). Galaxies in close interaction and Seyferts were
discarded. The resulting sample contains 18 nearby galaxies, whose properties
are listed and illustrated respectively in Table 1 and Fig. 1 in Ganda et al. (2006).
3 PHOTOMETRIC PROFILES
3.1 Datasets used
We constructed surface brightness profiles for all galaxies combining datasets with different spatial resolution and field of view. We started from the band images from the Two-Micron All Sky Survey (hereafter, 2MASS). Since these data do not have a sufficient spatial resolution for our purposes (2-3′′; the pixel scale of the 2MASS images retrieved from the archive is 1″), we complemented the photometric profiles extracted from the 2MASS images with profiles extracted from NIR HST images (F160W), available for 11 out of 18 cases (marked with a single or double dagger in Table 1). To improve the spatial resolution at small radii for the remaining galaxies we used optical HST images (F814W, corresponding to the band). Since, on the other hand, 2MASS is rather shallow (reliable profiles can be extracted out to 5 - 8 kpc for most of our galaxies), we needed an additional dataset for the outer parts, so that the disk geometry could be determined unambiguously, and an accurate sky level could be determined. For this reason, we decided to complement the profiles also with profiles extracted from infrared111We used POSS-II Near-IR IVN+RG9 images, obtained from http://archive.stsci.edu/cgi-bin/dss_form/; the selected filter is close to the band. images from the Digitized Sky Survey (hereafter, DSS), which are very deep, and therefore radially very extended. This also allows us a more accurate determination of the sky background. The DSS, 2MASS and NICMOS images downloaded from the archives were fully reduced, so we did not apply any further processing; as for the WFPC2-F814W images, we first created a mosaic from the four chips in order to maximize the field of view, using the IRAF task WMOSAIC in the STSDAS.HST_CALIB.WFPC package, rotated the resulting image to orient it to North up-East left and performed cosmic rays removal, using the IRAF tasks CRREJ and LACOS_IM, created by Pieter van Dokkum and available via his website222http://www.astro.yale.edu/dokkum/lacosmic/.
3.2 Ellipse fitting
As a first step, we extracted the photometric profiles from the DSS images using
the IRAF task ELLIPSE in the STSDAS.ANALYSIS.ISOPHOTE
package, which fits elliptical isophotes to galaxy images, implementing the
method initially described by Kent (1983, 1984) and Jedrzejewski (1987).
We masked out bad pixels and foreground stars, but did
not exclude dust lanes and star forming regions from the fitting. We first
fitted ellipses to the images with the centre, position angle and ellipticity
left as free parameters. In this way we obtained profiles of the centre
coordinates; from these profiles we established the position of the centres,
kept fixed in the following steps. In case of ambiguity, the centre was
determined using isophotes at intermediate radii, since the very central ones
can be affected by dust obscuration, and, in the particular case of the DSS
images, by the seeing (or even by saturation of the images, in the worst cases).
We then fitted again ellipses
to the images with the centre fixed at the chosen position and ellipticity and
position angle free. From this second step we determined single values for the
geometric parameters. In many cases in the outer parts of the galaxies, outside
the nuclear region, the position angle and ellipticity converge to more or the
less constant values. In other cases the situation is more complicated,
especially for galaxies that are almost round, and there we picked the values
that looked more reasonable at a visual inspection of the shape of the isophotes
in the images.
| NGC | Type | MB | d | Scale | PA | PAlit | ||
|---|---|---|---|---|---|---|---|---|
| (1) | (2) | (3) | (4) | (5) | (6) | (7) | (8) | (9) |
| 488 | 3.0 | -21.71 | 32.1 | 156 | 5 | 0.23 | 15 | 0.260 |
| 628 | 5.0 | -20.29 | 9.8 | 47 | 25 | 0.19 | 25 | 0.088 |
| 772 | 3.0 | -22.23 | 35.6 | 173 | 126 | 0.34 | 130 | 0.411 |
| 864 | 5.0 | -20.54 | 21.8 | 106 | 26 | 0.32 | 20 | 0.241 |
| 1042 | 6.0 | -19.83 | 18.1 | 88 | 174 | 0.29 | 43 | 0.224 |
| 2805 | 7.0 | -20.75 | 28.2 | 137 | 125 | 0.24 | 125 | 0.241 |
| 2964 | 4.0 | -19.74 | 20.7 | 100 | 96 | 0.45 | 97 | 0.451 |
| 3346 | 6.0 | -18.89 | 18.9 | 92 | 100 | 0.16 | 111 | 0.129 |
| 3423 | 6.0 | -19.54 | 14.7 | 71 | 41 | 0.23 | 10 | 0.149 |
| 3949 | 4.0 | -19.60 | 14.6 | 71 | 122 | 0.36 | 120 | 0.425 |
| 4030 | 4.0 | -20.27 | 21.1 | 102 | 37 | 0.24 | 27 | 0.276 |
| 4102 | 3.0 | -19.38 | 15.5 | 75 | 42 | 0.445 | 38 | 0.425 |
| 4254 | 5.0 | -22.63 | 19.4 | 94 | 50 | 0.27 | 62 | 0.129 |
| 4487 | 6.0 | -19.12 | 14.7 | 71 | 77 | 0.37 | 75 | 0.324 |
| 4775 | 7.0 | -19.81 | 22.5 | 109 | 96 | 0.135 | 52 | 0.067 |
| 5585 | 7.0 | -18.32 | 8.2 | 40 | 38 | 0.36 | 30 | 0.354 |
| 5668 | 7.0 | -19.65 | 23.9 | 116 | 120 | 0.155 | 164 | 0.088 |
| 5678 | 3.0 | -21.30 | 31.3 | 152 | 5 | 0.475 | 5 | 0.51 |
Table 1 lists the position angles and ellipticities of our sample galaxies, together with some other basic data, and shows that in most cases the chosen values are very close to the values tabulated in the literature (mainly in the RC3); the cases which present the biggest discrepancies are actually galaxies almost face-on and/or very round, for which the errors on the geometric parameters are in any case big. Once we had determined the geometric parameters, using ELLIPSE again we measured the intensities at each radius with centre coordinates, position angle and ellipticities fixed for all ellipses. From the resulting photometric profiles we subtracted then a value for the sky background estimated on the outer parts of the images. Following this, we fitted ellipses to the 2MASS images, with all the geometric parameters (centre coordinates, position angle and ellipticity) free and determined the centre coordinates in the same way as done for the DSS images. And after this we measured the intensity profiles, fixing the centre coordinates to the values just determined and the position angle and ellipticity to the values determined on the basis of the DSS profiles and subtracted an estimated value for the sky brightness. An analogous procedure was repeated for the NICMOS images, when available, and for the WFPC2-F814W images, in the cases where NICMOS was missing (see Table 1).
3.3 Combining the profiles
At the end of this procedure, for each galaxy we combined the three photometric profiles, to get a single profile with the maximum radial extension and spatial resolution allowed by the data. To do this, we first combined the profiles extracted from the DSS and 2MASS images, aligning them at the 2MASS level, and transformed the resulting ‘ground-based’ profile to an absolute magnitude scale using the zero point calibration (the keyword MAGZP) of the 2MASS images. For the 11 galaxies with available NICMOS imaging, we first calibrated independently the NICMOS profile to the absolute (Vega) magnitude scale using the F160W zero points of 21.826 (plus a term taking into account the pixel scale)for the 10 galaxies with NIC2 data and 21.566 for NGC 5585, observed with NIC3, and then joined them with the calibrated ‘ground-based’ profiles; the quality of the matching of the two profiles gave us an indication of the quality of our estimation of the sky background in the HST image, which was then changed iteratively until a satisfactory result was obtained. For the remaining galaxies, we imposed as a photometric zero point to the HST profiles (F814W) the mean offset between the aperture magnitudes measured on the 2MASS and HST images in the radial range 7-12″, which depends on an estimate of the sky background level for the HST image; we then joined the HST and the calibrated ‘ground-based’ profiles, modifying our sky estimate for the HST image until a good match was obtained; given the fact that the field of view of WFPC2 is significantly larger than the one of NICMOS, this operation required much less careful fine-tuning than for the NICMOS profiles. At the end, calibrated global band profiles were obtained. We tested whether the use of WFPC2-F814W images in the cases where NICMOS is not available introduces significant additional errors: for several of the galaxies with available NICMOS imaging, we retrieved the F814W images and treated them in the way described above; the result is that the comparison between the final global profiles obtained this way and the ones obtained using NICMOS is acceptable, with differences below 0.1 mag outside the inner 15 and below 0.05 mag outside the inner 45. This means that we can be rather confident in using the F814W images for the inner regions, and that colour gradients are not very important.
4 BULGE-disk DECOMPOSITION
Fitting a parametric bulge and disk can be done directly on the 2-dimensional images, or on one-dimensional profiles, that have been obtained by averaging azimuthally in ellipses or circles. Although one-dimensional profiles suffer from loss of information due to projection, and produce larger degeneracies between bulge and disk parameters (de Jong (1996a)), two-dimensional fits are less robust, and degeneracies remain (Möllenhoff & Heidt 2001). On the basis of their simulations MacArthur et al. (2003) conclude that a full two-dimensional technique does not provide a significant improvement compared to one-dimensional methods in recovering the axysimmetric structural parameters. Based on this, we have chosen an approach that allows us not to have to assume the same shape of bulge and disk, but for which we do not have to apply a full two-dimensional fitting method, as we will explain in the following sections. Alternatively, we could have used a non-parametric fitting method, such as the method of Kent (1984), where two components are found with different axis ratios, but have not done this, because of the degeneracies that arise when choosing the axis ratios of these components.
4.1 Decomposing late-type spirals
We performed a non-simultaneous bulge-disk decomposition for our 18 galaxies, closely following the method described by (2006) and (2006) and previously introduced by Palunas & Williams (2000). In a few words, we fit an exponential law to the disk, marking the fitting range via a visual inspection of the profiles, choosing the part of the profile that is exponential without doubt; we build a model image of the disk and subtract it from the original images, obtaining ‘bulge images’ from which we extract the ‘bulge profiles’ that we then fit with a Sérsic law.
4.1.1 disk fitting
The first step in our bulge-disk decomposition is the estimation of the disk parameters by means of profile fitting. On the combined global profiles, measured as explained in Section 3, using a least-square algorithm we fitted an exponential light distribution (in mag arcsec-2):
| (1) |
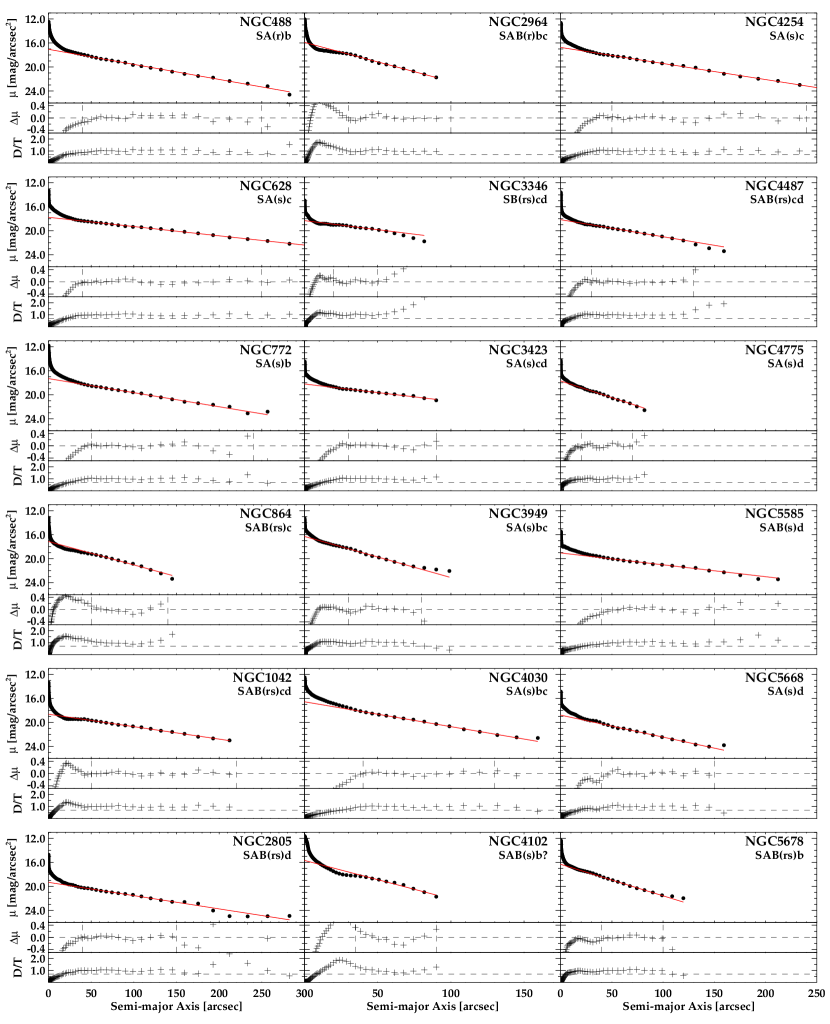
where and are the central surface brightness and scale length of the disk. The actual fit was performed on the profiles in absolute magnitudes and on radial ranges chosen by means of a visual inspection, in order to avoid the contamination from the central component (the ‘bulge’). The choice of a fitting range became a sort of ‘compromise’ in a few cases where the shape of the profile would have suggested the presence of a double disk (see Pohlen & Trujillo 2006). Fig. 1 shows the global galaxy profiles, together with the best-fitting exponentials, and the residuals from the fit. The radial ranges of the fits are indicated in the residual plot. These figures show that in general the fits are satisfying. NGC 4102 represents the case where the fit is worst; this might be due to contamination from the big bar, or from the coexistence of an inner and an outer disk (see also Pohlen & Trujillo 2006), to which we impose a single-exponential fit.
The fit parameters are listed in Table 2. No correction for inclination or galactic extinction is applied. The uncertainties of these parameters can be calculated in various ways. Often uncertainties in the least-squares fit are quoted. These are often very small, since galactic disks cane be fitted very well with an exponential surface brightness profile, if a limited radial fitting range is used (de Vaucouleurs 1959, Freeman 1970, MacArthur et al. 2003, Pohlen & Trujillo 2006). By changing the radial range, however, disk parameters can vary considerably. Therefore, a more realistic estimate of the uncertainties in surface brightness and scale length is obtained if one studies the variation of these parameters as a result of changing the fitting range. To do this, we varied both the inner and outer radial limit by steps of 5%, from 70% to 130% of the range quoted in Table 2. The final parameters disk are the average parameters obtained in this way, and the uncertainty the RMS scatter.
4.1.2 Bulge fitting
In all cases, in the innermost regions the galaxy’s light clearly exceeds the exponential fit to the disk. According to the photometric definition (see the Introduction), the region of the galaxy corresponding to this light excess is the bulge. We will adopt this definition, but without implications on the kinematics and/or populations: without implying that it has to be a hot and old component, similar to a small elliptical.
To quantify the region where the light from the bulge is significant, we established a bulge radial extension, defining as bulge the region within which the intensity ratio between the fitted exponential disk and the total intensity is lower than 0.7 (i.e. the bulge contributes to 30 percent or more of the total light, see Fig. 1 and Table 2). Note that these figures can be affected by the presence of bars or other asymmetric features not belonging to the exponential disk.
On the basis of the fitted disk parameters, using the standard IRAF tasks (BMODEL in the STSDAS.ANALYSIS.ISOPHOTE package) we built a model image of the disk and subtracted it from the original 2MASS images. We will refer to the residual images as the 2MASS ‘bulge image’. From these images we extracted the bulge photometric profiles and parameters, by applying a procedure similar to the one used to measure the ‘total’ profiles as explained in Section 3: we fitted ellipses to the bulge images in two steps, keeping in all cases the centre fixed to the value already determined for the original 2MASS images and the position angle fixed to the value determined from the DSS images in Section 3. At first, we left the ellipticity free; in a second step we fixed also the ellipticity and extracted the intensity profiles from the 2MASS bulge images, successively converting them to an absolute magnitude scale, applying the offset given by the keyword MAGZP in the 2MASS headers. As ellipticity for the bulge we adopted a representative value estimated within the bulge region, on the basis of the ellipticity profiles extracted from the 2MASS and HST images. We notice that bulge and disk ellipticities can be different. Fig. 2 presents a comparison between the adopted values for the ellipticities of disks and bulges, showing that for most of the galaxies the inner component is rounder than the disk; but in some cases (NGC 3346, 4487, 4775, 5668, among the latest-type objects in our sample), the bulge is instead flatter than the disk, as shown also by Fathi & Peletier (2003) on the basis of the bulge-disk decomposition of 70 disk galaxies spanning a range in type between S0 and Sm. Only NGC 3346 lies more than 1 above the 1:1 relation in Fig. 2.
Once the bulge and disk profiles have been retrieved, we need to determine the structural parameters by fitting a model profile. We follow the approach most often used in the current literature (see Graham & Worley 2008 for a comprehensive review) by fitting an exponential disk and a Sérsic bulge.
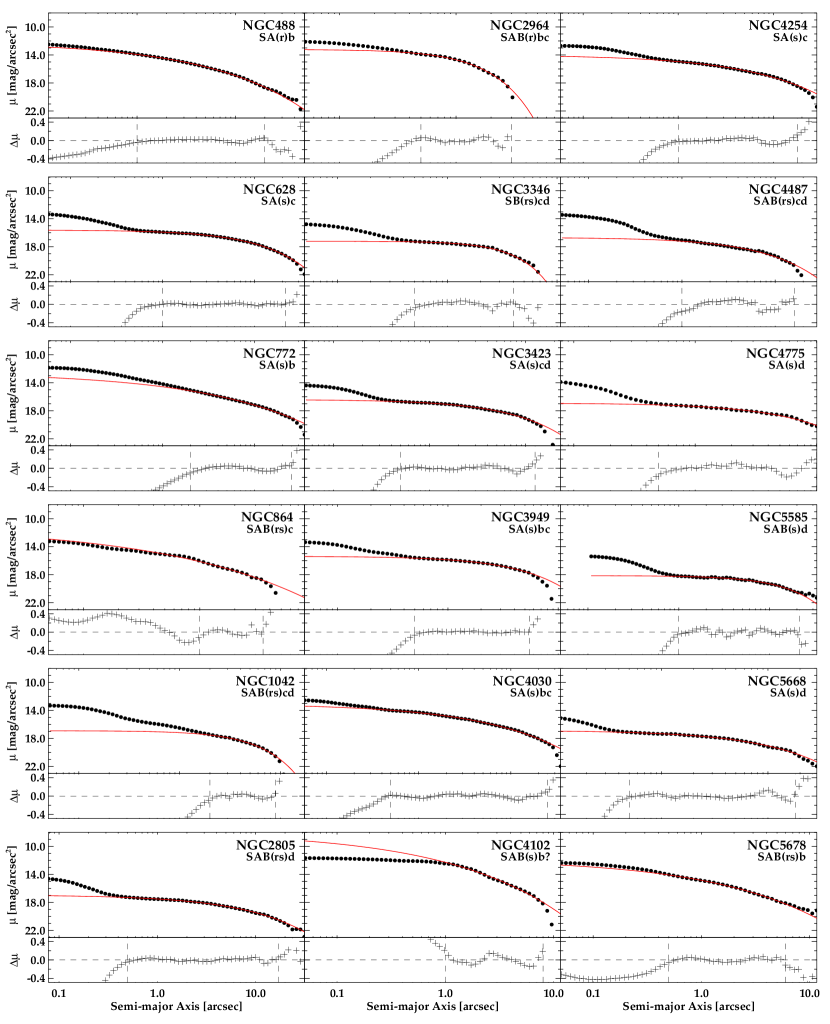
When fitting the profiles, seeing effects are particularly relevant when the effective radius is small and/or when the ratio between the effective radius and the FWHM of the seeing is small (, 2001). In fact, for small bulges poor seeing could smear the images so that bulges intrinsically described by 1 Sérsic profiles could appear like 1 profiles. Therefore, for a reliable treatment of the seeing effects, we performed the fit on the bulge region by convolving the Sérsic profiles with a Gaussian point-spread function, as explained by (2001), and then fitting the seeing-convolved Sérsic profiles using a standard non-linear least-squares algorithm. The values of the FWHM of seeing in the 2MASS images were retrieved from the header keyword SEESH via the relation FWHM(″) = 3.13 SEESH 0.46 as explained on the 2MASS webpage333www.sao.arizona.edu/FLWO/2mass/seesum.html. In some cases (e.g. NGC 864, 2964, 3346, 3949, 4775 and 5678) the bulge region is so small that it is comparable in size with the FWHM of seeing in the 2MASS images (less than 3 FWHM of the seeing), so that the applied procedure is not meaningful and possibly leads to imprecise fitting values. In order to face this problem, to gain spatial resolution in the inner parts, and to take advantage of data non contaminated by seeing effects, we perform the bulge fitting on bulge profiles extracted from the HST images (NICMOS or F814W, depending on availability). These profiles were obtained by subtracting from the HST images an exponential disk, modeled on the basis of the fit parameters obtained as described in Section 4.1.1, and then fitting to the residual images ellipses with position angle and ellipticity fixed to the ‘disk position angle’ and the ‘bulge ellipticity’, and centre coordinates fixed as well. Some of these ‘HST bulge profiles’ suffer from the complementary problem of limited spatial extension: in several cases they do not cover the full bulge region. In those cases (NGC 488, 628, 772, 4030, 4254, 4775, 5668) we joined them with the bulge profiles previously obtained from the 2MASS images. On these profiles we fitted a pure Sérsic law, excluding the very innermost parts (0.5-1″), which in several cases host nuclear star clusters. In Fig. 3 we show the HST or joined HST + 2MASS bulge profiles, along with the best-fitting Sérsic profile, and the residuals from the fit.


| NGC | rd,i | rd,o | h | rbu,i | rbu,o | Md | Mbul | |||||||||||||
|---|---|---|---|---|---|---|---|---|---|---|---|---|---|---|---|---|---|---|---|---|
| (1) | (2) | (3) | (4) | (5) | (6) | (7) | (8) | (9) | (10) | (11) | (12) | (13) | (14) | (15) | (16) | (17) | (18) | (19) | (20) | (21) |
| 488 | 40 | 250 | 17.03 | 0.07 | 42.7 | 1.1 | 1 | 20 | 16.54 | 8.5 | 1.98 | 16.92 | 0.11 | 9.9 | 0.6 | 2.41 | 0.13 | -25.70 | -23.77 | 0.05 |
| 628 | 40 | 250 | 17.75 | 0.03 | 70.7 | 1.1 | 1 | 21.5 | 17.70 | 10.9 | 1.20 | 17.92 | 0.01 | 12.3 | 0.1 | 1.23 | 0.01 | -23.50 | -20.31 | 0.01 |
| 772 | 50 | 240 | 17.35 | 0.06 | 47.1 | 1.2 | 2 | 25 | 18.52 | 20.1 | 3.66 | 18.37 | 0.62 | 19.0 | 6.4 | 2.9 | 0.8 | -25.82 | -24.07 | 0.25 |
| 864 | 50 | 140 | 17.13 | 0.30 | 28.1 | 2.7 | 1 | 4 | 16.66 | 1.7 | 0.71 | 17.01 | 0.21 | 1.6 | 0.2 | 1.9 | 1.6 | -23.85 | -18.78 | 0.42 |
| 1042 | 50 | 220 | 18.62 | 0.02 | 52.5 | 0.7 | 2 | 9 | 17.81 | 3.3 | 1.24 | 18.42 | 0.16 | 4.4 | 0.3 | 0.91 | 0.32 | -23.32 | -18.75 | 0.14 |
| 2805 | 40 | 150 | 19.36 | 0.06 | 50.8 | 1.8 | 0.5 | 17 | 19.99 | 13.4 | 1.60 | 19.93 | 0.08 | 13.0 | 0.7 | 1.55 | 0.06 | -23.46 | -20.84 | 0.05 |
| 2964 | 30 | 100 | 15.96 | 0.07 | 16.9 | 0.3 | 0.5 | 3 | 14.99 | 1.4 | 0.37 | 14.62 | 0.03 | 1.0 | 0.0 | 0.74 | 0.11 | -23.79 | -19.47 | 0.04 |
| 3346 | 20 | 50 | 18.28 | 0.14 | 35.4 | 4.5 | 0.5 | 4 | 18.85 | 3.5 | 0.81 | 18.51 | 0.38 | 3.2 | 1.3 | 0.78 | 0.22 | -22.90 | -17.99 | 0.35 |
| 3423 | 30 | 90 | 18.28 | 0.08 | 40.1 | 2.5 | 0.5 | 12.5 | 18.89 | 8.9 | 1.20 | 19.02 | 0.22 | 9.7 | 1.4 | 1.37 | 0.15 | -22.63 | -19.64 | 0.15 |
| 3949 | 30 | 80 | 16.48 | 0.29 | 16.8 | 1.6 | 0.5 | 5.5 | 17.03 | 4.0 | 0.61 | 17.41 | 0.18 | 4.6 | 0.6 | 1.10 | 0.14 | -22.51 | -19.52 | 0.13 |
| 4030 | 40 | 130 | 16.55 | 0.09 | 26.5 | 0.8 | 0.5 | 25 | 17.50 | 15.7 | 2.20 | 17.44 | 0.22 | 15.3 | 1.9 | 2.19 | 0.18 | -24.22 | -23.23 | 0.10 |
| 4102 | 35 | 90 | 16.03 | 0.45 | 19.5 | 3.1 | 1 | 8.5 | 14.12 | 2.8 | 1.31 | 12.99 | 0.62 | 1.5 | 0.4 | 2.5 | 1.3 | -23.40 | -22.00 | 0.25 |
| 4254 | 50 | 240 | 16.76 | 0.04 | 40.7 | 0.6 | 1 | 18 | 17.52 | 12.0 | 1.86 | 17.96 | 0.38 | 15.8 | 4.1 | 2.05 | 0.32 | -24.78 | -22.57 | 0.20 |
| 4487 | 30 | 130 | 18.07 | 0.12 | 36.8 | 2.4 | 1 | 10 | 19.76 | 14.5 | 1.37 | 19.48 | 0.60 | 10.6 | 3.4 | 1.52 | 0.52 | -22.64 | -19.41 | 0.30 |
| 4775 | 20 | 70 | 17.67 | 0.06 | 19.3 | 0.6 | 0.5 | 6.5 | 20.06 | 12.6 | 1.89 | 19.46 | 0.49 | 8.3 | 3.2 | 1.41 | 0.34 | -22.55 | -19.79 | 0.37 |
| 5585 | 40 | 150 | 19.00 | 0.09 | 53.2 | 2.9 | 1 | 21.5 | 19.97 | 16.0 | 1.24 | 19.98 | 0.14 | 15.7 | 1.5 | 1.03 | 0.09 | -21.26 | -18.33 | 0.10 |
| 5668 | 40 | 150 | 18.80 | 0.16 | 30.3 | 1.7 | 0.5 | 18 | 19.69 | 14.7 | 1.47 | 19.62 | 0.12 | 13.8 | 1.1 | 1.43 | 0.08 | -22.54 | -20.89 | 0.09 |
| 5678 | 40 | 100 | 16.34 | 0.25 | 20.9 | 1.7 | 0.5 | 6 | 19.27 | 3.1 | 1.26 | 16.66 | 0.18 | 3.1 | 0.3 | 2.43 | 0.31 | -24.78 | -21.42 | 0.08 |
The fit parameters for all galaxies, for both the disk and the bulge components, are listed in Table 2. Here we report the disk parameters from the exponential fit as in Section 4.1.1; for the bulge we quote the parameters from the seeing-convolved Sérsic fit to the 2MASS bulge profiles and those from the Sérsic fit to the HST or combined 2MASS-HST bulge profiles. No correction for inclination or galactic extinction is applied to the surface brightness (and magnitudes) values reported in the table. The uncertainties of the bulge parameters have been calculated in the same way as for the disk, i.e. by varying the fitting range by 30% for both the inner and outer boundary. Fig. 4 shows the comparison between the two sets of parameters for the bulge; the effective surface brightness and radius are generally rather similar, while the Sérsic parameter tends to be larger for the fits on the HST (or combined HST + 2MASS) profiles. In the following, for the bulge parameters we will refer to the output of the fit on these latter profiles. From the parameters we computed the total bulge and disk luminosities (see Graham 2001), and converted them to absolute magnitudes Md and Mb using the distance moduli used by Ganda et al. (2006). These numbers, together with the bulge to disk ratio, are also given in Table 2.
5 OPTICAL PHOTOMETRY AND OPTICAL NIR COLOURS
As we mentioned in the Introduction and as we witnessed throughout this work, late-type galaxies are known to be dusty objects, with dust lanes and structures extending often all the way to the centre (Frogel 1985, Zaritsky, Rix & Rieke 1993, Martini et al. 2003). For example we just mentioned in the previous section that dust makes it sometimes difficult to investigate the properties of tiny inner components. This is one of the reasons for which we decided to work in the near-infrared. In order to investigate the amount and distribution of extinction in the centers of these objects, we decided to analyse also optical images. Here, the fact that we have absorption line strength maps determined with SAURON offers a large advantage, when compared to previous work. Comparing optical-near infrared colours, affected by extinction, with absorption line index maps, which are almost not affected, we can obtain a reasonably accurate guess of the amount of extinction in the central regions of a representative sample of late type spirals. There are 13 galaxies for which F606W HST images are available in the HST archive. For 10 of them, also NICMOS F160W images are available. We decided to analyse these 10 galaxies.
5.1 Optical – Near-infrared colour profiles
We analyzed the optical images in the same way as the NIR ones, with the exception that here we used the POSS-II Red IIIaF + RG610 images in the outer parts: using the IRAF task ELLIPSE we first extracted from the DSS images photometric profiles with centres and geometric parameters free and determined the centres coordinates; we then fixed the centres and extracted again profiles with free ellipticities and position angles. In many cases in the outer parts the geometric parameters converge to a constant value; in the majority of cases this value is comparable with what found in the NIR: we did not detect any significant difference in the shape of isophotes between optical and near-infrared. Therefore, we fixed the position angle and ellipticity to the values determined on the NIR images (see Table 1) and measured the intensities along the ellipses. We then subtracted the sky background, estimated by averaging the mean values of intensity in several boxes placed in the outer parts of the images, and converted the profiles to a (uncalibrated) magnitude scale. For the HST F606W images, we started by creating mosaic images of the four chips, using the IRAF task WMOSAIC, rotated them to bring them to the standard orientation with North up-East left and extracted from them intensity profiles with centre, position angle and ellipticity fixed (fixed to the NIR values); we then subtracted an estimate for the sky background and converted the profiles to a (still uncalibrated) magnitude scale. Then we combined HST and DSS profiles into single profiles, aligning them at the level of the HST profiles; when a good matching of the two was not achieved, we modified the estimated sky brightness in the HST image, until the matching was satisfactory. The last step is the photometric calibration: converting the profiles to an absolute magnitude scale. We calibrated our profiles to the band of the UBVRI Johnson-Cousin system using the equations provided by Holtzman (1995), that were derived for single-chip images. To be able to apply those transformations, for each galaxy we focused on the single-chip image containing the galaxy centre (PC1 for all galaxies excluding NGC 1042 and 3949, centred instead on WF3) and extracted the single-chip profiles. The sky subtraction is in this case more difficult, since the field of view is significantly smaller: we proceeded in an iterative way, changing the estimated value of the sky background until the sky-subtracted single-chip profile matched the shape of the sky-subtracted profile retrieved from the mosaic image. We then calibrated the single-chip profiles applying Equation 9 in Holtzman (1995), using the coefficients listed in his Table 10:
| (2) |
where ‘’ is the number of counts in linear units, ‘’ the integration time on the image, ‘’ the pixel scale (arcsec pixel-1, 0.046 for the
galaxies centred on PC1 and 0.09944 for the two centred on WF3), the colour in the
Johnson-Cousins UBVRI system, 22.093 the photometric zero point tabulated by Holtzman (1995), equals 2.003 for frames where a gain of 14 was used, and 1 otherwise, and 0.1 is added, following the prescription of Holtzman (1995), in order
to correct for infinite aperture (see also the WFPC2 Data Handbook). For the () colours of our galaxies we used values from
HyperLeda and, when not
available, an average of the values for galaxies of the same Hubble type. Since the colour term is relatively small, there is no need for extremely accurate values here. The adopted values are listed in Table 4. The last step was to find and apply the vertical
offset necessary to align the HST(mosaic) + DSS joined profiles to the calibrated single-chip profiles.
| NGC | NGC | ||
|---|---|---|---|
| 488 | 1.16 | 3949 | 0.81 |
| 628 | 1.38 | 4030 | 1.20 |
| 864 | 1.28 | 4102 | 1.23 |
| 2964 | 1.28 | 5585 | 0.88 |
| 3949 | 0.81 | 5678 | 1.19 |
Four of the galaxies for which we perform our optical analysis (NGC 1042, 3423, 4030 and 4102) belong also to the sample
studied by Pohlen & Trujillo (2006), who present SDSS and profiles (roughly corresponding to and bands) for 90 almost face-on
late-type galaxies. The authors kindly provided us their profiles for the galaxies in common. In their profiles we recognize all the
features that we see in ours, at the same radii, out to 150 - 200″ (depending on the galaxy): the profiles are
completely consistent, with the caveat that they are measured in different bands.
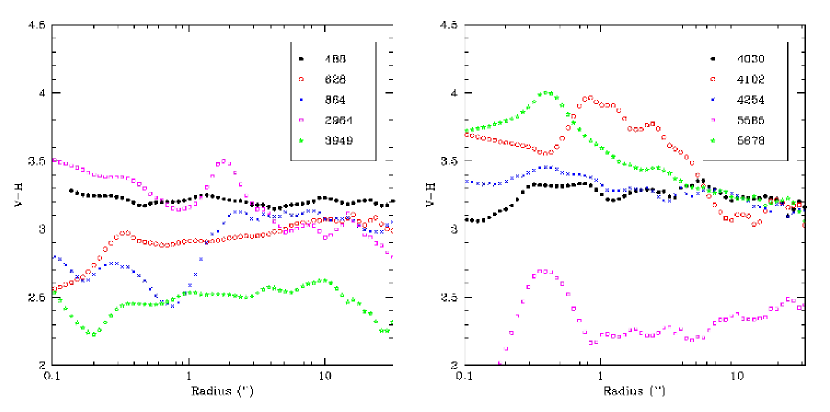
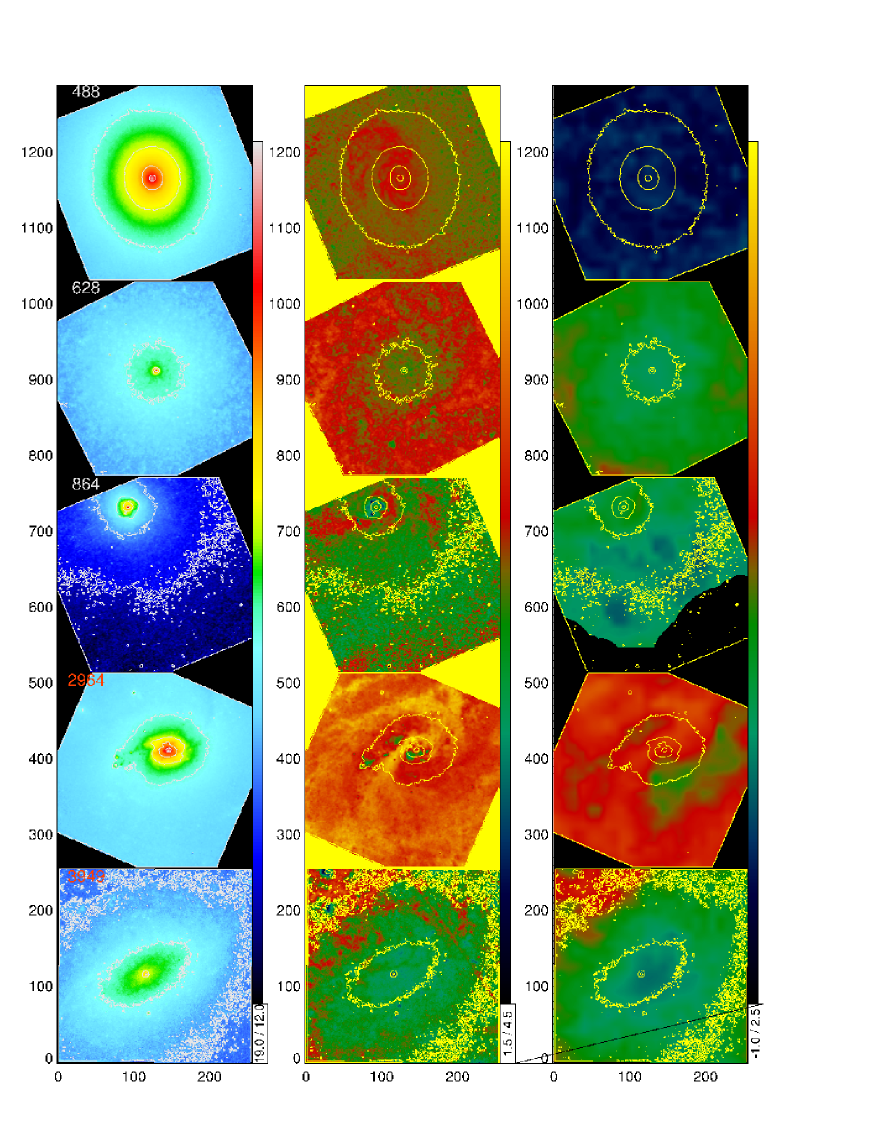
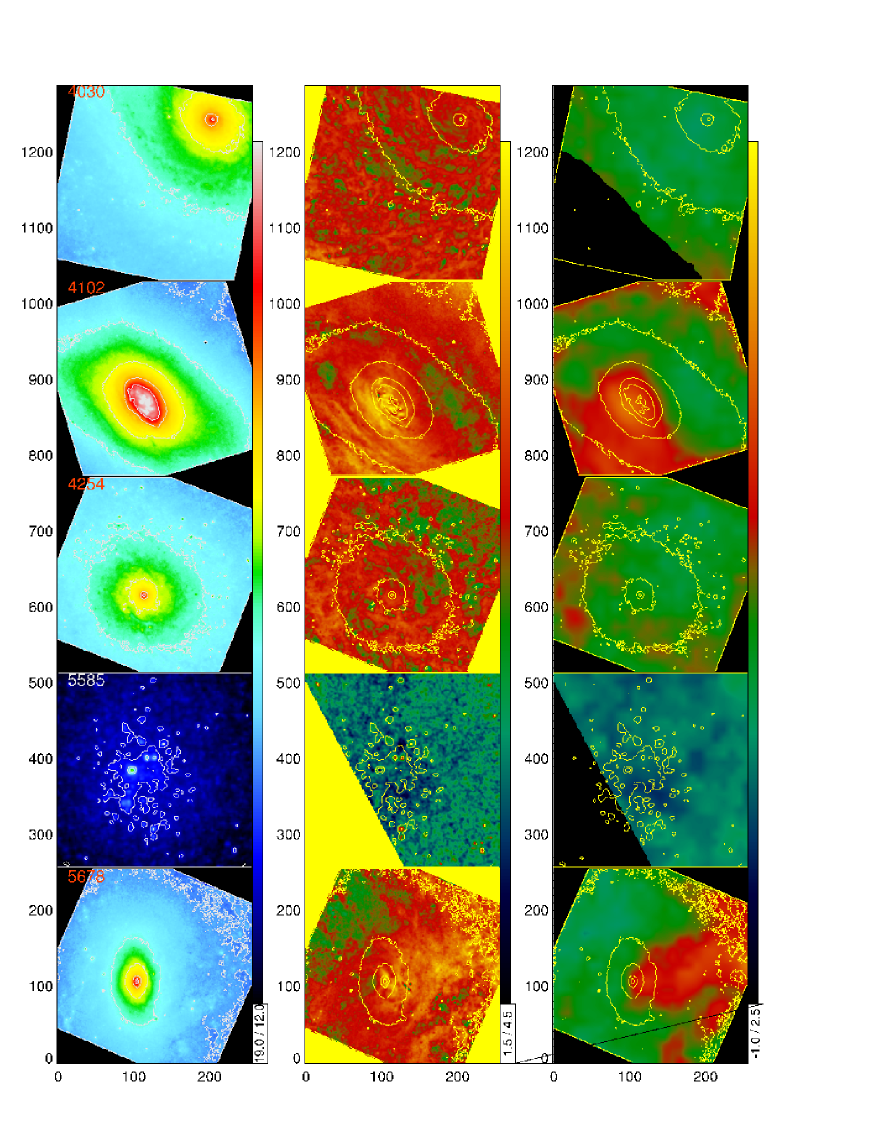
From the thus obtained and profiles we determined radial colour profiles, that we present in Fig. 6. Here we only present the inner 20′′, since real near-infrared imaging is only available in this region. Further out, the 2MASS images are not deep enough. We find that the profiles have large dispersions in colour, and a wide variety in slope. Some galaxies become redder, some bluer as a function of radius. When comparing them to elliptical galaxies (e.g. Peletier, Valentijn & Jameson 1990) the profiles are much less smooth, and the gradients much larger. The colour maps are very instructive in telling us what is happening. Fig. 7a and 7b show the calibrated colour maps of the inner 20′′ 20′′ of the galaxies. They have been displayed on the same scale, to make it easier to make the comparison from galaxy to galaxy, and to compare the internal gradients with the colour differences from galaxy to galaxy. The colour maps show dust lanes in all galaxies except for NGC 5585, spiral arms with younger stars, inner spirals, nuclear clusters, etc. In most cases it is not easy to find out where the galaxy center is, when just looking at the colour map.
5.2 Extinction in the centers of late-type spiral galaxies
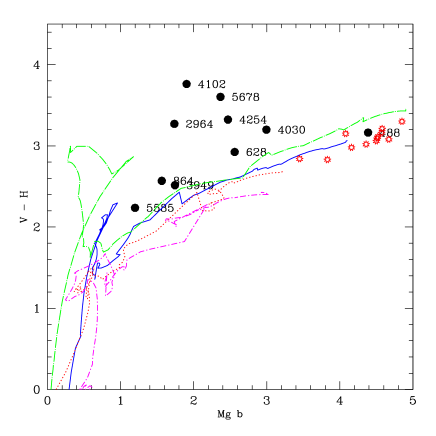
From a map alone it is very difficult to determine the amount of extinction EV-H. The problems is that the intrinsic colour of the stars is unknown, so that the uncertainty in the colour of the stars is reflected in the uncertainty in the amount of extinction. Having two colours does not help very much, since the effects of reddening in colour-colour diagrams is almost parallel to the effect due to changing metallicity or age (e.g. Kuchinski et al. 1998), and since the distribution of the dust changes the relative extinction in the different bands. Determining the amount of extinction in a specific galaxy is therefore done assuming a certain colour for the stellar populations (see e.g. Knapen et al. 1995), using the Balmer decrement for ionised gas (which usually gives the extinction on the lineof sight to an HII region, but not in the whole galaxy), or using statistical methods. For example, from the distribution of colour as a function of inclination one can derive the amount of extinction (e.g. Tully et al. 1998, Giovanelli et al. 1995, Peletier et al. 1995). The SAURON dataset offers the nice advantage that absorption line indices are available in the inner 40′′ 30′′. Since to first order the Mg b index in a galaxy gives the same information as the colour (which is the metallicity for an old galaxy, see Fig. 6), and since Mg b is affected very little by extinction (MacArthur 2005), one can use the and Mg b together to determine the amount of extinction at every position where both are available. Here we use the central Mg b measurements of Ganda et al. (2007) to calculate the extinction in the central aperture with diameter 2.4′′. In Fig. 6 these central values are shown. The figure shows that the models with various metallicities almost fall on top of each other. This means that one can measure the extinction by measuring the distance in to a line of models with a given reference metallicity. Since most of the galaxies have luminosities similar to the Milky Way, we take the solar models as a reference. For NGC 5585, which is fainter, it is probably more appropriate to take a lower metallicity. The uncertainty in the amount of extinction is then given by the uncertainty in the of the stellar populations in the galaxy that make up the Mg b. From the dispersion between the SSP models we estimate that this uncertainty is about 0.2 mag or less, even if the stellar populations consist of a mix of ages, since more complicated models are always linear combinations of SSPs. The obtained EV-H values are converted to AV using the Galactic extinction law (Rieke & Lebofsky 1985), dividing them by 0.825. Here the assumption is made that the galaxies are not optically thick in . Given the extinction values that are obtained, this assumption is easily satisfied. Table 4 shows the extinction values we derived. We find an average EV-H of 0.56 mag, or a lower limit to the average extinction AV=0.68 mag. In Fig. 7 the central extinction maps, determined in this way, at the SAURON resolution, are shown.
| NGC | EV-H | AV | NGC | EV-H | AV | ||
|---|---|---|---|---|---|---|---|
| 488 | 3.16 | 0.00 | 0.00 | 4030 | 3.20 | 0.47 | 0.57 |
| 628 | 2.92 | 0.33 | 0.40 | 4102 | 3.76 | 1.44 | 1.75 |
| 864 | 2.57 | 0.35 | 0.42 | 4254 | 3.32 | 0.74 | 0.90 |
| 2964 | 3.27 | 0.90 | 1.09 | 5585 | 2.24 | 0.22 | 0.27 |
| 3949 | 2.52 | 0.14 | 0.17 | 5678 | 3.60 | 1.05 | 1.27 |
Do we learn anything about the stellar populations from the colour? Figure 6 shows that we don’t. For some galaxies is redder than for the most massive giant ellipticals. Since the line indices of all objects are weaker than those of massive giant ellipticals, we have a strong indication that it is dust extinction, and not large numbers of very red stars, that causes the red colour. This argument is made stronger by the fact that for highly inclined galaxies optical-infrared colours in regions outside the dustlane always are bluer than those of giant ellipticals (Peletier & de Grijs 1998). The issue of the very red optical-infrared colours was already discussed in 1985 by Frogel, who found galaxies with colours that were considerably redder than those of the brightest giant ellipticals. He found also that half of his sample of Sc galaxies had colours that were bluer than the giant ellipticals. Although he could not uniquely determine the extinction, he used the following experiment. If all galaxies had an intrinsic stellar population colour of =0.65, he obtained extinction values between 0 and 1.64 mag in AV. The optical-infrared colours would not be redder any more than those of giant ellipticals, and also reasonable colours would be obtained. Independently, Turnrose (1976) had derived internal extinction by comparing simple stellar population models with observed optical stellar energy distributions, and had found similar extinction values. We have one galaxy in common with Frogel (1985), NGC 628, for which agrees within 0.1 mag.
Since these are all close to face-on galaxies, the measured extinctions are not very different from what one would see if they were face-on. The extinction correction to face-on is given by,
where a/b is the axis ratio of the galaxy, and a transparency index (Boselli & Gavazzi 1994). For this sample ranges from 0 to 0.26, while values for should be between 0.4 and 0.7 (Boselli & Gavazzi 1994), so that the face-on corrected AV is between 0 and 0.2 mag less than the value given in Table 4, sometimes still around or above 1 mag. This result is compatible with Tully et al. (1998), Peletier et al. (1995) and Giovanelli et al. (1995), who used a statistical method, deriving the extinction from the relation of colour, or surface brightness, as a function of inclination.
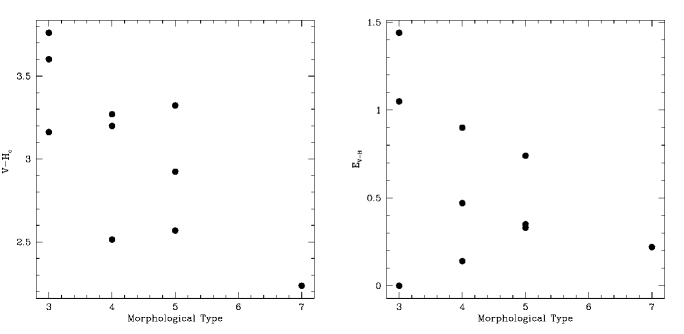
We now look at extinction as a function of morphological type. This is shown in Fig. 8. The relation is not very clear, but it can be understood when one looks at the outliers. The galaxy of morphological type 7 (Sd, NGC 5585) is by far the bluest, and the smallest and has little extinction. This is in agreement with Tully et al. (1998) who find that galaxies with MB=-18 have almost no extinction. At the other end, at morphological type 3=Sb, we find a galaxy with very little extinction, NGC 488, and two others with a lot of extinction. This can be understood by looking at Fig. 12 of Terndrup et al. (1994), where one can see that galaxies with type 3-5 have much more extinction than galaxies of earlier types. Peletier & Balcells (1996) confirm this, showing also that the extinction in galaxies of type 7 and larger is again much smaller than in galaxies of type 3-6. It looks as if NGC 488 is more similar to an Sab galaxy than an Sb in its inner regions. One should note that the AV values that we have derived here are still lower limits. For example, by adding very young stellar populations mixed with dust, one can still make the color of a galaxy bluer. For that reason, the conclusion that the center of NGC 3949 is almost dust free is most likely wrong looking at the structure in the colour map. Our derived extinction values for these late-type spirals are consistent with Tuffs et al. (2004), who use the models of Popescu et al. (2000) to determine the attenuation of dust in spirals using a thin and a normal disk with extinction, and a bulge without dust. We should note that this models has a very large optical depth () so that, according to the model, we basically only see the bulge light in front of the disk, as a result of which the integrated reddening is not so high, and the colours reasonable. With these data we are not able to verify whether this extinction model is realistic for late-type spirals.
Does the finding that many of our late-type galaxies have a considerable amount of extinction in their centre have other consequences? Martini et al. (2003), and Carollo et al. (2002) also show optical-infrared maps of similar galaxies, some of which are in common with us. They however do not show any calibrated color maps. To test the effects of extinction on the structural parameters, we also calculated the same parameters as presented in Section 5 in the -band. In general, the differences were small, something which could have been expected from the fact that for these galaxies the colour profiles are generally reasonably flat. Since there are many galaxies with large colour gradients (see e.g. Martini et al. 2003 and Carollo et al. 2002) we think it is preferable to determine these parameters in the NIR only.
Peletier & Balcells (1996) show that colours of bulges and disks of spirals, measured in relatively dust free regions, are very similar, implying that stellar populations in bulges and inner disks are similar. Terndrup et al. (1994) find the same effect, but with more scatter in the colours, and with a sample that includes redder galaxies. As we do here, they claim that these galaxies are red because of internal extinction. The fact that bulge and disk colours, even for these red galaxies, are similar shows that similar amounts of extinction are present in both components. If galaxies are seen close to face-on, i.e. when most of the light comes from regions close to the symmetry plane of the galaxy, the colors of bulge and inner disk region both are affected by similar amounts of extinction. Images of edge-on galaxies show that the extinction is mainly situated in the plane.
Carollo et al. (2001) present a study of colours in a sample of bulges, also from HST imaging. To convert from her colours to the Johnson system we use here we need to add 1.45 mag. By masking out patches of dust and star formation regions, they obtain colours that are blue enough that they can be explained by stellar population models, for both types of bulges discussed. However, the nuclei have often much redder colours, see their Fig. 3, that need considerable extinction. The problem with selecting clean regions by hand is that this method is subjective and probably not reproducible, giving results that are biased towards blue colours. The same is done in Carollo et al. (2007), where only one galaxy is found with optical-infrared colours redder than those of ellipticals and early-type bulges.
Dust can have important consequences for the interpretation of mass profiles from rotation curves and optical photometry. Without correcting for extinction, which is often impossible, the resulting stellar M/L ratios will be too large, and show a much larger scatter than is due purely by stellar populations. Since the dust extinction is largest in the central regions, and HI observations often have a limited angular resolution, the effect is most important when interpreting optical rotation curves. Palunas & Williams (2000) find that if they correct the surface brightness by the resulting M/L ratios do not vary any more as a function of inclination. In the -band the correction should be larger by a factor 1.5. Such corrections in general are not very meaningful, since extinction varies as a function of radius. If one wants to obtain accuracte M/L ratios in the centers of galaxies, one either has to work in the NIR only, or make detailed extinction corrections.
6 BULGE AND disk PARAMETERS
Here we study the structural parameters determined in the previous Section together with data from the literature.
We quantitatively investigate the structural parameters obtained from the bulge-disk decomposition as a function of various fundamental galaxy parameters, such as morphological type, central velocity dispersion, and luminosity, to obtain a better understanding of the formation of these galaxies. Only the most noteworthy relations are shown here; additional relations, including those between disk and bulge parameters, are shown in Appendix B.
We concentrate, in particular, on how late-type spiral galaxies differ from earlier types. We do this by comparing our galaxies with the large literature compilation of Graham & Worley (2008), and with the recent sample of Fisher & Drory (2008). Graham & Worley present a compilation of about 10 samples, mostly in the near-infrared. Fisher & Drory analyse a sample of HST data, mostly in the optical. For the relations with central velocity dispersion we compare with the sample of early-type galaxies of Balcells et al. (2007b), hereinafter B07. For the literature samples, we took the numerical values from the tables available in the published papers, adjusting the scale lengths and effective radii in order to homogenise the adopted value for the Hubble constant to = 70 km s-1 Mpc-1 (for consistency with what done by Ganda et al. 2006 and with the luminosities calculated in Section 4) . The total magnitudes (of bulge and disk) of Balcells et al. (2007b) were converted from to using the typical colour for disk galaxies mag (Frogel et al. 1978). For most of the relations that we will investigate and show graphically, we list in Table 5 the linear Pearson correlation coefficient , calculated for the galaxies of our sample only. For the strongest correlations, with , we performed an outliers-resistant linear fit, assuming a dependence of the form , and being the variables involved and and the fit parameters. Those fits, for which the parameters are given in Table 6, are discussed in detail below.
6.1 Trends among the structural parameters
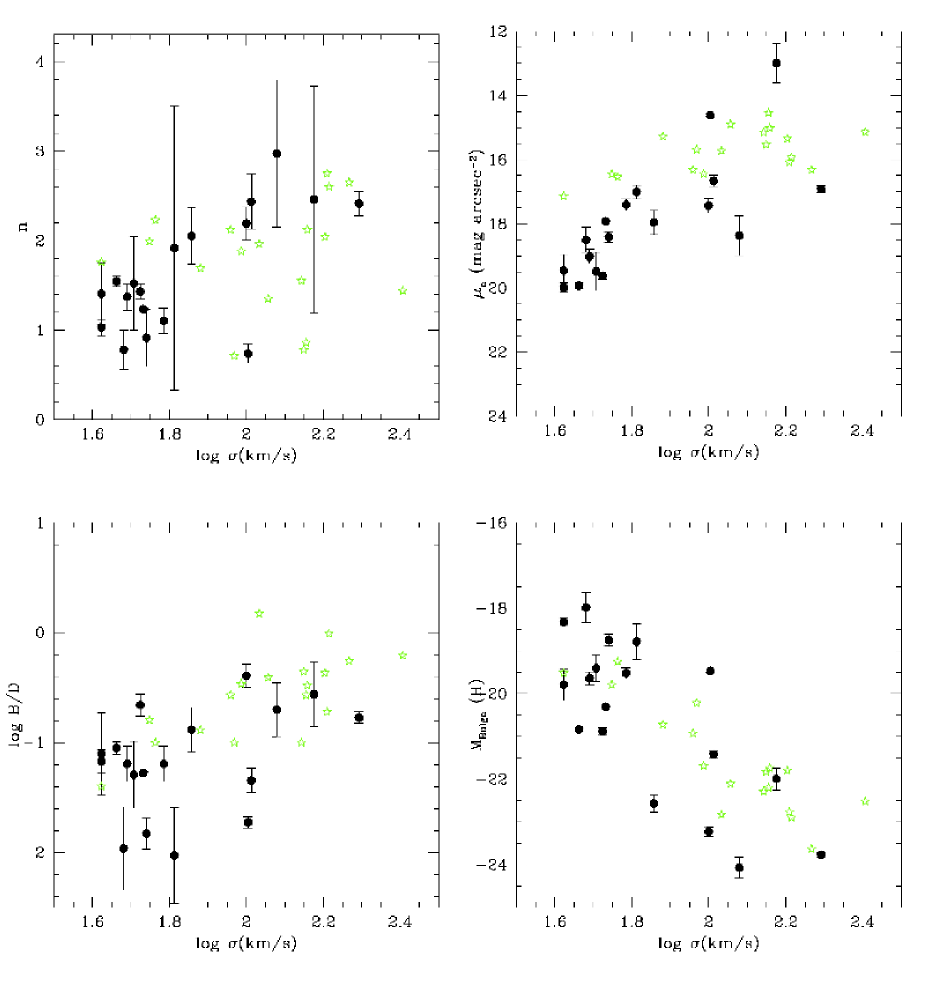
In Fig. 9 we show a number of structural parameter as a function of stellar velocity dispersion. Here one should note that due to the paucity of velocity dispersions in the literature we can only compare 2 samples of about 20 galaxies, of resp. early and late type spirals. There are some interesting things to note. Several papers, e.g. B07, Fisher & Drory (2008) and Graham & Worley (2008), show that the Sérsic index correlates reasonably well with bulge luminosity, with galaxy type and bulge to disk ratio, but with considerable scatter. Fig. 9a shows that the same holds for the central velocity dispersion . There are late-type spirals with velocity dispersions larger than 100 km/s, that show -values considerably larger than 1. If all bulges of late-type spiral galaxies would be disks (also called pseudo-bulges), their -values would be close to 1. This is however not the case, and it appears that the central velocity dispersion of the galaxy is determining the shape of the surface brightness profile of the bulge, rather than the galaxy type, which is determined more by the total star formation or the bulge to disk ratio, Consistent with this picture is the relation between bulge luminosity and central velocity dispersion. Already B07 found a tight relation between these 2 quantities for early-type spiral galaxies. Here we see that late-type spirals follow the same relation. So, even though the surface brightness of bulges of late-type spirals is lower than of early-type spirals, and the B/D ratio for a given velocity dispersion is lower as well (Fig. 9bc), the bulge luminosity - relation is the same for both samples of galaxies. Since there is a strong correlation between the bulge luminosity, or central surface brightness, or Sérsic index (Graham & Driver 2007), and black hole mass, a relation which also holds for the luminosity and black hole mass of elliptical galaxies and S0’s, it is tempting to assume that bulges of late-type spirals also lie on this relation, and that the formation of those bulges is closely linked to the black holes in late-type spirals. If a central black hole is associated with every bulge, it would also explain why the tight black hole mass vs. central velocity dispersion relation (Ferrarese & Merritt 2000, Gebhardt et al. 2000) can be reproduced with bulge luminosity replacing central velocity dispersion, but not with disk or total galaxy luminosity. The lack of correlation between the sizes of bulges and disk with central velocity dispersion for late type spirals might also be a result of the fact that bulges of late-type spirals are less concentrated objects with , which do not follow the homology of elliptical galaxies and elliptical-like bulges.
We also like to point out that it appears that bulges of early and late-type galaxies show systematic differences: on the average early type spirals with low central velocity dispersion have much more concentrated bulges and disks: not only are disks and bulges smaller, but also the surface brightness of both components is higher.
6.2 Trends with Stellar Populations
This sample is unique in the sense that its central stellar populations have been studied using stellar absorption lines, which are almost independent of extinction, by Ganda et al. (2007), so that we can investigate whether the stellar populations depend on the structural parameters discussed above. In other words, are the age and star formation history of a galaxy related to the way it is built, and viceversa? We try to address this issue by plotting the results of our bulge-disk decomposition against population parameters. A few noteworthy relations are discussed here. The rest of the relations are discussed in Appendix B.
Fig. 10 shows the Sérsic parameter and the disk central surface brightness and as a function of the central H absorption, a measure of the age of the galaxy, and the star formation time-scale . The stellar population parameters refer to a central aperture of radius 15. One sees that increases of decreasing H. This implies that for objects with relatively young stellar populations, bulges are exponential, and that old bulges are more similar to objects with a de Vaucouleurs distribution. This would be the case if the objects in which recently stars have formed are all disk-like, i.e. pseudobulges, and that old bulges are more spheroidal-like. The latter statement is very well applicable to bulges of early-type galaxies (e.g. Kormendy & Kennicutt 2004, Fisher & Drory 2008), but is not so obvious for late-type spirals. It implies that some late-type spirals have old bulges, that do not follow exponential distributions. Maybe our Milky Way galaxy has a bulge similar to those. We also see that decreases for increasing star formation time scale . Late-type spiral disks, like the disk of our Milky Way, have long star formation time scales. As a result, parameters such as H, which are strongly influenced by the last burst of star formation, generally show large values, indicative of the presence of young stellar populations. We find that galaxies with small star formation time scales, i.e. elliptical-like objects, have high -values. Interesting are also the correlations with disk scale length. If there are signs of younger populations in the center, or if the star formation time scale is long, then the disks are generally smaller. This effect is probably due to the fact that more massive galaxies generally are of earlier-type, having a shorter star formation time scale, and show older bulges.
6.3 Trends between structural parameters
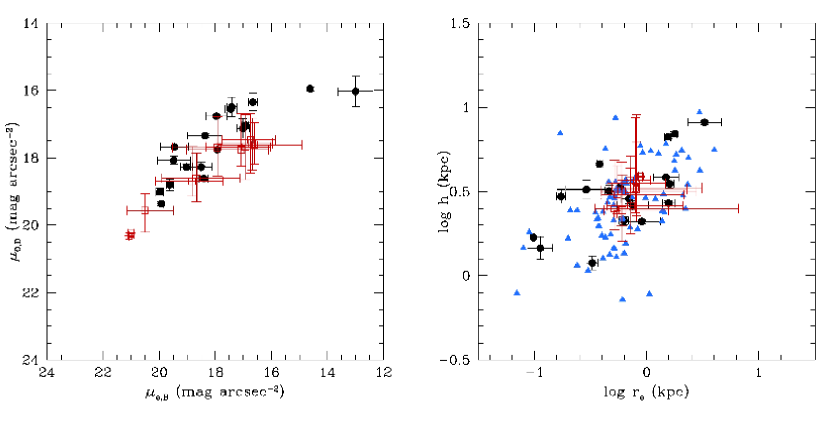
Coming to the relations among the structural parameters themselves, in Fig. 11 we plot the size and surface brightness of the bulges and disks of our galaxies against each other, and add the samples of GW and Fisher & Drory (2008) on the right: in the left panel we plot the central surface brightness of the disk against the effective surface brightness of the bulge; in the right one, disk scale length against bulge effective radius. We see a strong trend that galaxies with brighter disks harbour brighter bulges, and a tendency for galaxies with larger disks to have larger bulges (see before). The figure shows conclusively that bulge and disk are related, and that e.g. high surface brightness bulges do not co-exist with low surface brightness disks and vice-versa. The figure suggests that disks do not form without affecting the bulge. If a disk is formed in a galaxy which already contains a bulge, its size and surface brightness is either determined by the mass distribution of the bulge, or the bulge adapts itself, implying that stars are being formed in this process. The strong correlation between and seems to support the process of the formation of bulges through secular evolution of disks.
| x | y | x | y | ||
| (1) | (2) | (3) | (4) | (5) | (6) |
| T | -0.599 | 0.641 | |||
| T | 0.769 | -0.742 | |||
| T | 0.155 | 0.028 | |||
| T | 0.843 | -0.720 | |||
| T | 0.045 | 0.113 | |||
| T | /h | 0.150 | /h | -0.065 | |
| T | (B/D) | -0.256 | (B/D) | 0.416 | |
| Md | -0.679 | Mb | -0.705 | ||
| Md | 0.394 | Mb | 0.276 | ||
| Md | -0.297 | Mb | -0.567 | ||
| Md | 0.490 | Mb | 0.416 | ||
| Md | -0.555 | Mb | -0.414 | ||
| Md | /h | -0.022 | Mb | /h | -0.483 |
| Md | (B/D) | -0.260 | Mb | (B/D) | -0.794 |
| H | -0.681 | H | -0.532 | ||
| Mgb′ | 0.724 | Mgb′ | 0.759 | ||
| -0.678 | -0.633 | ||||
| MBulge | -0.756 | MBulge | T | 0.630 | |
| 0.866 | 0.693 | ||||
| -0.430 | -0.338 | ||||
| 0.285 | 0.231 | ||||
| /h | 0.143 | (B/D) | 0.440 |
| x | y | b | x | y | b | ||
|---|---|---|---|---|---|---|---|
| (1) | (2) | (3) | (4) | (5) | (6) | (7) | (8) |
| T | 3.104 | -0.287 | -2.654 | 2.332 | |||
| T | 14.644 | 0.688 | 30.036 | -6.628 | |||
| T | 14.346 | 0.623 | 24.903 | -4.017 | |||
| Md | -7.970 | -0.410 | Mb | -4.941 | -0.316 | ||
| Md | -2.045 | -0.108 | Mb | -2.936 | -0.133 | ||
| Mb | (B/D) | -5.292 | -0.200 | ||||
| H | 4.329 | -0.876 | H | 1.157 | -0.221 | ||
| Mgb′ | 0.353 | 14.966 | Mgb′ | 0.807 | 8.358 | ||
| 2.638 | -1.590 | 0.782 | -0.481 | ||||
| MBulge | 0.190 | -0.081 | MBulge | T | 15.442 | 0.506 | |
| 8.092 | 0.527 | 0.566 | 0.373 |

7 CENTRAL COMPONENTS
In recent years, several studies have shown that many spiral galaxies host in their innermost regions an extra component,
distinguishable in the images and/or photometric profiles as an excess light above the (exponential) disk plus (Sérsic)
bulge. Nuclei are common both in early- and late- type galaxies. Phillips et al. (1996) found unresolved bright nuclei in six
out of 10 late-type spirals; Matthews & Gallagher (1997) noticed a compact star cluster in the centres of 10 very late-type spirals,
within a program studying 49 objects; out of a sample of 77 Scd-Sm galaxies, Böker et al. (2002) detected a distinct component
in 59 cases. In some of the late-type spirals, these clusters are the only prominent source within a few kiloparsecs from
the centre. In earlier-types their detection is complicated by the presence of a luminous and extended bulge, but
Carollo et al. (1998) showed that nuclear clusters are present also there. As already mentioned, Balcells et al. (2007a) found a
central light excess in 90 percent of a sample of S0-Sbc galaxies using NICMOS imaging, detecting both unresolved and
extended sources; according to the authors, the extended inner components are geometrically flat systems and could be
inner disks, rings or bars; the unresolved ones are most likely star clusters and are found in more than one third of the
galaxies with inner component.
In our sample, two galaxies out of 18 (NGC 864 and NGC 4102) present a central
depression and the remaining 16 show a central light excess above the best-fit to the bulge; one of these (NGC 5678) is
an ambiguous case, possibly because of the very extended dust lanes affecting this galaxy, but we included it in the
‘central component’ group. The numbers are very similar to those of Balcells et al. (2007a). Out of these 16, eight belong to
the sample studied by Böker et al. (2002): all the Scd and Sd galaxies in our sample. The authors detect nuclear star
clusters in all of them and publish an estimate of their size and luminosity in the band.
| NGC | minner | Minner | |
|---|---|---|---|
| (1) | (2) | (3) | (4) |
| 488 | 14.10 | -18.44 | 3.196 |
| 628 | 16.27 | -13.68 | 2.644 |
| 772 | 14.30 | -18.46 | |
| 864 | 16.86 | -13.02 | 2.863 |
| 1042∗ | 15.93 | -15.35 | |
| 2805∗ | 17.74 | -14.51 | |
| 2964 | 15.45 | -16.12 | 3.496 |
| 3346∗ | 18.25 | -13.14 | |
| 3423∗ | 17.59 | -13.25 | |
| 3949 | 17.10 | -13.71 | 2.695 |
| 4030 | 16.19 | -15.42 | 3.027 |
| 4102 | 15.07 | -15.55 | 3.499 |
| 4254 | 15.60 | -15.84 | 3.271 |
| 4487∗ | 16.54 | -14.29 | |
| 4775∗ | 17.05 | -14.71 | |
| 5585∗ | 17.08 | -12.50 | 2.281 |
| 5668∗ | 17.81 | -14.08 | |
| 5678 | 15.77 | -16.71 | 3.657 |
For all the 16 galaxies, we built model images of the bulges on the basis of the fit parameters, and subtracted them from the HST ‘bulge images’ (NICMOS or WFPC2-F814W depending on the object). The images that we obtained contain by construction the residuals from the global (exponential) disk + (Sérsic) bulge fit to the galaxy: dust features, spiral structure, bars, and the inner component in which we are interested. We estimated the HWHM of the central component using the IRAF rimexam task, resulting in values ranging between 0.07 and 0.23″. We then calculated the flux enclosed in a circle of radius twice the HWHM and converted it to a magnitude scale ( band). For NGC 4102 and NGC 864 we calculated the flux by measuring all the light in the inner aperture of diameter 0.227′′. The computed magnitudes (both apparent and absolute) are listed in Table 7, where an asterisk marks the galaxies in common with the sample analysed by Böker et al. (2002). For all galaxies for which both HST F606W and F160W data are available, we also calculated the central colour in an aperture of diameter 0.227′′ (0.500′′ for NGC 5585), and also tabulated these in Table 7. Fig. 12 shows the comparison between the apparent magnitudes that we calculated and those published by Böker et al. (2002), for the inner component of the galaxies in common. The magnitudes of Böker et al. refer to the band, while our data are band data (see Table 4). The only galaxy in common with Böker et al. (2002) is NGC 5585, which is representative for the galaxies in this group, and clearly shows much less extinction in its color map. We also see that the colors of the nuclei are similar within 0.2 mag to the colors in the inner aperture with diameter 2.4′′ (). Even though only about 10% of the light in the larger aperture comes from the nuclear cluster, it shows that the stellar populations of the nuclear cluster are not decoupled from those in the rest of the galaxy, as is e.g. the case in globular clusters in galaxies.
Walcher et al. (2006) took high resolution spectra for a number of the Scd, Sd and Sm galaxies of Böker et al. (2002) and analysed them using stellar population synthesis, allowing the extinction to be fitted as a free parameter. They find an average extinction in of 0.4 mag, which is very comparable to what we find (AV = 0.68, with a scatter of 0.55): When using the Galactic extinction law (Rieke & Lebofsky 1985) the extinction in is 1.64 the extinction in , or 0.66 mag. Given the fact that the galaxies of Walcher et al. are later type than ours, we expect less extinction than in our sample. However, large variations probably exist from galaxy to galaxy, and also the amount of extinction that one obtains varies with method. We can only conclude that extinction is important in late-type galaxies. Note that NGC 1042, in common with our paper, has by far the largest extinction (AI = 1.35 mag), consistent with Figure 12.

8 SUMMARY AND CONCLUSIONS
In this Paper we performed a photometric bulge-disk decomposition for our sample of 18 late-type spiral galaxies. We used NIR ( band) archive images (DSS, 2MASS and HST) from which we retrieved photometric profiles covering the whole disk and having a high spatial resolution in the inner parts. We fitted an exponential disk and a Sérsic bulge, using a method that allows the two components to have different intrinsic shapes, but without going to a full two-dimensional fitting of the light distribution; we studied in detail the correlations between the fit parameters, and we investigated the high resolution colours in this sample, in the nuclear cluster and outside it. From the colour maps and the Mg b maps of Ganda et al. (2007) we made extinction maps for 10 of the galaxies. We summarize below the main results.
-
•
Late-type spirals can be fitted well by a model consisting of a Sérsic bulge, an exponential disk, and a nuclear light access. Outside the central regions, the bulk of the galaxy’s light is well described by one exponential disk, although in some cases a double exponential (inner + outer disk) would provide better fits, as tested by Pohlen & Trujillo (2006). In most cases bulges are rounder than their disks, but for the latest types the opposite sometimes holds, possibly in relation with the presence of a bar.
-
•
Bulges of late-type spiral galaxies follow the same relation between central velocity dispersion and bulge luminosity as bulges of early-type spirals. This might indicate that the black hole - sigma relation also holds for late-type spiral bulges. Late-type bulges have, however, lower surface brightness and are larger than early-type bulges.
-
•
The structural parameters of our bulges agree statistically with the large compilation of Graham & Worley (2008), showing a strong correlation between surface brightness of bulge and disk, and a less strong relation between bulge effective radius and disk scale length.
-
•
The star formation time scale inversely correlates with the Sérsic index , implying that exponential bulges have long star formation time scales, in agreement with the prediction from secular evolution models, that exponential bulges are disks forming through secular evolution.
-
•
In 16 out of 18 galaxies the galaxy’s profile presents an excess light with respect to the fitted disk + bulge, which can be interpreted as an additional tiny component, in many cases (in all the later types) a nuclear star cluster. We give an estimate of the magnitude of these inner components.
-
•
Using colour maps from HST imaging and SAURON Mg b maps, we have determined model-independent extinction maps for 10 of the 18 galaxies. We find that the central AV ranges from 0 to 2 mag, with many galaxies being optically thick in the optical. The profiles show a lot of structure, mostly due to extinction, with much larger gradients than are generally displayed by early-type galaxies.
-
•
The colours of nuclear clusters are the same as the inner regions of their host galaxies, with a scatter of 0.2 mag, indicating a similar composition and age as the stellar populations just outside the center, unlike e.g. galactic globular clusters.
Acknowledgements
We thank Alessandro Boselli and Luca Cortese for kindly making available profiles useful in establishing the reliability of the methods used in this Paper. We also thank Leslie Hunt, who very gently provided us her data in tabular format, and Michael Pohlen, who provided us his profiles as well. We kindly acknowledge Edo Noordermeer for very useful discussions and both him and Alister Graham for providing FORTRAN codes used in the preparation of the present Paper. Thanks to Isabel Pérez, Gert Sikkema and Michele Cappellari for helpful discussions and suggestions. KG acknowledges support for the Ubbo Emmius PhD program of the University of Groningen. This project made use of the HyperLeda and NED databases. Part of this work is based on data obtained from the STSci Science Archive Facility. The Digitized Sky Surveys were produced at the Space Telescope Science Institute under U.S. Government grant NAGW-2166. The images of these surveys are based on photographic data obtained using the Oschin Schmidt Telescope on Palomar Mountain and the UK Schmidt Telescope.
Appendix A Internal consistency of the method - literature comparison


In order to ensure the reliability of the method applied, we searched the literature for published band profiles. For the late-type spiral galaxies of our sample extremely little is available. One of the few existing references is the work of Hunt & Malkan (2004), who present NICMOS photometry for 250 active and normal galaxies, among which six are in common with our sample: NGC 488, 772, 2964, 3949, 4102, 5678. In almost all cases they used the same images as we did. The authors were so kind to provide us in tabular format the profiles for those galaxies, that they extracted keeping the centre of the isophotes fixed, but allowing the geometric parameters to vary over the whole radial range. In order to match their approach, we extracted again photometric profiles from the 2MASS and NICMOS images (DSS profiles are here redundant, since the literature profiles are available only in the inner 10″only; therefore we did not use them) along the average position angle and ellipticity of the profiles from Hunt & Malkan (2004). In Fig. 13 we show for those six galaxies the comparison with Hunt & Malkan (2004): the profiles (left panels) and the difference between them, plotted on the common radial range. The agreement is satisfactory (see also figure caption). NICMOS profiles for five of the six galaxies in common with Hunt & Malkan (2004) (NGC 488, 772, 2964, 3949, 5678), again derived from the same images that we used, are published also by Seigar et al. (2002); from a visual inspection of their profiles, we noticed that there is a significant offset with ours and Hunt’s profiles, which is probably due to the adoption of another magnitude system (AB magnitude system), therefore we did not proceed to a more detailed comparison.
As a reference for the ground-based band photometry, we chose to use the work of Gavazzi et al. (2001), who present band observations and surface brightness profile decomposition for 75 faint galaxies, mostly dwarf ellipticals belonging to the Virgo cluster. They collected band images at the ESO-NTT telescope in La Silla (Chile) and at the TNG on La Palma (Spain), reduced and calibrated the images and extracted brightness profiles fitting ellipses with ellipse centres, ellipticities and position angles left as free parameters. This corresponds to the first step in our procedure, as we described above. Since there is no overlap between their sample and ours, we chose some galaxies out of their paper (NGC 4353, 4440, 4600, 4706 and 4743), retrieved the 2MASS and DSS images for these galaxies and extracted brightness profiles with free geometric parameters, subtracted an estimate for the sky background, combined them into a single profile and converted the latter to an absolute magnitude scale in the same way as done for our own galaxies -we only skipped the steps where we fix the geometric parameters, for consistency with the approach used by Gavazzi et al. (2001). Fig. 14 shows for the chosen galaxies the comparison between our profiles and those published by Gavazzi et al. (2001), kindly made available in tabular format by the authors. The figure shows that the agreement is good, confirming the reliability of our method.
Appendix B Structural parameter relations
In this appendix we present a large number of relations, between structural parameters and luminosity of bulge, disk and total galaxy, and between structural and stellar population parameters. A few of these have already been discussed in Section 5. For the relations between structural parameters and luminosity of bulge, disk and total galaxy we find that our late type spiral galaxies generally behave in the same way as the compilation of Graham & Worley (2008). In Section 5.1 and 5.2 the most important correlations were discussed. Here we discuss more relations, for completeness.
We start looking at the relations between the structural parameters of bulge and disk and global galaxy properties such as morphological type and velocity dispersion. We plot these parameters against each other in Fig. B15.a and B15.b, for our sample with the compilation of GW always plotted as well to guide the eye. If we focus on our sample only, we can notice some trends: tends to decrease going to later types, and both the effective surface brightness of the bulge and the central surface brightness of the disk decrease going to later types. These correlations agree with GW and B07. Interesting to note is that for galaxies earlier than Sbc surface brightness of bulge and disk is virtually independent of type. For later types there is a strong correlation. There galaxies become smaller, and have lower surface brightness of both bulge and disk, for increasing morphological type (see also de Jong 1996, paper III). We confirm that there is no strong corelation between the size of bulges and disk and morphological type. Also, the size ratio re/h is independent of type, and we do not find the mild decrease that MacArthur et al. (2003) claim. See GW for an extended discussion about this ratio. The most important correlations with central celocity dispersion have been discussed in Section 5.1. We find that the effective radius of the bulge does not correlate with , nor does the scale length of the disk, or the ratio of bulge effective radius to disk scale length. There is a good correlation between bulge luminosity and (see also B07) and between bulge to disk ratio and .
In Fig. B16.a and B16.b we plot the structural parameters of bulges and disks as a function of bulge, disk and total -band luminosity. We see that surface brightness of bulges and disks increases with increasing bulge or disk luminosity, consequence of the constancy of disk scale length and bulge effective radius. Since later type spiral galaxies tend to be fainter, we find that the shape parameter increases with the luminosity of the bulge, disk or the whole galaxy. The relation between the bulge magnitude Mb and (top right panel in Fig. B16.a) is particularly tight: the correlation coefficient is , and it becomes even tighter () when removing the outlier point representing NGC 864. As shown by B07 in their Figure 6c, spiral galaxies follow the same trend as the Virgo ellipticals from Caon, Capaccioli & D’Onofrio (1993) in the plane (MBulge, ). We find a marginally significant correlation between bulge luminosity and effective radius, in the sense that brighter bulges are also larger. When the whole compilation of GW is considered this correlation is not found. In general, when the bulge luminosity increases, the Sérsic index decreases, and the surface brightness increases, with constant effective radius. For late type spirals only, which all have a similar Sérsic index (=1), there is apparently a tendency that both and re increase. The marginally significant correlation between disk luminosity and disk scale length is probably caused by the two bright outliers. The B/D luminosity ratio increases as galaxy bulges become more luminous, while it does not show strong trends with the disk magnitude MDisk. In general, from this work we infer that several correlations between structural properties of spiral galaxies are tighter versus MBulge than versus MDisk (see Table 5), in agreement with the conclusion of Balcells et al. (2007b). This is particularly intriguing, implying that (some of) the properties are driven by the mass of the bulge. GW, who find the same strong relation, also comment that these new decompositions, with Sérsic rather than de Vaucouleurs bulge, show that very few spirals have B/T 1/3. In a long discussion GW confirm this conclusion, and point out that the B/D ratios in cosmological galaxy simulations are on the average much larger, showing that the models, or probably the recipes for supernova feedback, need to be improved considerably.
Fig. B17 shows the Sérsic parameter , the bulge effective surface brightness and radius, the disk central surface brightness and scale length, the /h ratio and the B/D luminosity ratio as a function of H, Mgb′, age and star formation time-scale . The stellar population parameters refer to a central aperture of radius 15. Mgb′ is the difference in magnitudes between the observed Mgb index and the prediction, based on the observed velocity dispersion, given by the Mg relation published by Jørgensen et al. (1996), which is now believed to hold for old spheroids (see discussion in Peletier et al. (2007)); Mgb′ is therefore a measure of the importance of young populations in the galaxy. For the sake of clarity, we remind the reader that can be derived from and in the following way, adopting the Mg relation from Jorgensen, expressed as in Eq. 3 in the paper of Ganda et al. (2007), the definition of Mgb′ inferred from Eq. 2 in the same paper and the conversion between Mg2 and Mgb′ given in Eq. 4 there:
| (3) |
Going back to Fig. B17 and to the description of the quantities involved here, the age is the Single Stellar Population (SSP)-equivalent age inferred by comparison of observed line-strength indices with models and is the -folding time-scale for star formation, assuming a galaxy age of 10 Gyr and an exponentially declining star formation rate with time. For details we refer the reader to Sections 5.3, 6.1 and 6.3, in Ganda et al. (2007). We can observe some trends, a few of which significant (), in those cases we have also plotted the correlation as a dashed line: when H increases, i.e. when the stellar population becomes younger, decreases, both and become fainter, and the disk scale length h and the bulge effective radius decrease. There are also indications that both and h become smaller with Mgb′ becoming more negative, which means that galaxies farther away from the Mg relation of old ellipticals, i.e. younger galaxies, have both smaller bulges and smaller disks. No relevant trend is found with age: possibly a confirmation of the fact that, in general, SSP-equivalent ages and metallicities are not a good approximation for spiral galaxies, as discussed by Peletier et al. (2007) and Ganda et al. (2007). A more relevant parameter for our galaxies seems to be , in the framework of a continuous star formation: as increases (and the star formation history is less and less well described by a single burst), becomes smaller, and become fainter and and h become smaller. No significant trend is observed involving the ratio h ratio and the B/D luminosity ratio. Globally, Fig. B17 seem to corroborate a scenario where galaxies with a quiescent, almost constant star formation, hosting composite stellar populations, with (at least) some young stars, have almost-exponential bulges and small and faint bulges and disks, while galaxies that formed stars in a single burst long ago (more SSP-like) tend to have higher and bigger and brighter bulges and disks. A similar scenario, in which the character of the star formation history is replaced by the galaxy age, is suggested also by Hunt, Pierini & Giovanardi (2004), as we mentioned earlier: exponential bulges would be young products of secular evolution; as the galaxy ages, the bulges would grow and their increase.
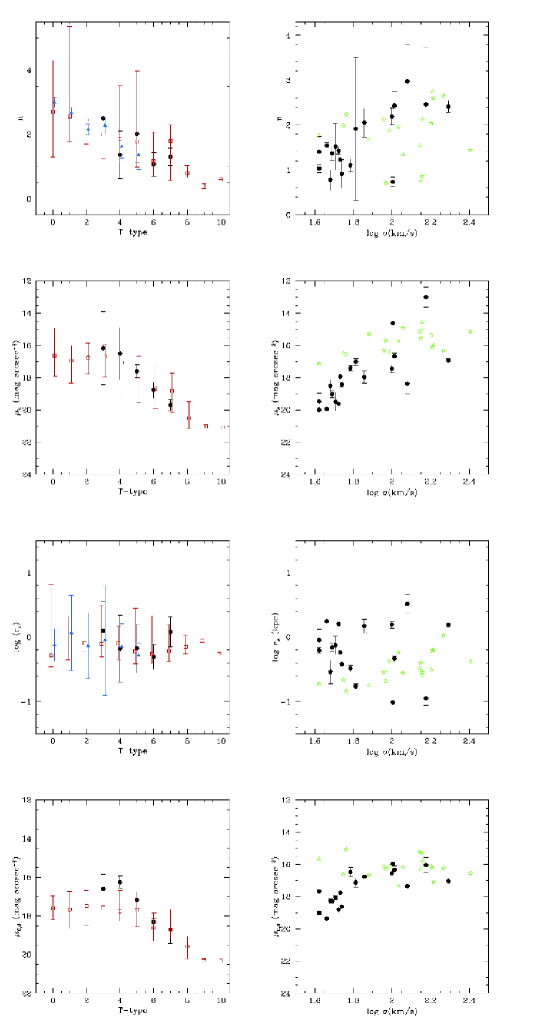
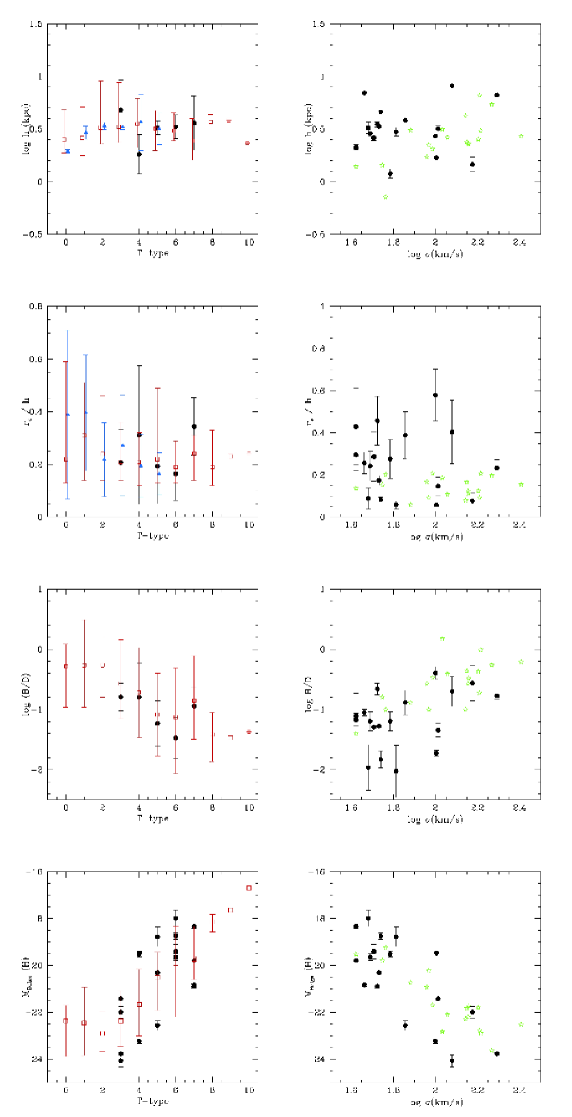
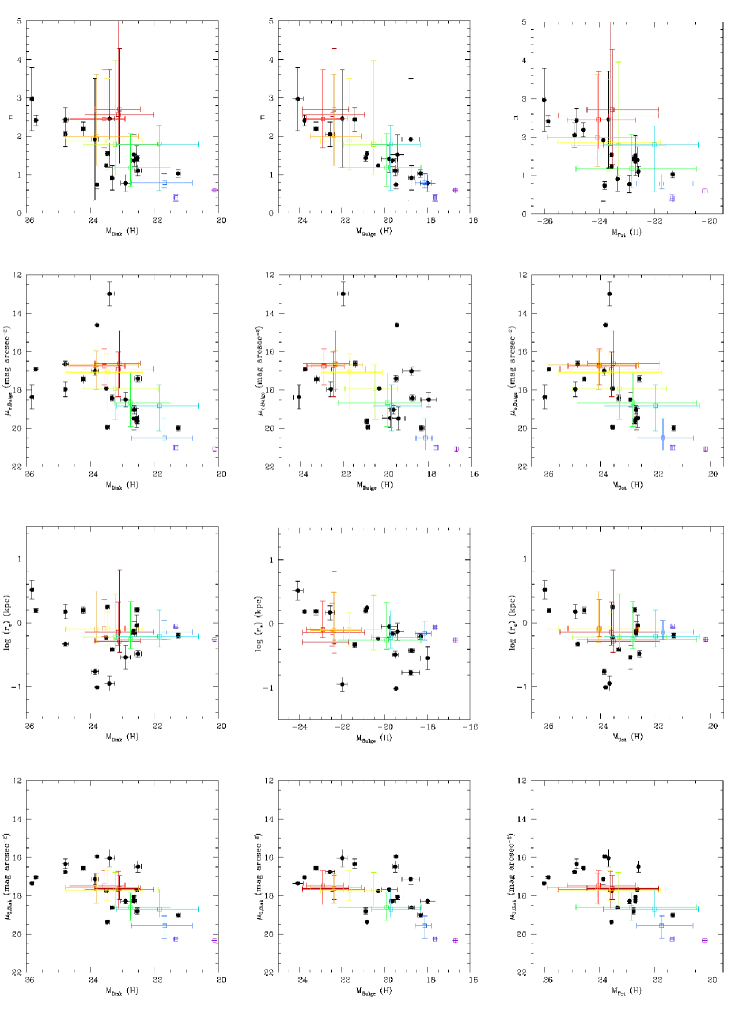
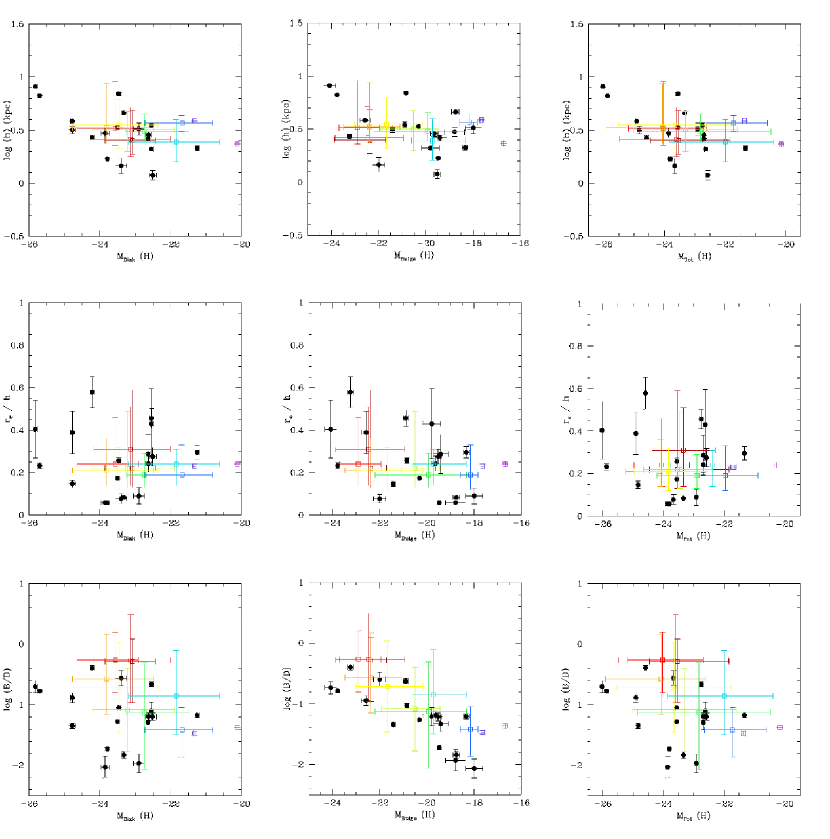
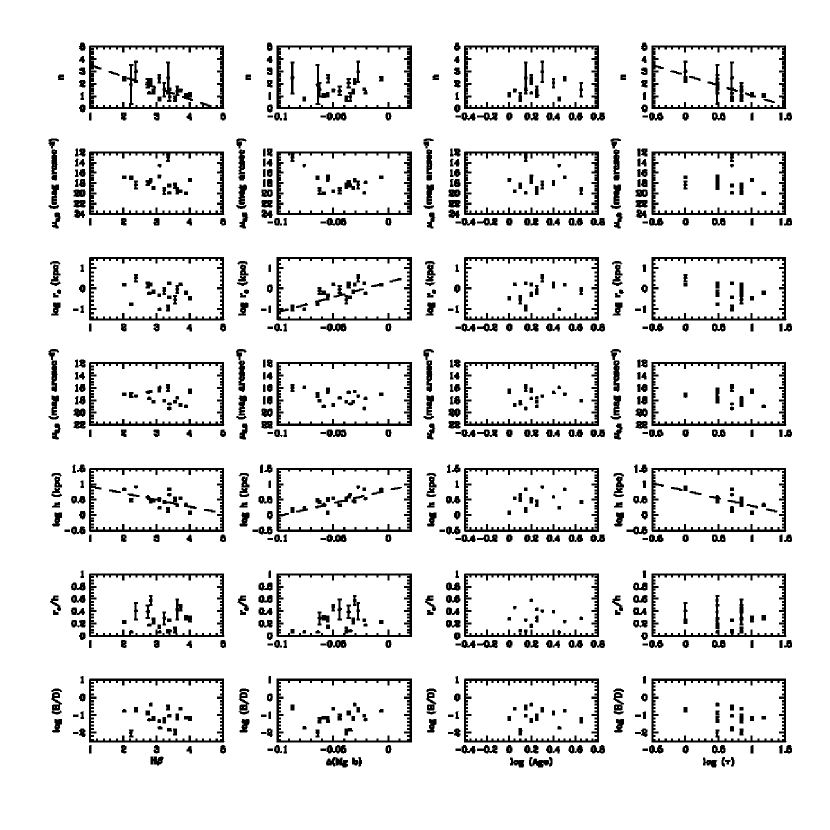
References
- Aguerri, Balcells & Peletier (2001) Aguerri J.A.L., Balcells M., Peletier R.F., 2001, A&A, 367, 428
- Andredakis & Sanders (1994) Andredakis Y., Sanders R., 1994, MNRAS, 267, 283
- Andredakis et al. (1995) Andredakis Y.C., Peletier R.F., Balcells M., 1995, MNRAS, 275, 874
- (4) Bacon R. et al., 2001, MNRAS, 326, 23 (Paper I)
- Balcells et al. (2007a) Balcells M., Graham A.W., Peletier R.F., 2007a, ApJ, 665, 1084
- Balcells et al. (2007b) Balcells M., Graham A.W., Peletier R.F., 2007b, ApJ, 665, 1104
- Böker et al. (2002) Böker T., Laine S., van der Marel R.P., Sarzi M., Rix H.-W., Ho L.C., Shields J.C., 2002, AJ, 123, 1389
- Boroson (1981) Boroson T., 1981, ApJS, 46, 177
- Boroson et al. (1983) Boroson T., Strom K.M., Strom S.E., 1983, ApJ, 274, 39
- Boselli & Gavazzi (1994) Boselli, A., & Gavazzi, G. 1994, A&A, 283, 12
- Bruzual & Charlot (2003) Bruzual, G., & Charlot, S. 2003, MNRAS, 344, 1000
- Caon, Capaccioli & D’Onofrio (1993) Caon N., Capaccioli M., D’Onofrio M., 1993, MNRAS, 265, 1013
- Carollo et al. (1997) Carollo C.M., Stiavelli M., de Zeeuw P.T., Mack J., 1997, AJ, 114, 2366
- Carollo & Stiavelli (1998) Carollo C.M., Stiavelli M., 1998, AJ, 115, 2306
- Carollo et al. (1998) Carollo C.M., Stiavelli M., Mack J., 1998, AJ, 116, 68
- Carollo (1999) Carollo C.M., 1999, ApJ, 523, 566
- Carollo et al. (2001) Carollo, C. M., Stiavelli, M., de Zeeuw, P. T., Seigar, M., & Dejonghe, H. 2001, ApJ, 546, 216
- Carollo et al. (2002) Carollo C.M., Stiavelli M., Seigar M., de Zeeuw P.T., Dejonghe H., 2002, AJ, 123, 159
- Carollo et al. (2007) Carollo, C. M., Scarlata, C., Stiavelli, M., Wyse, R. F. G., & Mayer, L. 2007, ApJ, 658, 960
- Ciotti & Bertin (1999) Ciotti L., Bertin G., 1999, A&A, 352, 447
- Combes et al. (1990) Combes F., Debbasch F., Friedli D., Pfenniger D., 1990, A&A, 233, 82
- Courteau et al. (1996) Courteau S., de Jong R., Broeils, 1996, ApJ, 457, L73
- de Jong & van der Kruit (1994) de Jong R.S., van der Kruit P.C., 1994, A&AS, 106, 451
- de Jong (1995) de Jong R.S., 1995, PhD Thesis, Univ. Groningen
- de Jong (1996a) de Jong R.S., 1996a, A&AS, 118, 557
- de Jong (1996b) de Jong R.S., 1996b, A&A, 313, 45
- de Vaucouleurs (1948) de Vaucouleurs G., 1948, Ann.D’Astroph.,11, 247
- de Vaucouleurs (1959) de Vaucouleurs, G. 1959, ApJ, 130, 728
- de Vaucouleurs et al. (1991) de Vaucouleurs G., de Vaucouleurs A., Corwin H.G.Jr., Buta R.J., Paturel G., Fouqué P., 1991, Third Reference Catalogue of Bright Galaxies, Springer-Verlag, New York (RC3)
- (30) de Zeeuw P.T. et al., 2002, MNRAS, 329, 513 (Paper II)
- D’Onofrio, Capaccioli & Caon (1994) D’Onofrio M., Capaccioli M., caon N., 1994, MNRAS, 271, 523
- Driver et al. (2007) Driver, S. P., Popescu, C. C., Tuffs, R. J., Liske, J., Graham, A. W., Allen, P. D., & de Propris, R. 2007, MNRAS, 379, 1022
- Erwin & Sparke (2002) Erwin, P., & Sparke, L. S. 2002, AJ, 124, 65
- Erwin et al (2003) Erwin P., Beltrán J.C.V., Graham A.W., Beckman J.E., 2003, ApJ, 597, 929
- Falcón-Barroso et al. (2006) Falcón-Barroso, J., et al. 2006, MNRAS, 369, 529
- Fathi & Peletier (2003) Fathi K., Peletier R.F., 2003, Astron.Astrophys., 407, 61
- Ferrarese & Merritt (2000) Ferrarese, L., & Merritt, D. 2000, ApJl, 539, L9
- Fisher & Drory (2008) Fisher, D. B., & Drory, N. 2008, AJ, 136, 773
- Freeman (1970) Freeman K..C., 1970, ApJ, 160, 811
- Frogel et al. (1978) Frogel, J. A., Persson, S. E., Matthews, K., & Aaronson, M. 1978, ApJ, 220, 75
- Frogel (1985) Frogel J.A., 1985, ApJ, 298, 528
- Ganda et al. (2006) Ganda K.,Falcón-Barroso J., Peletier R.F., Cappellari M., Emsellem E., McDermid R., de Zeeuw P.T, Carollo M., 2006, MNRAS, 367, 46
- Ganda et al. (2007) Ganda K. et al., 2007, MNRAS, 380, 506
- Gavazzi et al. (2001) Gavazzi G., Zibetti S., Boselli A., Franzetti P., Scodeggio M., Martocchi S., 2001, A&A, 372, 29
- Gebhardt et al. (2000) Gebhardt, K., et al. 2000, ApJl, 543, L5
- Giovanardi & Hunt (2004) Giovanardi C. & Hunt L.K.,1988, AJ, 95, 408
- Giovanelli et al. (1995) Giovanelli, R., Haynes, M. P., Salzer, J. J., Wegner, G., da Costa, L. N., & Freudling, W. 1995, AJ, 110, 1059
- (48) Graham A.W., 2001, AJ, 121, 820
- Graham & Driver (2007) Graham, A. W., & Driver, S. P. 2007, ApJ, 655, 77
- Graham & Driver (2005) Graham, A. W., & Driver, S. P. 2005, Publications of the Astronomical Society of Australia, 22, 118
- Graham & Worley (2008) Graham, A. W., & Worley, C. C. 2008, MNRAS, 388, 1708
- Grosbøl (1985) Grosbøl P.J., 1985, A&AS, 60, 261
- Holtzman (1995) Holtzman J.A., Borrows C.J., Casertano S., Hester J.J., Trauger J.t., Watson A.M., Worthey G., 1995, PASP, 107, 1065
- Hunt & Malkan (2004) Hunt L.K., Malkan M.A., 2004, ApJ, 616, 729
- Hunt, Pierini & Giovanardi (2004) Hunt L.K., Pierini D., Giovanardi C., 2004, A&A, 414, 905
- Jedrzejewski (1987) Jedrzejewski R.I., 1987, MNRAS, 226, 747
- Jørgensen et al. (1996) Jørgensen I., Franx M., Kjærgaard P., 1996, MNRAS, 280, 167
- Kent (1983) Kent S.M., 1983, ApJ, 226, 562
- Kent (1984) Kent S.M., 1984, ApJS, 56, 105
- Kent (1985) Kent S.M., 1985, ApJS, 59, 115
- Kent (1986) Kent S.M., 1986, AJ, 91, 1301
- Knapen et al. (1995) Knapen, J. H., Beckman, J. E., Shlosman, I., Peletier, R. F., Heller, C. H., & de Jong, R. S. 1995, ApJl, 443, L73
- Kormendy (1977) Kormendy J., 1977, ApJ, 217, 406
- Kormendy & Illingworth (1982) Kormendy J., Illingworth G., 1982, ApJ, 256, 460
- Kormendy (1993) Kormendy, J. 1993, Galactic Bulges, 153, 209
- Kormendy & Kennicutt (2004) Kormendy J., Kennicutt R.C.Jr., 2004, ARA&A, 42, 603
- Kuchinski et al. (1998) Kuchinski, L. E., Terndrup, D. M., Gordon, K. D., & Witt, A. N. 1998, AJ, 115, 1438
- Kuntschner et al. (2006) Kuntschner, H., et al. 2006, MNRAS, 369, 497
- Laine et al. (2002) Laine S., Shlosman I., Knapen J.H., Peletier R.F., ApJ, 567, 92
- MacArthur et al. (2003) MacArthur L., Courteau S., Holtzmann J., 2003, ApJ, 582, 689
- MacArthur (2005) MacArthur, L. A. 2005, ApJ, 623, 795
- Martini et al. (2003) Martini, P., Regan, M. W., Mulchaey, J. S., & Pogge, R. W. 2003, ApJ, 589, 774
- Matthews & Gallagher (1997) Matthews L.D., Gallagher J.S.III, 1997, AJ, 114, 1899
- Möllenhoff & Heidt (2001) Möllenhoff C., Heidt J., 2001, A&A, 368, 16
- Moriondo et al. (2001) Moriondo G. et al., 2001, A&A, 370, 881
- Moriondo, Giovanardi & Hunt (1998) Moriondo G., Giovanardi C., Hunt L.K., 1998, A&AS, 130, 81
- (77) Noordermeer E., 2006, PhD Thesis, Univ. Groningen
- (78) Noordermeer E., van der Hulst J.M., 2007, MNRAS, 376, 1480
- Norman et al. (1996) Norman C., Sellwood J.A., Hasan H., 1996, ApJ, 462, 114
- Palunas & Williams (2000) Palunas P., Williams T.B., 2000, AJ, 120, 2884
- Peletier, Valentijn & Jameson (1990) eletier, R. F., Valentijn, E. A., & Jameson, R. F. 1990, A&A, 233, 62
- Peletier et al. (1995) Peletier, R. F., Valentijn, E. A., Moorwood, A. F. M., Freudling, W., Knapen, J. H., & Beckman, J. E. 1995, A&A, 300, L1
- Peletier & Balcells (1996) Peletier, R. F., & Balcells, M. 1996, AJ, 111, 2238
- Peletier & de Grijs (1998) Peletier, R. F., & de Grijs, R. 1998, MNRAS, 300, L3
- Peletier et al. (2007) Peletier R.F. et al., 2007, MNRAS, 379, 445
- Peletier (2008) Peletier, R. F. 2008, Pathways Through an Eclectic Universe, 390, 232
- Phillips et al. (1996) Phillips A.C., Illingworth G.D., MacKenty J.W., Franx M., 1996, AJ, 111, 1566
- Pohlen & Trujillo (2006) Pohlen M., Trujillo I., 2006, A& A, 454,759
- Pfenniger & Norman (1990) Pfenniger D., Norman C., 1990, ApJ, 363, 391
- Popescu et al. (2000) Popescu, C. C., Misiriotis, A., Kylafis, N. D., Tuffs, R. J., & Fischera, J. 2000, A&A, 362, 138
- Prieto et al. (2001) Prieto M., Aguerri J.A.L., Varela A.M., Muñoz-Tuñón C., 2001, A&A, 367, 405
- Raha et al. (1991) Raha N., Sellwood J.A., James R.A., Kahn F.D., 1991, Nature, 352, 411
- Renzini (1999) Renzini A., in ’The formation of galactic bulges’, 1999, Carollo M., Ferguson H.C., Wyse R.F.G., New York - Cambridge University Press
- Rieke & Lebofsky (1985) Rieke, G. H., & Lebofsky, M. J. 1985, ApJ, 288, 618
- Schombert & Bothun (1987) Schombert J.M., Bothun G.D., 1987, AJ, 93, 60
- Seigar et al. (2002) Seigar M.S., Carollo C.M., Stiavelli M., de Zeeuw P.T., Dejonghe H., 2002, AJ, 123, 184
- Sérsic (1968) Sérsic J.L., 1968, Atlas de Galaxias Australes (Cordoba: Obs.Astronom.)
- Terndrup et al. (1994) Terndrup, D. M., Davies, R. L., Frogel, J. A., Depoy, D. L., & Wells, L. A. 1994, ApJ, 432, 518
- Tuffs et al. (2004) Tuffs, R. J., Popescu, C. C., Völk, H. J., Kylafis, N. D., & Dopita, M. A. 2004, A&A, 419, 821
- Tully et al. (1998) Tully, R. B., Pierce, M. J., Huang, J.-S., Saunders, W., Verheijen, M. A. W., & Witchalls, P. L. 1998, AJ, 115, 2264
- Turnrose (1976) Turnrose, B. E. 1976, ApJ, 210, 33
- Walcher et al. (2006) Walcher, C. J., Böker, T., Charlot, S., Ho, L. C., Rix, H.-W., Rossa, J., Shields, J. C., & van der Marel, R. P. 2006, ApJ, 649, 692
- Wyse, Gilmore & Franx (1997) Wyse R.F.G., Gilmore G., Franx M., 1997, ARA&A, 35, 637
- Zaritsky et al. (1993) Zaritsky, D., Rix, H.-W., & Rieke, M. 1993, Nature, 364, 313