, and spectroscopy of SDSSJ095209.56+214313.3: the most luminous coronal-line supernova ever observed, or a stellar tidal disruption event ?
Abstract
The galaxy SDSSJ095209.56+214313.3 (SDSSJ0952+2143 hereafter) showed remarkable emission-line and continuum properties and strong emission-line variability first reported in 2008 (paper I). The spectral properties and low-energy variability are the consequence of a powerful high-energy flare which was itself not observed directly. Here we report follow-up optical, near-infrared, mid-infrared, and X-ray observations of SDSSJ0952+2143. We discuss outburst scenarios in terms of stellar tidal disruption by a supermassive black hole, peculiar variability of an AGN, and a supernova explosion, and possible links between these scenarios and mechanisms. The optical spectrum of SDSSJ0952+2143 exhibits several peculiarities: an exceptionally high ratio of [FeVII] transitions over [OIII], a dramatic decrease by a factor of 10 of the highest-ionization coronal lines, a very unusual and variable Balmer line profile including a triple-peaked narrow component with two unresolved horns, and a large Balmer decrement. The MIR emission measured with the IRS in the narrow 10–20m band is extraordinarily luminous and amounts to erg s-1. The IRS spectrum shows a bump around 11m and an increase toward longer wavelengths, reminiscent of silicate emission. The strong MIR excess over the NIR implies the dominance of relatively cold dust. The pre- and post-flare NIR host galaxy colours indicate a non-active galaxy. The X-ray luminosity of erg s-1 measured with is below that typically observed in active galactic nuclei (AGN). Similarities of SDSSJ0952+2143 with some extreme supernovae (SNe) suggest the explosion of a supernova of Type IIn. However, an extreme accretion event in a low-luminosity AGN or inactive galaxy, especially stellar tidal disruption, remain possibilities, which could potentially produce a very similar emission-line response. If indeed a supernova, SDSSJ0952+2143 is one of the most distant X-ray and MIR detected SNe known so far, the most MIR luminous, and one of the most X-ray luminous. It is also by far the most luminous ( erg s-1) in high-ionization coronal lines, exceeding previous SNe by at least a factor of 100.
Subject headings:
circumstellar matter – supernovae: general – galaxies: emission lines – galaxies: individual (SDSSJ095209.56+214313.3)1. Introduction
Transient phenomena have been detected in various astrophysical object classes. They are especially pronounced in the high-energy regime, and provide us with important information on the physics of astrophysical sources under extreme conditions. Many of the transient phenomena are linked, in one way or another, to the presence of compact objects and especially black holes and the physical processes in their immediate environment. Transience in the high-energy domain covers a broad range of timescales ranging from typically milli-seconds – seconds in Gamma-Ray Bursts (GRBs; Klebesadel et al. 1973, Piran 2005), over minutes – hours in X-ray bursts (Grindlay et al. 1976, Lamb 2000) and early stages of supernova explosions (Soderberg et al. 2008), to weeks – months in stellar tidal disruptions (Rees 1988, Komossa & Bade 1999), for instance. Other transient events have been predicted by theory, but not yet observed, including long-lasting accretion disk flares of recoiling supermassive black holes (SMBHs; Shields & Bonning 2008), or very short-timescale hard X-ray flares due to tidal detonations of stars (Brassart & Luminet 2008).
Powerful outbursts of radiation do not only carry key information about their production mechanisms, they also can be used as a probe of their gaseous environment: the radiation is reprocessed into ultraviolet (UV), optical, infrared (IR) and X-ray emission lines which contain a wealth of information on the gaseous kinematics, chemical composition, density and geometry of the line-emitting gas. In the context of supernova explosions, reprocessing of high-energy radiation into emission lines carries information on the progenitor star and the circumstellar medium (Chugai & Danziger 1994; Filippenko 1997). Accretion flares from stars tidally disrupted by massive black holes will illuminate the stellar post-disruption debris and the interstellar medium, potentially including broad and narrow-line regions and molecular tori at the cores of galaxies.
We have found SDSSJ0952+2143 (Komossa et al. 2008) at redshift =0.079 in a systematic search for emission-line galaxies in SDSS-DR6 (Sloan Digital Sky Survey Data Release 6; Adelman-McCarthy et al. 2008). The optical spectrum of SDSSJ0952+2143 and its multi-wavelength properties turned out to be exceptional. The optical spectrum is dominated by strong iron coronal lines with the highest ratios of several [FeVII] transitions over [OIII]5007 measured among galaxies. The H profile shows a multi-peaked structure. The highest-ionization iron lines have significantly faded between 2005 and 2007, and the optical continuum emission has decreased. These properties were interpreted as an emission-line and continuum response to a powerful high-energy flare (Komossa et al. 2008; hereafter paper I) which itself escaped detection. After the initial recognition of the unusual spectrum and quick optical follow-up spectroscopy in December 2007, we have initiated a number of multi-wavelength observations, especially having in mind the possibility of using the emission-line response to the flare as a rare chance to do reverberation mapping of the different systems of gaseous matter in the galaxy core. Here, we report follow-up spectroscopy in the IR, optical and X-ray band, and explore outburst scenarios. The paper is structured as follows: In Sect. 2 we present the new optical, IR and X-ray observations and describe the data analysis. In Sect. 3 we use emission-line and continuum properties as diagnostics of the physical conditions in the line-emitting gas. Sect. 4 scrutinizes scenarios which could explain the unusual multi-wavelength properties of SDSSJ0952+2143, with focus on a supernova explosion, exceptional AGN-type variability and tidal-disruption-related scenarios. The conclusions are provided in Sect. 5. In Tab. 1 an overview of the previous and new observations and the sequence of events is presented. We use a cosmology (Wright 2006) with =70 km s-1 Mpc-1, =0.3 and =0.7 throughout this paper.
2. Multi-wavelength observations
2.1. New Technology Telescope () optical spectroscopy
2.1.1 Data reduction
We have observed SDSSJ0952+2143 with 111see the EMMI user’s manual
at
http://www.ls.eso.org/docs/
LSO-MAN-ESO-40100-0001/LSO-MAN-ESO-40100-0001.pdf at the
ESO- 3.5m telescope on 2008 February 8 (hereafter referred to as 2008 spectrum).
We took two exposures each
of 1500 s duration with grism
#5 (wavelength range: 3800Å– 7000Å) and #6
(wavelength range: 5800Å– 8600Å),
respectively,
using a slit width of 1.5 arcsec oriented at the parallactic angle
(Filippenko 1982).
This setting gave a spectral
resolution of 6Å.
KPNO standard stars were observed before and after each target exposure
for flux calibration.
He-Ne-Ar lamp spectra were obtained with the
two grisms in order to carry out the wavelength calibration.
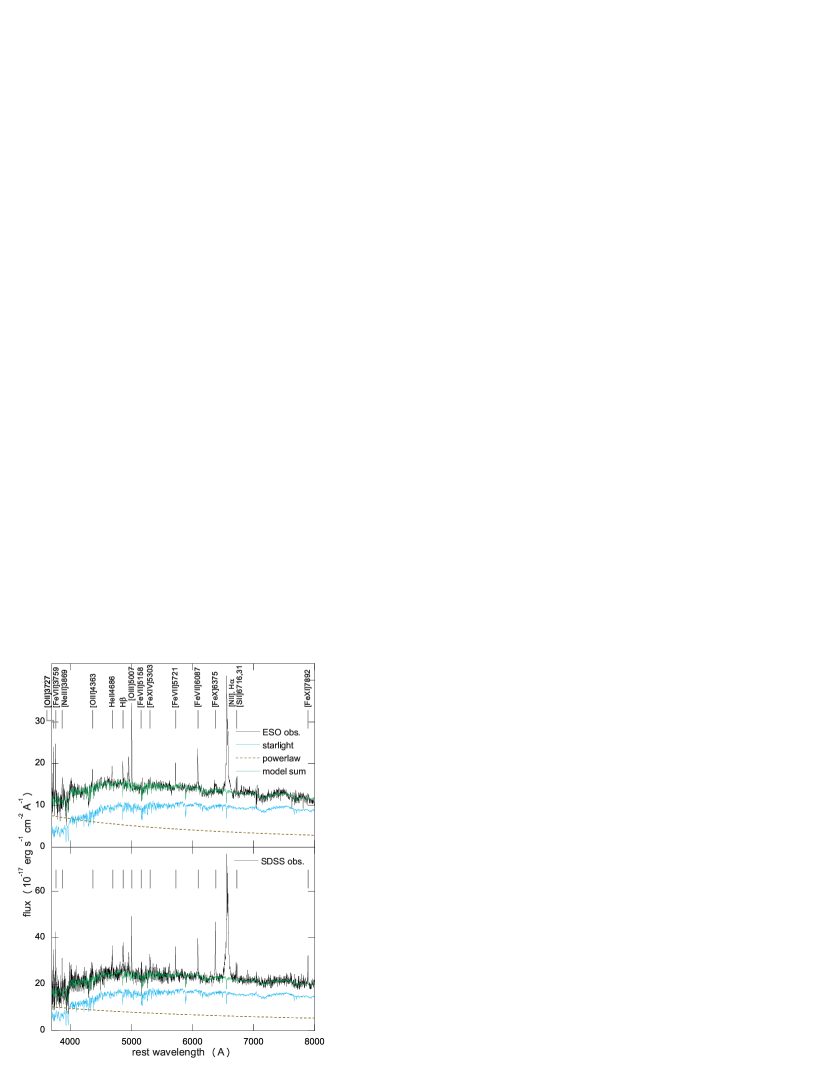
The raw two-dimensional data were reduced with standard procedures using the software package IRAF222IRAF is distributed by the National Optical Astronomy Observatory, which is operated by the Association of Universities for Research in Astronomy, Inc., under cooperative agreement with the National Science Foundation.. The CCD data reduction includes bias subtraction, flat-field correction, and cosmic-ray removal. The task apall was used to extract the spectra. We then carried out the wavelength and flux calibration using the He-Ne-Ar lamp spectra and the standard stars. After flux calibration the two spectra obtained with grism#5 agree within 4% with each other, and with one of the two grism#6 spectra within 8%. The second grism#6 exposure deviated in its normalization which could be traced back to a change in seeing during that target exposure, and this spectrum was therefore shifted in flux scale to match the other 3 spectra. The spectra were corrected for Galactic extinction of E(B-V)=0.028. All four spectra were then combined and the resulting spectrum is shown in Fig. 1 where it is compared with the previous SDSS spectrum which was taken in 2005. Telluric absorption was corrected for, using the standard stars and taking into account the airmass during the observations.
2.1.2 Underlying spectral energy distribution (SED)
Using the flux calibration scheme described above, the observed continuum level, dominated by starlight from the host galaxy, is lower in the spectrum than in the SDSS spectrum, which can be traced back to aperture loss due to the extended host galaxy. The flux in the [OIII]5007 emission line is consistent with being constant between the 2005 SDSS and 2008 ESO observation (Tab. 1). In any case, when using emission-line ratios for diagnostics, we preferentially use neighbouring emission lines, to be more independent of residual absolute calibration uncertainties.
The SDSS and spectra were decomposed into a stellar and a non-stellar (powerlaw) component using the method described by Lu et al. (2006, see also Zhou et al. 2006), and are both dominated by the stellar component of the host galaxy. The continuum emission from the host galaxy can be well fit with a single stellar population with an age of Gyr. The underlying non-stellar continuum component is very faint in the spectrum. In paper I, we used instead a mix of synthesized galaxy template spectra to describe the host galaxy emission, rather than one single stellar population. Re-modelling of the continuum introduces slight changes (typically 10–20%) in the re-measured emission lines reported here.
2.1.3 Narrow emission lines
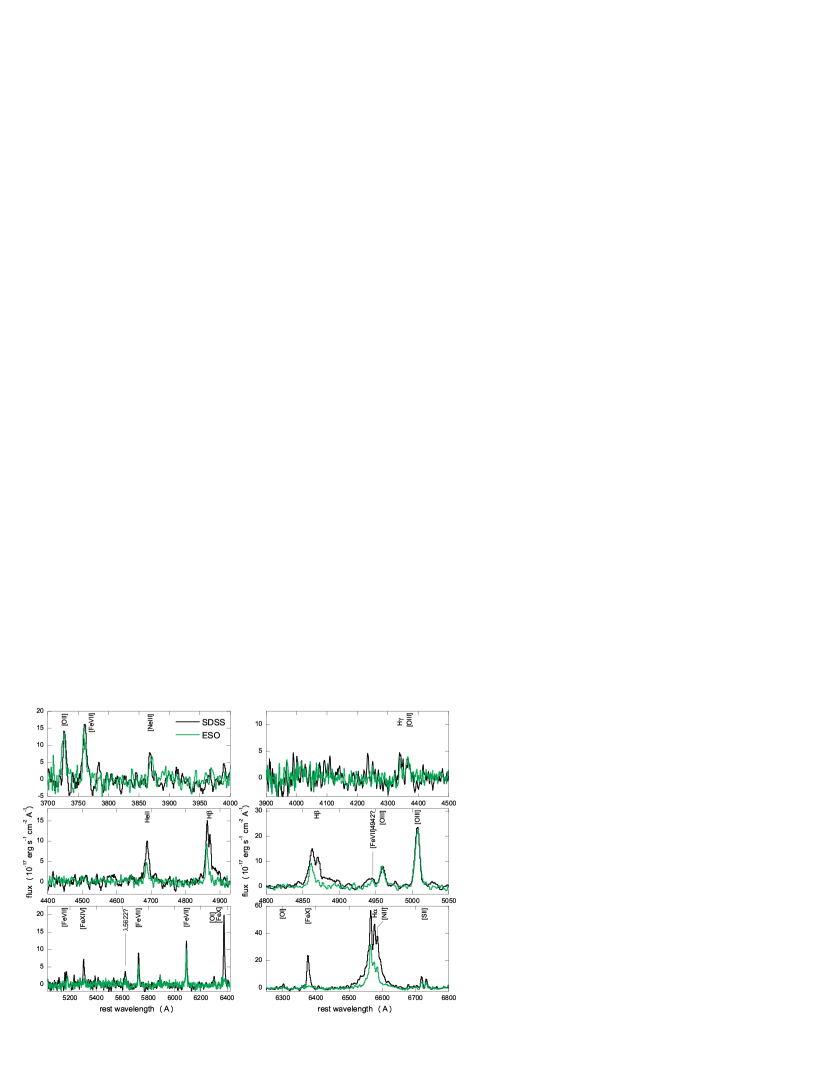
After the SED was decomposed into host galaxy and powerlaw contribution (Fig. 1), these components were subtracted from the spectrum and the emission lines were then measured. Emission-line widths reported here and in paper I have been corrected for instrumental broadening. Most emission lines which were present in the 2005 SDSS spectrum are still detected in the 2008 spectrum, even though a number of them, especially the highest-ionization lines, the broad Balmer lines, and the peculiar narrow Balmer horns are significantly fainter (see below). We identify transitions of [OI], [OII], [OIII], [NII], [SII], HeII, [NeIII], [FeVI], Fe[VII], [FeX], [FeXI], [FeXIV], and Balmer lines (Figures 1-4).
We have first refit all emission lines of the 2005 SDSS spectrum with a single Gaussian component, and then did the same for the 2008 spectrum. Single Gaussian fits to those emission lines which do not show spectral complexity result in line widths of 200-300 km s-1 in the SDSS spectrum. These same lines are not resolved in the spectrum, which was of lower resolution, consistent with constant line width. Most of the high-ionization lines appear broader than the low-ionization lines, indicative of a two-component nature of their line profiles (see below). FWHMs based on single Gaussian fits listed in Tab. 2 should therefore not be used per se, but should rather be taken as an indication of a more complex emission-line profile, if the line width exceeds 300 km s-1.
As already noted in paper I, the highest-ionization iron lines have strongly faded. Here we greatly improve limits on [Fe X] and [Fe XIV] and for the first time include [FeXI] in the spectral band, in comparison with the earlier 2007 follow-up spectroscopy. [FeXI] is a factor 10 fainter in the 2008 spectrum than it was in the 2005 SDSS spectrum. [FeX] is very faint, even though the exact measurement is hampered by uncertainties in the precise correction of the superposed telluric (atmospheric) absorption.
The line emission from [OIII]4363 and HeII4686 is remarkably strong in the 2005 and 2008 spectra, with intensity ratios [OIII]4363/[OIII]5007 = 0.2, and HeII4686totl/H = 2 in 2005 (while HeII4686n/H = 0.3, below the value of 0.66 above which the ratio is dominated by helium abundance; Dopita & Sutherland 2003). Here, the index totl refers to the total line emission, while the index n refers to the emission of the narrow component. HeII4686totl/H decreased by a factor 2.8 which can be traced back to a decrease in the broad component in HeII (Sect. 2.1.4).
We have compared the 2007 spectrum (paper I) with the 2008 spectrum in order to search for spectral variations on the timescale of two months. Keeping in mind the lower S/N and resolution of the spectrum, emission lines are consistent with being constant within better than a factor of 2. A new optical spectrum was acquired with the 2.16m telescope on 2008 December 25 with an exposure time of 7200 s. The strongest emission lines are still all present and no new spectral features have emerged. [FeVII]5722 is no longer safely detected, indicating a decrease of this line at the 3 level. The full results of this and future optical monitoring will be presented elsewhere.
2.1.4 Two-component high-ionization lines
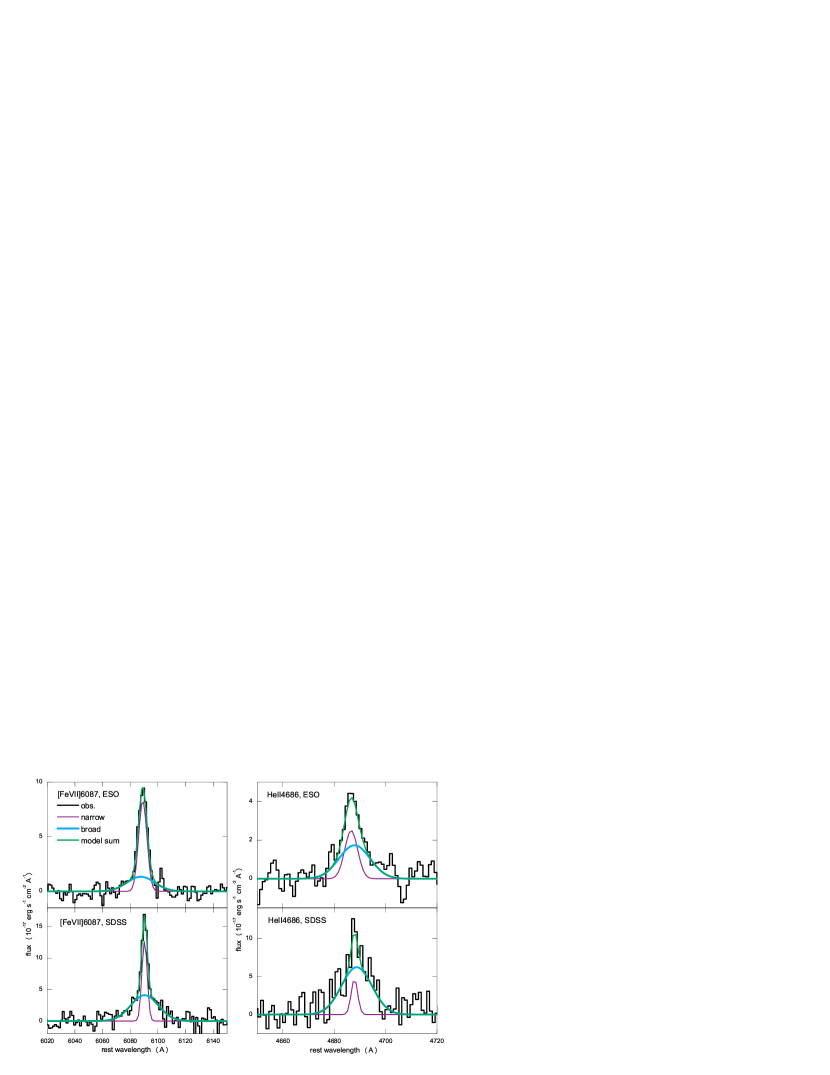
When fit by single Gaussians, several of the high-ionization lines show a relatively broad profile, and are in fact better modeled by two components; a broad base and a narrow core. Seven lines in the SDSS spectrum are strong enough for such a decomposition; while for only two of them the decomposition can still be done with the spectrum. These seven lines are [FeVII]3759, HeII4686, [OIII]5007, [FeVII]5722, [FeVII]6087, [FeX]6376 and [FeXI]7894. If the narrow core of each line is fixed to the FWHM of [SII], 210 km s-1, the broad base is well fit by a second Gaussian with a width of 600–800 km s-1 ([FeVII]5722, [FeX]6376, [FeVII]3759 and [FeXI]7894), 900–1100 km s-1 ([FeVII]6087 and HeII), and 400 km s-1 ([OIII]5007), respectively. [FeVII]6087 and HeII4686 can still be decomposed in the ESO spectrum and were represented by a two-component Gaussian assuming that neither the width of the broad component nor that of the narrow component varied between 2005 and 2008 (and taking into account the different instrumental broadening). We find that the flux in the narrow component is almost constant, while the broad component decreased by at least a factor of 3 (Fig. 4).
2.1.5 Balmer line profile and variability
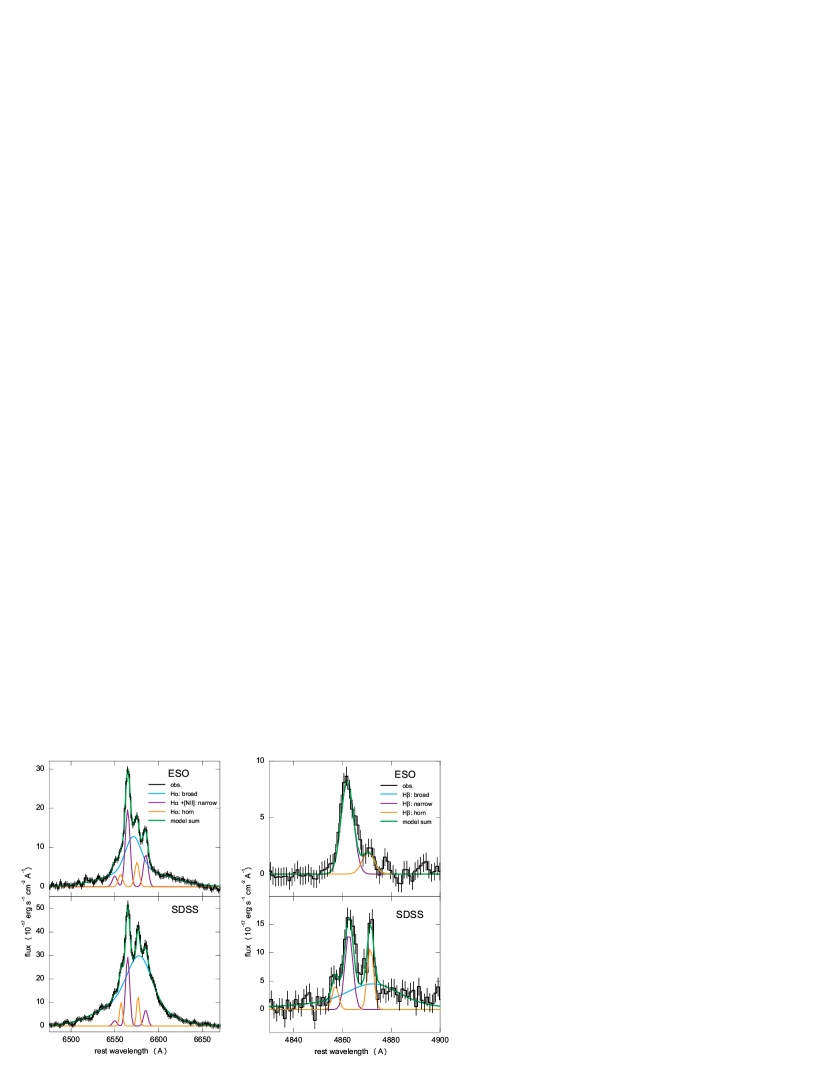
We paid special attention to changes in the very unusual profile of the Balmer lines, which consist of several components; an asymmetric broad base, a narrow core, and two strong peculiar unresolved horns. We carefully decomposed the line profiles, and searched for changes between the 2008 spectrum and the 2005 SDSS spectrum. The H+[NII] blend in the SDSS spectrum was fit with seven Gaussians: (1) Three Gaussians for the “normal” narrow emission lines in H and [NII]6548,6584. The redshift and line widths were fixed to that of the [SII]6716,6731 doublet, and the [NII]6548/6584 ratio was fixed to the theoretical value of 1/3. (2) Two Gaussians for the narrow horns, with line width fixed to the instrumental resolution, and centroids and intensities as free parameters333In what follows we will generally assume that only these two strong horns are present, but note here that we cannot exclude the presence of more such components at very faint emission levels.. (3) Two Gaussians for the broad component of H with centroids, widths, and intensities as free parameters. Since the broad base is much broader than the narrow components and since the narrow horns are red- and blueshifted and do not coincide with the narrow core of H, the broad and narrow components can be relatively well decomposed. Errors in FWHM are typically less than 20%. At the same time, the two Gaussian components which make up the broad base of H are not well constrained individually. We therefore only report the FWHM of the sum of the two Gaussians that fit this component, and only report the total line flux, but no results on the two components separately.
The H regime was fit with five Gaussians, that match the components in H. (1) One Gaussian for the normal narrow H emission line, with its centroid redshift and width fixed to that of the corresponding H line. (2) Two Gaussians for the narrow horns, also with their centroids and widths fixed to that of H. (3) Two Gaussians for the broad component of H, with their centroids, widths, and the intensity ratio of the two Gaussians fixed to that of the broad component of H. The results of the decomposition are shown in Fig. 3.
The H and H complexes in the 2008 spectrum were fit using the same scheme as for the 2005 SDSS spectrum, but all the widths of the narrow lines (including the narrow horns) which are unresolved, were fixed to the instrumental broadening. The two Gaussians for the broad component were not fixed to the SDSS values, and indeed both the intensity and profile of H changed significantly between the two observations, with an intensity ratio of 0.35 between the ESO and SDSS observation. The broad H component is still asymmetric with excess emission in the red part of the line with a centroid shift relative to the narrow core of km s-1 (SDSS spectrum) in comparison to km s-1 ( spectrum), while the line width changed from FWHM km s-1 (SDSS) to FWHM 1500 km s-1 (). The broad component in H is no longer safely detected in the spectrum.
The remarkable narrow horns remained fixed in red/blueshift (at = 540 and km s-1, where a negative sign indicates blueshift), but got fainter (Tab. 2).
H is too faint for any decomposition, and we merely report results from a single Gaussian fit in Tab. 2.
2.2. JHK photometry
Photometry was performed with the 7-channel imager (Greiner et al. 2008) attached to the 2.2m telescope at La Silla in the filters g, r, i, z and J, H and Ks. The observations were carried out on 2008 January 1, at a seeing of 1′′. Each observation consisted of 4 exposures with 46 s each in the visual and 24 exposures with 10 s each in the NIR channels, giving an effective exposure time of 4 min in the NIR and 3 min in the visual. The images were flatfield and bias corrected using standard IRAF routines. While the images in the visual bands are simply stacked after astrometric registration, the NIR images are first distortion corrected and then co-added with the shift-and-add method of the jitter command in the eclipse package (Devillard 1997).
Results from g,r,i, and z were reported in paper I which showed that the luminosity of the galaxy core decreased by a factor 1.5-2 between the 2004 SDSS and the 2008 photometry. Here we add the NIR results. The J, H and Ks photometry was calibrated against the 2MASS measurement of 1998. Given the different spatial resolutions of and 2MASS, only the integrated emission can be compared. The total J,H and Ks entries listed in the 2MASS catalogue of extended objects and cited in NED (Skrutskie et al. 2006) are J,H,Ks = (15.4,14.5,14.4) mag. We have selected sources in the field of view which have comparable brightness as SDSSJ0952+2143, and have used these to perform the photometry. Given the faintness of the galaxy in the 2MASS exposure, we conservatively assign a photometric error of 0.5 mag. Within this error, the magnitudes are consistent with 2MASS.
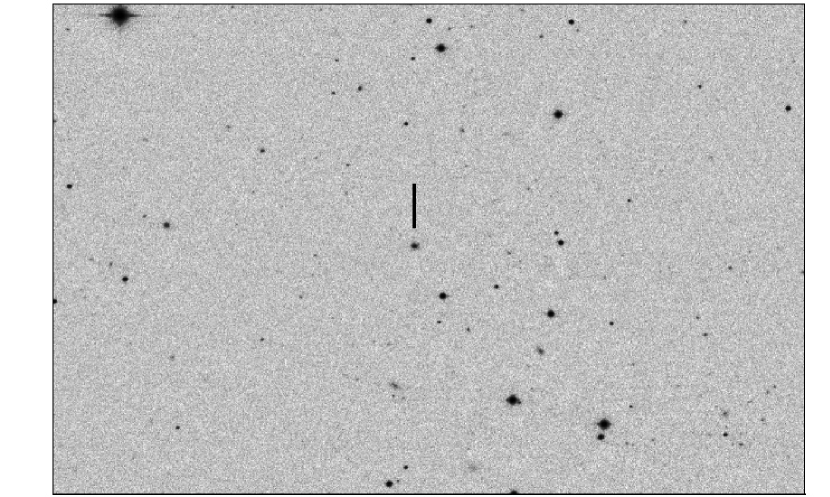
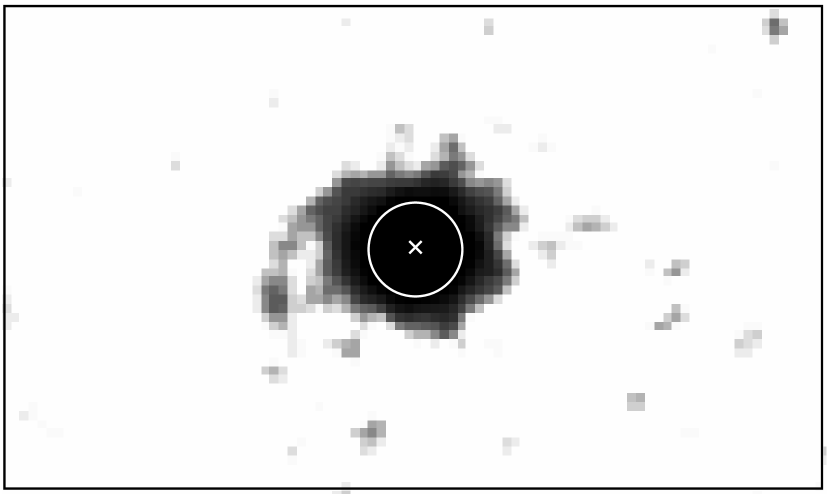
The J (H) coordinates of the galaxy centre (J2000), RA = 09:52:09.54 (09:52:09.56) and DEC = +21:43:13.2 (+21:43:13.3), are consistent with the SDSS position. Radial profiles of the host galaxy of SDSSJ0952+2143 in comparison with the PSF of nearby stars show that the emission from the galaxy can be traced out to a radius of 3–4′′ in the J band. Close inspection of the J,H,Ks images reveals the emergence of a spiral structure at faint emission levels in all three images (Fig. 5). Finally, we note that no other bright NIR source within a few arcseconds of SDSSJ0952+2143, which could have affected the 2MASS measurements, is detected (Fig. 5).
2.3. , and X-ray observations
SDSSJ0952+2143 was observed and not detected during the all-sky survey in November 1990. The upper limit on its PSPC countrate, 0.036 cts s-1, translates into an upper limit on its (0.1-2.4) keV X-ray luminosity of erg s-1 (assuming an X-ray powerlaw with photon index and no excess absorption above the Galactic value, cm-2).
The field of SDSSJ0952+2143 was also covered during an slew observation, slew 9044100004, on 2002 May 7. No photons from the source were detected, with an EPIC pn upper limit of 1.3 cts s-1. Again assuming a spectrum with and gives an upper limit on the (0.2-10 keV) X-ray luminosity of erg s-1.
SDSSJ0952+2143 was also not detected in X-rays during the BAT survey (Markwardt et al. 2005, Ajello et al. 2008). The upper limit from 3 years of BAT survey observations between March 2005 and March 2008 is erg cm-2 s-1 in the 15-55 keV band, or erg s-1 in the same band.
After the and detection of variability, we initiated a DDT observation (paper I; ObsId 9814) which was carried out quasi-simultaneous with the observation (Tab. 1). Had the source still been sufficiently bright in X-rays, this would have provided a unique chance to “reverberation-map” responses of the high-ionization lines to changes in the ionizing continuum. During the 10 ks ACIS-S observation, only faint X-ray emission was detected with a countrate of 7 10-4 cts s-1. Among the detected photons, 40% were above 3 keV; indicating a relatively hard X-ray spectrum, which is not strongly absorbed. Since the source is too faint to perform spectral fitting, we have used two characteristic models in order to estimate fluxes and luminosities. Assuming a spectrum with and gives an X-ray luminosity of erg s-1 (2-10 keV) and erg s-1 (0.1-10 keV). Using instead a thermal bremsstrahlung model with keV gives a similar (0.1-10 keV) luminosity of erg s-1. The X-ray source is located at RA=09:52:09.56, DEC=21:43:13.3 (J2000) and agrees well with the SDSS coordinates, and with the position. The astrometric accuracy of of 1′′ corresponds to a projected scale of 1.5 kpc within the host galaxy.
2.4. IR observations
In order to search for emission lines excited by the flare, we initiated a DDT observation of SDSSJ0952+2143 with the , which was carried out on 2008 June 5. The data also allow us to measure the IR SED, get clues on the type of host galaxy, and measure the post-flare IR luminosity, in comparison with previous measurements which indicated possible NIR variability (paper I). For few, if any, of such extreme transients as SDSSJ0952+2143, MIR spectroscopy was ever done.
The observation was carried out with the Short-High module (SH; wavelength range 9.9-19.6m) of the InfraRed Spectrograph (IRS; Houck et al. 2004). We used the standard staring mode, in which the target is placed at two nod positions within the slit. 10 spectra with 120 s duration each were taken at each nod position, amounting to a total on-source exposure time of 2438 s. An off-source position was observed in a similar way to provide a measure of the background.
The raw data were processed by the pipeline version 18.0.2 and the residual sky was subtracted from the resulting two-dimensional spectrum using the off-source observation. Bad pixels were removed and the areas then Poisson-smoothed. Subsequently, 1D spectra for each nod position were extracted from the Basic Calibrated Data with SPICE 2.1.2444http://ssc.spitzer.caltech.edu/postbcd/spice.html. The spectra from the two nods were co-added and the final spectrum is shown in Fig. 7.
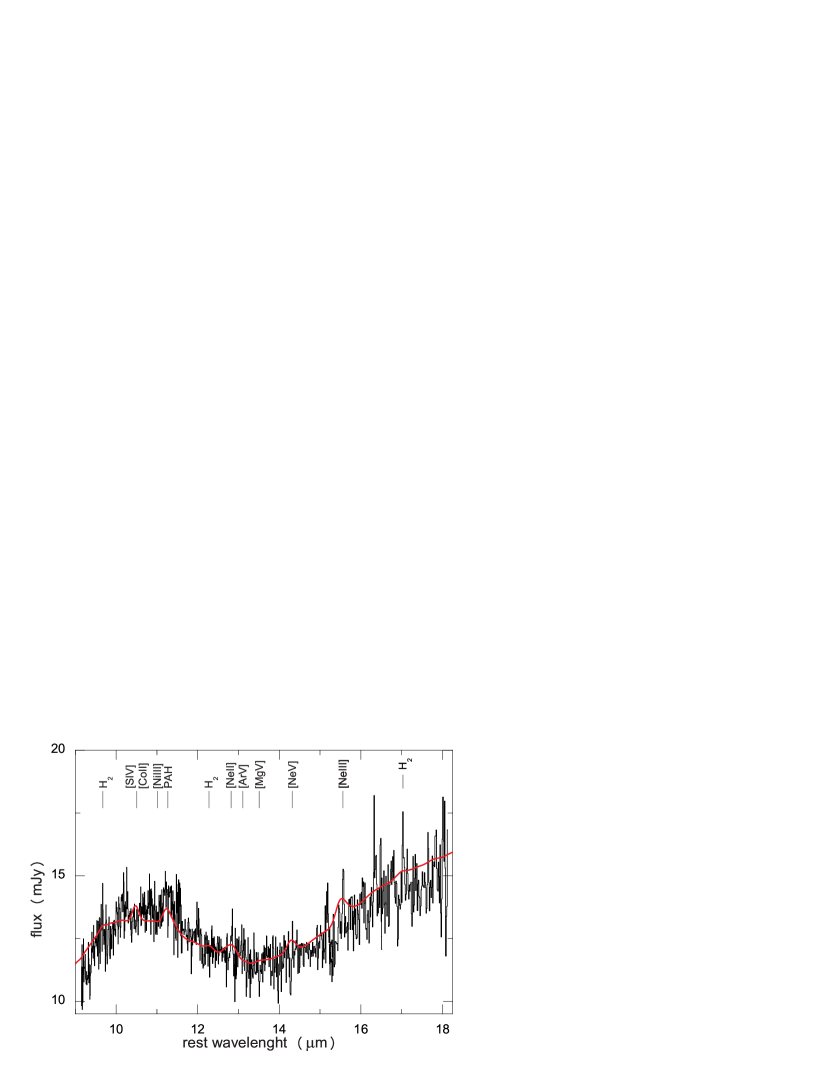
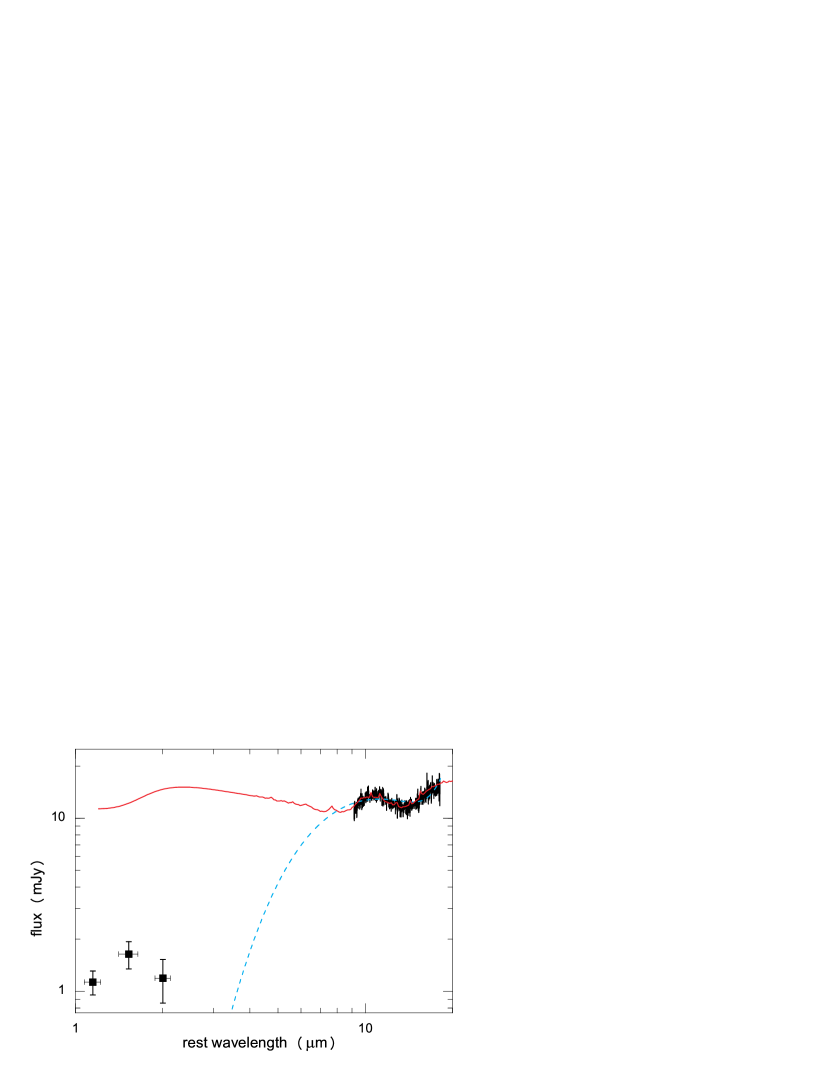
SDSSJ0952+2143 was detected with a flux density of 121 mJy at 12.5 m. The global SED indicates excess emission around 11 m, and an increase at longer wavelengths, and closely resembles the mean PG quasar IRS SED of Netzer et al. (2007; their Fig. 3). We have approximated the MIR SED by two black bodies (with =460K; the lower temperature of the second component is not well constrained). While this approximation is certainly too simple, we use this parametrization for an estimate of the luminosity. Integration over the narrow IRS SH band gives erg s-1, which is a safe lower limit on the total IR luminosity. Integrating over the higher-temperature black body component gives erg s-1.
We have searched for emission lines in the spectrum. These lines could either be excited by the flare, or else represent permanent emission from the host galaxy. As a guideline, we have paid attention to emission features which are commonly detected in the spectra of starburst galaxies, AGN and supernovae. Strong MIR lines frequently seen in AGN include [SIV]10.51m, [NeII]12.81m, [NeV]14.32m and [NeIII]15.56m, while occasionally [ArV]13.10m, [MgV]13.52m and [FeII]17.94m have been detected (e.g., Sturm et al. 2002, Netzer et al. 2007, Tommasin et al. 2008, Dale et al. 2009). The Polycyclic Aromatic Hydrocarbon (PAH; Puget & Leger 1989) feature at 11.25m is frequently present, too, together with some molecular Hydrogen lines. In SNe, transitions from Co and Ni have been detected (e.g., Roche et al. 1989, Kotak et al. 2006).
The relatively faint spectrum complicates the line searches. The enhanced fluctuations in the red part of the spectrum we trace back to noise. There is some evidence for the PAH feature at 11.25m, and emission lines of [NeII]12.81m and [NeIII]15.56m. In order to asses the reality of the Neon lines, we have extracted spectra from each nod position separately. There is evidence for these lines in both spectra. Other apparent features that appear in the spectrum coincide with regions of enhanced background noise. No strong emission from [NeV]14.32m is detected. A more rigorous search for faint features is deferred to a future publication. Here, we conservatively use the measured flux in [NeIII] as upper limit for any true line emission, which gives erg s-1.
3. Emission-line and continuum diagnostics
We now derive constraints on the physical conditions in the reprocessing material, which are later used in discussing outburst scenarios.
3.1. Forbidden lines
Generally speaking, the wide range of ionization states we see, and the very different critical densities of transitions among the narrow forbidden lines (e.g., [SII], [OI] and up to [FeXIV]), imply a wide range of densities in gas which is kinematically relatively quiescent with FWHMs of km s-1.
3.2. Multi-peaked Balmer-line profile
The Balmer-line profile is complex, and variable in time. It consists of several kinematical components: (1) A broad component with a redshifted peak. The profile slightly narrowed and the peak shift slightly changed between 2005 and 2008. (2) A narrow component with a width similar to other forbidden lines, consistent with being constant between 2005 and 2008. (3) Two peculiar narrow, unresolved, horns, which are present in H and H and which faded significantly between 2005 and 2008. We comment on each component in turn.
Broad component, Balmer decrement. As already remarked in paper I, the Balmer decrement is very large, indicating either optical depth effects or a dominant contribution from collisional excitation (heavy extinction is unlikely, since correction for it would boost the already high Balmer-line luminosity even further). The intensity ratio H/H changes from to between 2005 and 2008; H is no longer safely detected in the 2008 spectrum. The H luminosity during the 2005 SDSS observation is very large: erg s-1. It decreased by a factor 3 between 2005 and 2008. Assuming an average luminosity of 2 erg s-1 lasting for at least 3 years translates into an energy of at least erg in H only. While the broad H component may well be completely dominated by collisional excitation, the narrow components of H and [OIII] are still almost as luminous ( erg s-1) in 2008 as the detected X-ray emission. This either implies that the continuum source is partly obscured while the Balmer-line emitting region is not, or there is a strong EUV contribution to the SED, or we see time delay effects of a once brighter continuum. The broad H component is redshifted by 600 km s-1 in 2005 (paper I), and still by 300 km s-1 in 2008. This redshift likely reflects a true kinematic shift. If it was due to extinction or optical depth effects in a shell geometry, the receding, more distant, red part of the line would be more affected (which would cause an apparent blueshift of the centroid).
Narrow component. This component has similar width than other narrow lines. The Balmer decrement, H/H = 3.2 (2005) and 2.6 (2008) is close to the Case B recombination value, indicating little global extinction along the sightline within the host galaxy of SDSSJ0952+2143. The luminosity of H, erg s-1, can be used to estimate the emitting volume in dependence of gas density and temperature. Under photoionization Case B conditions (Osterbrock 1989), and assuming K, a density of as in the [SII] emitting region (see Sect. 3.4 below) would imply an emitting volume with a size of =50 pc, while implies =2 pc. The observed H luminosity further implies a minimum rate of H-ionizing photons of s-1 assuming full covering of the continuum source.
Narrow horns. Apart from the broad base and narrow core, the Balmer lines show a remarkable extra structure in form of two very narrow, unresolved, horns. These horns do not have any counterparts in any other emission lines, and our new spectrum shows that they do vary between the 2005 SDSS observation and the 2008 observation, and have become significantly fainter. The absence of the horns in other emission lines may be a consequence of high density. However, some coronal lines have very high critical density and are still not detected. Alternatively, the lines may form in collisionless shocks. These shocks produce strong Hydrogen lines with a two-component profile consisting of a narrow component contributed by cold Hydrogen atoms, and a broad component from Hydrogen atoms that have undergone charge transfer reactions with hot protons while other optical forbidden lines are very faint (e.g., Raymond 1995, Heng & McCray 2007). The flux ratio of broad over narrow component depends on the shock velocity. In order to see whether there is extra components in the broad Balmer lines of SDSSJ0952+2143 matching the narrow horns, higher S/N observations are needed. The line shape (double-peaked profile) could arise in the case of two colliding streams of gas, in this case moving at a few hundred km s-1; or alternatively in a two-sided jet or ring morphology or a bipolar outflow, and will be further discussed below.
3.3. Coronal lines
Several flux ratios of emission lines of iron are of diagnostic value, since they are temperature and/or density sensitive (e.g., Nussbaumer & Storey 1982, Keenan & Norrington 1987). The ratio [FeVII]3759/[FeVII]6087 was used in paper I for a first estimate of the temperature of the emitting gas. The ratio reported in paper I was based on total line fluxes. Here we have decomposed both lines into a broad and a narrow component (Sect. 2.1.4) and remeasured the line ratio, which gives [FeVII]3759/[FeVII]6087=0.9 for the broad component and [FeVII]3759/[FeVII]6087=0.7 for the narrow component in 2005. These ratios imply gas temperatures in the range K for the gas which emits the broad component, and K for the gas which emits the narrow component (Keenan & Norrington 1987). [FeVII]3759 could not be decomposed into two components in 2008. The inferred temperatures are consistent with a photoionization origin of the emission lines. Further, the widths of the narrow iron-line cores, of order 200 km s-1 or less, argue against direct collisional ionization by shocks, since a minimum shock velocity of 300 km s-1 is required to collisionally ionize Fe10+ (Viegas-Aldrovandi & Contini 1989). This statement does of course not exclude the presence fast radiative shocks (Sutherland & Dopita 1995, Dopita & Sutherland 1996) which produce local ionizing radiation which can then photoionize low-velocity pre-shock gas. In that case, the degree of ionization would be higher in the ambient pre-shock gas than in the cooling post-shock gas. In situ production of the ionizing radiation also ensures efficient reprocessing into emission lines.
The ratio [FeVII]5158/[FeVII]6087 = 0.2 in 2005 implied an electron density , while its decrease to [FeVII]5158/[FeVII]6087 0.06 in 2008 implies a higher density (Keenan & Norrington 1987)555note remaining uncertainties in the collision strengths of [FeVII]; e.g. Sect. 3.3 of Ferguson et al. 1997.. Further, it is reasonable to assume that the bulk of the iron emission lines should be emitted from gas below the critical density, which is 3 107 cm-3 for [FeVII]6087, and 109 cm-3 for [FeX] and [FeXI].
The 2008 line luminosity of [FeVII]6087, erg s-1, is almost as high as the simultaneously measured soft X-ray luminosity, implying that we either only see a fraction of the produced soft X-ray luminosity (the rest being completely absorbed), or that a strong EUV excess is present, or else that we still see the echo from a once brighter flare. Since the recombination timescale in the high-density coronal-line-emitting gas is very short (at K and , the Hydrogen recombination time scale is on the order of 10 d), light travel time effects would then have to play a role.
3.4. [SII] ratio
The emission-line intensity ratio [SII]6716/[SII]6731 is sensitive to density (Osterbrock 1989, Dopita & Sutherland 2003). The measured ratio, 1.3 in 2005 and 1.1 in 2008, indicates densities of cm-3 and cm-3, respectively (at T=104 K). [SII] therefore signals gas of much lower density than indicated by the coronal lines.
3.5. The strength of [OIII]4363/5007
The great strength of [OIII]4363/5007 in 2005 and 2008 significantly exceeds the value typically observed in Seyfert galaxies and is above photoionization predictions for a large parameter space (e.g., Fig. 9 of Komossa & Schulz 1997, Groves et al. 2004). The observed value implies that we are beyond the low-density regime so that the ratio no longer only depends on temperature, but also becomes density sensitive (Osterbrock 1989, Dopita & Sutherland 2003). For a temperature of K the ratio implies a density on the order of (Dopita & Sutherland 2003).
3.6. NIR emission
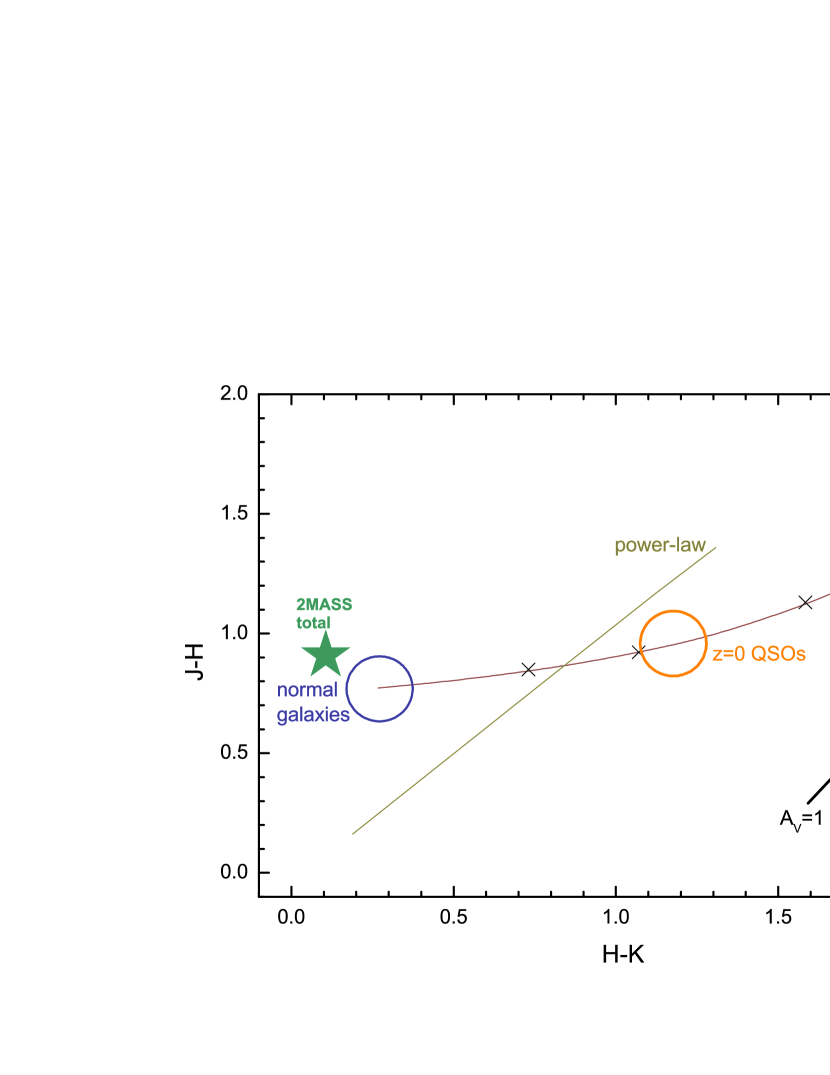
Given that the 2MASS measurements most likely represent the host galaxy emission prior to the outburst we have used the NIR colours to determine the nature of the host galaxy. The values of J-H=0.9 mag and H-Ks=0.1 mag locate SDSSJ0952+2143 in the area typically populated by non-active galaxies in two-colour diagrams (e.g., Hyland & Allen 1982, Willner et al. 1984, Glass & Moorwood 1985, Alonso-Herrero et al. 1996; our Fig. 6).
3.7. MIR SED
The global SED of SDSSJ0952+2143 indicates excess emission around 11 m, and an increase at longer wavelengths, and closely resembles the mean PG quasar IRS SED of Netzer et al. (2007; their Fig. 3). The bumps in those quasar spectra are traced back to silicate emission (see also Schweitzer et al. 2006, and references therein). The extrapolation of the observed MIR SED falls well above the NIR emission (dominated by the extended host) by an order of magnitude (Fig. 8), implying that the IR emission of SDSSJ0952+2143 is completely dominated by relatively cold dust – unlike quasar spectra which commonly show a significant emission component around a few m from relatively hot dust, heated by the radiation from the AGN accretion disk. The observed MIR emission is extraordinary luminous, with erg s-1 in the narrow IRS SH band. The relatively low mass of the SMBH of the host galaxy of SDSSJ0952+2143, M⊙ (paper I; see our Tab. 3), implies that the observed 10-20m luminosity is already 1/25 of the Eddington luminosity.
With only one MIR spectrum at hand and no imaging information, there is currently two possibilities to explain the MIR emission. Either we see temporary emission from dust heated by the flare, or else this is permanent emission from a starburst region. The observed MIR luminosity is comparable to that of nearby IR selected Seyfert galaxies (e.g., Tommasin et al. 2008), so quite luminous. At the same time, we do not see evidence for a young stellar population in the optical spectrum. So, if the MIR emission was permanent, the starburst region would then have to be completely obscured in the optical band.
Within the limits of the black body approximation, we can estimate the size of the emission region. For the given black body temperature and MIR luminosity, we obtain a radius of the emission region of 0.5 pc.
We do not have tight constraints on the geometry of the dust distribution. However, the lack of reddening of the narrow Balmer lines implies that the dust is not in a spherical shell around this line-emitting region; and the strength of the coronal lines implies that this region is free of silicates, otherwise Fe would be heavily depleted onto dust grains.
4. Discussion
4.1. Outburst mechanisms
The strong emission-line and the low-energy continuum variability of SDSSJ0952+2143 are the consequence of a high-energy outburst which was itself not observed. The emission-line and continuum variability encompassing several wavebands and forbidden and allowed emission lines, are unique among variability associated with the cores of galaxies.
Several different outburst mechanisms can potentially produce the very unusual emission-line signatures of SDSSJ0952+2143. We briefly introduce them in this section, and then come back to each of them in more detail in the following subsections. (1) An accretion disk around a SMBH will produce ionizing radiation that is reprocessed by surrounding gas clouds into characteristic broad and narrow emission lines which are commonly observed in the spectra of AGN (Osterbrock 1989). Changes in the accretion rate for instance in form of a disk instability could lead to highly variable continuum emission and excite the unusual emission lines (Sect. 4.2). (2) A flare of electromagnetic radiation can be produced from the temporary accretion disk formed by the debris of a star tidally disrupted by a supermassive black hole in the core of SDSSJ0952+2143. As the ionizing radiation travels through the nucleus, emission lines originate in the ISM and also in part of the stellar debris itself (Sect. 4.4). (3) A fraction of supernovae emit significant X-ray radiation, which likely originates in shocks driven into the circumstellar medium (CSM) by the SN ejecta. This radiation ionizes ambient gas, including the SN ejecta, the (clumpy) progenitor wind and the ISM. These components then emit broad and sometimes also narrow emission lines (Sect. 4.3). A small fraction of SN spectra look surprisingly similar to those of AGN (e.g., Fig. 6 of Filippenko 1989, Fig. 1 of Terlevich & Melnick 1988), even though essentially all AGN and SN spectra look very different from SDSSJ0952+2143.
Finally, there is a region of parameter space where the mechanisms (1)-(3) discussed above overlap; including SNe exploding in gas-rich AGN cores, stellar tidal detonations, and flung-out stellar tidal debris interacting with the ISM (Sect. 4.5).
4.2. AGN outburst
Some fraction of all AGN show coronal line emission in their optical spectra (e.g., Seyfert 1943, Penston et al. 1984, Oliva et al. 1994, Binette et al. 1997, Nagao et al. 2000, Mullaney & Ward 2008). The large majority of these coronal lines are constant or, very rarely, show slight variability (e.g., Netzer 1974, Veilleux 1988). Only one, the active galaxy IC3599 (Brandt et al. 1995, Grupe et al. 1995, Komossa & Bade 1999), has shown strong transience in its coronal lines. In response to a luminous X-ray flare, several bright emission lines appeared and then faded on the timescale of years. The total amplitude of variability is large and the X-ray spectrum is very soft, both in high-state and low-state (Brandt et al. 1995, Grupe et al. 1995, Vaughan et al. 2003). A change in accretion rate (perhaps due to a disk instability or due to stellar tidal disruption) is a likely explanation of these observations (Brandt et al. 1995, Grupe et al. 1995).
Clearly, with its strong coronal lines and dramatic line variability, SDSSJ0952+2143 is different from AGN in general, and is more extreme than IC3599 in its broad-band emission-line and continuum response.
If a high-amplitude outburst occurred in an AGN, different emission-line regions – the broad line region (BLR), coronal line region (CLR) and narrow line region (NLR) – would be illuminated at different times, and will respond with different recombination timescales. Consequently, “outburst spectra” could look significantly different from equilibrium spectra. The range of densities inferred from the emission-line spectrum of SDSSJ0952+2143 is consistent with indications for local density inhomogeneities in the classical NLR of AGN (e.g., Komossa & Schulz 1997, Brinkmann et al. 2000).
As noted in paper I, the ratio [OIII]/H formally places SDSSJ0952+2143 at the border between AGN and LINERs in diagnostic diagrams; but given the variability of most or all emission lines, this cannot at all be used as a classification of the galaxy.666If we momentarily assume that the [OIII] emission is permanent and use the known correlation between [OIII] luminosity and X-ray luminosity among AGN of Heckman et al. (2005, see also Netzer et al. 2006), we predict a (2-10) keV X-ray luminosity of erg s-1; higher than observed by more than one order of magnitude. In terms of emission-line ratios, the classification of SDSSJ0952+2143 as active or inactive galaxy in quiescence therefore remains unknown at present.
However, the pre-flare 2MASS colours indicate a non-active galaxy, the low-state X-ray flux measured with does not hint at the presence of a permanent AGN (except possibly a low-luminosity AGN), and the optical spectrum barely has a detectable non-stellar component. We therefore consider the presence of a classical AGN at the core of SDSSJ0952+2143, which underwent an unusual outburst, very unlikely.
4.3. Supernova explosion
4.3.1 Supernovae of type IIn
One subclass of supernovae, those of type IIn (Schlegel 1990) show narrow emission lines preferentially from Hydrogen and Helium in their optical spectra in addition to broad lines (see Filippenko 1997 for a review; his Fig. 14)777SNe of this type are, e.g., SN 1987F (Wegner & Swanson 1996), SN 1988Z (Stathakis & Sadler 1991, Turatto et al. 1993, Aretxaga et al. 1999), SN 1995G (Pastorello et al. 2002), SN 1995N (Fransson et al. 2002), SN 1994W (Chugai et al. 2004), SN 1997eg (Hoffman et al. 2008), SN 1998S (Leonard et al. 2000), SN 2005gl (Gal-Yam et al. 2007), SN 2006tf (Smith et al. 2008a), and SN 1997cy (Germany et al. 2000, Turatto et al. 2000). We note in passing that SNe associated with GRBs are typically of type Ic which lack Hydrogen features in their optical spectra.. These lines are interpreted as a result of strong interaction of the SN ejecta with dense CSM (e.g., Chugai 1990, Chugai & Danziger 1994). Only a few SNe are known which exhibit coronal lines (e.g., SN 1988Z: Turatto et al. 1993, SN 1993J: Garnavich & Ann 1994, SN 1995N: Fransson et al. 2002, SN 1987A: Gröningsson et al. 2008, SN 1997eg: Hoffman et al. 2008, SN 2005ip: Smith et al. 2009) and detection of ionization states as high as [FeXIV] is very rare. According to Smith et al. (2009), SN 2005ip is unprecedented in the way the coronal lines dominate the optical spectrum of that SN.
Several SNe IIn are also relatively X-ray luminous,
exceeding 1040 erg s-1
(e.g., SN 1988Z: Fabian & Terlevich 1996, Aretxaga et al. 1999,
Schlegel & Petre 2006; SN 1986J: Bregman & Pildis 1992, Temple et al. 2005;
SN 2006jd: Immler et al. 2007; see
Schlegel 1995, 2006, and Tab. 1 of Immler
2007888see
http://lheawww.gsfc.nasa.gov/users/immler/supernovae_
list.html maintained by S. Immler for updates
for overviews).
Strong ionizing radiation may originate from the shock break-out,
Compton-upscattering, and in shocks when SN ejecta collide
with the precursor wind and/or the ISM.
A number of type IIn SNe show excess emission in the NIR, plateaus in their NIR
lightcurves, and characteristic variability of their Balmer-line profiles.
These properties have been traced back to the presence of dust; either pre-existing
dust which is heated collisionally or radiatively after the SN explosion,
or newly formed dust which coagulated after the SN explosion in cool, dense regions
(e.g., Merrill 1980, Lucy et al. 1989, Roche et al. 1989, Moseley et al. 1989, Wooden et al. 1993,
Gerardy et al. 2002, Pozzo et al. 2004, Sugerman et al. 2006, Meikle et al. 2006,
Smith et al. 2008b, Fox et al. 2008 and references therein).
There are several key sites of emission line formation. The radiation produced in the shocks will ionize the surrounding ISM, the stellar wind of the SN precursor and the high-density SN ejecta themselves. The narrow lines likely arise in the CSM (sometimes in the ISM); while broad lines likely come from the SN ejecta (e.g., Chugai & Danziger 1994, Filippenko 1997). Generally, SNe of type IIn show substantial heterogeneity with respect to their luminosities and emission-line properties. They are relatively rare, comprising only a few percent of all core-collapse SNe (Gal-Yam et al. 2007, Smartt et al. 2009).
4.3.2 Super-luminous iron lines, and comparison with SN 2005ip and SN 1988Z
Given similarities of the optical spectra of SDSSJ0952+2143 first presented in paper I with the recently published remarkable spectra of the type IIn supernova SN 2005ip (Smith et al. 2009; S09 hereafter), we consider an origin of SDSSJ0952+2143 in terms of a similarly unusual supernova. S09 reported very strong coronal lines including a large number of transitions, and ionization states up to [FeXIV], with a peak luminosity (at day 93) in [FeXIV] of erg s-1. SN 2005ip and several other type IIn SNe also show high ratios of [OIII]4363/[OIII]5007, broad Balmer lines with widths of at least (one – several) thousand km s-1 and very high Balmer decrements (up to 25 in the case of SN 2005ip). The peak luminosity of SN 2005ip was only modest with an (unfiltered) absolute magnitude of –17.4 (S09).
SDSSJ0952+2143 is phenomenologically similar in several of its emission-line properties, especially line ratios, but much brighter in the optical, and brighter in X-rays, and, in particular, much more luminous in the coronal lines. According to S09, SN 2005ip is the SN with the strongest iron coronal lines, in the way they dominate the spectrum of that SN. The luminosity in the high-ionization coronal lines of SDSSJ0952+2143 is a factor of 100 higher (!) than the highest value measured in SN 2005ip (S09) and in SN 1988Z (Turatto et al. 1993) and it is a factor 103 higher than in SN 1995N (Fransson et al. 2002), and a factor 104 higher than in SN 1993J (Garnavich & Ann 1994).999Note that only few spectra of SDSSJ0952+2143 exist; its peak line luminosity could have therefore been even higher.
In the context of an SN interpretation, SDSSJ0952+2143 therefore is the SN with the most luminous iron coronal lines. SDSSJ0952+2143 is also among the very luminous SNe II in terms of continuum emission (c.f. Fig. 3 of Smith et al. 2008a), with an R magnitude of –20.8 mag in 2004 (including emission from the host galaxy, but likely dominated by the transient), and it almost rivals the “hypernova” SN1997cy (Turatto et al. 2000, Pastorello et al. 2002) in its large H luminosity. In the context of the SN scenario, the density of the forbidden line-emitting gas of SDSSJ0952+2143, , is consistent with a clumpy progenitor wind and/or ISM (but could also imply SN explosion into a star-forming region), the lowest-velocity gas with the pre-shock wind speed of an LBV progenitor (e.g., Humphreys & Davidson 1994, Smith et al. 2008a).
On the other hand, there are also significant spectral differences between SDSSJ0952+2143 and SN 2005ip (and other similar SNe), for instance: (1) No HeI transitions are detected in our spectra; neither broad nor narrow, whereas they are frequently seen in SNe. (2) The narrow horns in the Balmer lines of SDSSJ0952+2143 are unusual (but see below). (3) The profile asymmetry of H of SDSSJ0952+2143 is opposite to that sometimes seen in SNe (which show apparent blueshifts; often traced back to stronger extinction in the red part of the line from the far side of the SN ejecta; e.g., Lucy et al. 1989, S09).
Regarding the narrow horns in the Balmer lines, it is interesting to note a potential similarity with SN 1998S, which showed a double-horned profile (Garnavich et al. 1998), traced back by Gerardy et al. (2000) to the presence of interacting dense clumpy circumstellar gas with a ring-like morphology. However, they measured the three peaks at velocities of -4900, -400 and +3300 km s-1; at much wider velocity separation than the peaks of SDSSJ0952+2143. The lines are also much broader in SN 1998S.
4.3.3 Luminous X-ray emission
indicates a relatively hard X-ray spectrum of SDSSJ0952+2143, frequently seen in SNe (thermal spectra with temperatures of several–10 keV). The observed X-ray luminosity of SDSSJ0952+2143 is higher than that of most other known SNe. Only 40 SNe are X-ray detected at all (according to Tab. 1 of Immler 2007, and adding recent detections) and only a handful of them are more luminous than 1040 erg s-1. One of the most luminous (long-duration) X-ray emitting SNe is SN1988Z (Fabian & Terlevich 1996), at erg s-1. SN 2005ip was detected at erg s-1 (0.2-10 keV, at day 461; Immler & Pooley 2007). If of SN origin, SDSSJ0952+2143 is one of the most distant X-ray detected, and one of the most X-ray luminous SNe known.
Perhaps the tightest constraints on any SN-based outburst scenario are set by the huge luminosities in the narrow emission lines. The luminosity in the highest ionization coronal lines implies very luminous intrinsic soft X-ray emission under photoionization conditions. So far, line luminosities erg s-1 as in SDSSJ0952+2143 have only been observed in AGN (e.g., Nagao et al. 2000, Mullaney & Ward 2008). While the ionization potentials of [FeVII]-[FeXIV] (0.1-0.4 keV) fall in the X-ray regime, it is not straight-forward to convert the observed coronal line luminosities into X-ray luminosity, since two processes contribute to the line excitation, collisional excitation and resonance fluorescence by UV photons (e.g., Osterbrock 1969), and since atomic parameters are still relatively uncertain (e.g., Pelan & Berrington 1995, Mohan et al. 1994, Oliva 1997, Berrington 2001). In AGN, the observed coronal line luminosity is approximately 0.1% (-1%) of the observed X-ray luminosity. If the line formation efficiency was similar under SN conditions, in the case of SDSSJ0952+2143 this would imply an intrinsic soft X-ray luminosity on the order of at least 1042-43 erg s-1. No such X-ray luminous SN has ever been observed (or identified as such) [the luminous X-ray emission of SN 2008D only lasted for seconds-minutes; Soderberg et al. 2008]. An SN explosion into a dense medium (Wheeler et al. 1980, Shull 1980) was invoked to explain the luminous X-ray emission of SN 1988Z (Fabian & Terlevich 1996), but it is very difficult to reach luminosities of 1042-43 erg s-1 by this mechanism (Komossa & Bade 1999).
4.3.4 Luminous IR emission
Few SNe have MIR measurements and spectroscopy in particular (e.g., Kotak et a. 2006, Gerardy et al. 2007). SN 1987A is the best-studied exception (e.g., Roche et al. 1989, Moseley et al. 1989, Wooden et al. 1993). Its MIR SED is relatively flat, indicating that it is dominated by an almost featureless dust component (Wooden et al. 1993), perhaps graphite (Moseley et al. 1989). The characteristic structure of the spectrum of SDSSJ0952+2143 indicates the presence of silicates. The MIR emission is extraordinarily luminous, with at least erg s-1. This compares to other IR luminous SNe which only reached up to several 1040-41 erg s-1 in the NIR (e.g., Gerardy et al. 2002, Pozzo et al. 2004), while the most luminous SNe ever observed reached peak luminosities of few erg/s in the optical band (e.g., Quimby et al. 2007).
The black body radius inferred from the MIR emission of SDSSJ0952+2143 (Sect. 3.7) corresponds to 0.5 pc. This is much larger than the distance, the SN ejecta could have travelled within several years and implies that we see an infrared light echo of pre-existing dust. The huge MIR luminosity raises the question whether we instead see permanent emission from a dusty star-forming region. We cannot entirely rule out this possibility, but it is unlikely because a luminosity of similar magnitude was inferred from the presence of the [FeVII] coronal lines in the previous Section, and this (UV–X-ray) radiation is a plausible heating source of the dust. We therefore expect that the dust emission maximum continues to shift further towards the FIR as the dust cools and the incident radiation fades away. A new IR observation with or the would allow us to check whether this trend indeed exists.
4.3.5 Location and environment
A dense environment of SNe of type IIn is usually invoked to explain the luminous continuum radiation of several of these SNe, and is also inferred from emission-line characteristics. The densities we derive are consistent with such an interpretation. A dense environment of SDSSJ0952+2143 is also consistent with the strong MIR light echo from dust, and with the location of the transient within the galaxy core where dense gas is plausibly most abundant. At the same time, the blueness of the optical powerlaw continuum and the colours argue against heavy extinction along the line of sight. This would then locate the event at the edge of a molecular cloud complex, where most dust directly along our line of sight was destroyed by the bright flare. Finally, we note that the evidence for spiral structure in the images is not inconsistent with a SNII interpretation; type IIs have not yet been observed in elliptical galaxies (Capellaro et al. 1999).
4.4. Transient accretion event in a non-active galaxy
Given the extreme luminosity requirements in the context of an SN scenario, we now return to accretion power as energy source. Since there is no evidence for classical permanent AGN activity in SDSSJ0952+2143 in the form of a permanent optical and X-ray bright accretion disk, we focus now on the possibility of a temporary accretion event in a non-active galaxy, for instance by accretion of a molecular cloud or the tidal disruption of a star. These events could similarly happen in a low-luminosity AGN the presence of which we cannot yet exclude. In the latter, an accretion disk instability could also temporarily enhance the accretion luminosity. That said, we mostly concentrate on the tidal disruption scenario in what follows.
Interestingly, all of the observed emission-line and continuum properties can also potentially be understood in the context of a stellar tidal disruption event; where a star is disrupted in a gas-rich core environment.
4.4.1 Tidal disruption of a star by a SMBH
A star approaching a SMBH will be tidally disrupted once the tidal forces of the SMBH exceed the star’s self gravity. A fraction of the stellar debris will subsequently be accreted, producing a luminous flare of radiation (e.g., Hills 1975, Young et al. 1977, Gurzadian & Ozernoi 1981, Luminet 1985, Rees 1988, Evans & Kochanek 1989, Laguna et al. 1993, Li et al. 2002, Gomboc & Cadez 2005, Ivanov & Chernyakova 2006; see Komossa 2002 for a much longer list of references on theoretical aspects of tidal disruption) peaking in the X-rays or UV and lasting on the order of months to years.
X-ray variability, up to factors of 6000, has been almost exclusively detected in non-active galaxies, and these events represent the best observational evidence to date for the process of tidal disruption of stars by SMBHs (e.g., Komossa & Bade 1999, Halpern et al. 2004, Komossa et al. 2004). The tidal disruption candidates reached huge X-ray luminosities up to at least erg s-1 and show a lightcurve which jointly declines as , as predicted in some variants of tidal disruption models (e.g., Rees 1990). A few events in the UV shared similar properties with these X-ray events [similar decline law based on well-covered light curves, possibly soft X-ray spectrum, and (much lower) UV amplitude of variability of a factor of a few] and were thus interpreted along the same lines (Gezari et al. 2008; see also Renzini 2001, Stern et al. 2004). None of the tidal disruption flares so far observed from non-active galaxies had an emission-line “light echo” detected, but optical follow-up spectroscopy has typically only been obtained several years after the flare (Komossa & Bade 1999, Komossa & Greiner 1999, Grupe et al. 1999, Greiner et al. 2000, Gezari et al. 2003, 2008, Esquej et al. 2008, Cappelluti et al. 2009).101010A few events of unusual broad line variability in AGN and LINERs have sometimes been linked to accretion events including tidal disruption; for instance the transient broad double-peaked Balmer lines of NGC 1097 (Storchi-Bergmann et al. 1995, Eracleous et al. 1995, Storchi-Bergmann et al. 2003) and the transient broad HeII line of NGC 5548 (Peterson & Ferland 1986). We also note that faint high-ionization [OIII] emission detected in the post-flare spectrum of NGC 5905 (Gezari et al. 2003) could have well been excited by the flare, rather than representing permanent low-level activity.
Apart from the accretion of stellar debris which causes the powerful X-ray flares, in the course of a tidal disruption event, ionizing radiation will also be released in shocks during stream-stream collisions (Kato & Hoshi 1978, Rees 1988, Lee et al. 1996), and during collisions of the ejected stellar debris with the ISM (Kokhlov & Melia 1996, Ayal et al. 2000).
4.4.2 Emission-line light echoes
The radiation from accretion and other processes will ionize any surrounding gaseous matter in the galaxy core: (1) the interstellar medium of the host galaxy, including the gas clouds of BLR, NLR, CLR and torus, if present, and (2) the gaseous debris of the star itself which would be of very high density, show a spread in densities, have asymmetric spatial distribution, and may well have an unusual chemical composition.
A tidal disruption flare would therefore enable an extreme application of “reverberation mapping” where all gaseous material responds to one single flare (Blandford & McKee 1982) rather than a complicated lightcurve. This is of special interest with application to the cores of active galaxies, for instance to map the response of the molecular torus. It is also of interest with respect to non-active galaxies, because it would tell us which of those gaseous components typically detected in active galaxies (like the BLR) are still present in non-active galaxies. Once applied to a large number of galaxies, this method might also provide a new route of addressing the nature and velocity field of the gas that fuels SMBHs.
Predictions of how emission-line spectra excited by tidal disruption flares should look like in detail, do not yet exist and are complicated by the time dependence of the ionization; early spectra would be dominated by high-ionization emission lines, while lines like HeII and some low-ionization lines would persist especially long (e.g., Binette & Robinson 1987) after the flare, when [OIII]5007 has already faded. 111111Photoionization modelling of the coronal lines of the flaring galaxy IC3599 has shown that gas with a density of 109 cm-3 and a column density of 1023 cm-2 (conditions similar to the outer BLR or CLR in AGN) can produce the observed line ratios (Komossa & Bade 1999). In addition, the strong soft excesses seen in tidal disruption candidates (Komossa 2002) boost the coronal lines in strength.
After the tidal disruption of a star, streams of tidal debris would form, spreading over a number of orbits. This would result in complex multi-peaked Balmer emission-line profiles in the early phase of disruption (days to months; Bogdanovic et al. 2004). After that, line profiles would change less rapidly, and would represent a superposition of different components of the tidal debris, which would respond to the time-dependent illumination from the central accretion disk. Simulations of the stellar disruption process (e.g., Evans & Kochanek, Laguna et al. 1993, Ayal et al. 2000, Gomboc & Cadez 2005) have shown that approximately 75% of the stellar debris is unbound after first pericentre return. The innermost bound debris circularizes quickly, while the rest is spread over a number of eccentric orbits. Such a configuration might explain the broad component in H and its peak shift on the timescale of years, while the high density of the stellar debris would explain the large Balmer decrement. At the same time, the line luminosity cannot easily be explained within this scenario (see Sect. 3.2). Stream-stream collisions between returning debris and more tighlty bound gas might produce double-horned profiles like the one we observe (see the discussion on collisionless shocks in Sect. 3.2), but we would expect much stronger profile variability on the timescale of years than is actually observed (while the narrow horns of SDSSJ0952+2143 do vary in intensity, the velocity separation of the two peaks did not change within the errors). Alternatively, the double-horned emission could represent narrow streams of unbound debris (viewed from a special direction, since line centroid shifts are small). Other geometries which could produce double-horned profiles involve a jet or bipolar outflow component; the small line width and peak separation would require a special viewing angle.
The unbound stellar tidal debris will be flung out from the system at high speed and when interacting with the ISM could cause effects similar to a supernova remnant (SNR) but much more powerful (Khoklov and Melia 1996). While the available kinetic energy could be much higher than in a SN, the mechanism only works efficiently if the escaping debris forms a narrow stream rather than a broad fan (see the discussion in Khoklov & Melia 1996).
The estimated radius of the infrared light echo, 0.5 pc, is consistent with the expected location of molecular gas in the galaxy core. Based on the black hole mass of the host galaxy, and applying typical scaling relations known in active galaxies (Elitzur 2007), the inferred size of the emission region is comparable to the molecular torus. Any dust mixed with gas at distances much closer to the nucleus would have been destroyed by the bright flare. The fact that we see silicate emission rather than absorption features further implies that we have a relatively unobscured view into the galaxy.
4.4.3 Overall energetics
Tidal flares might be well powered by Eddington-limited accretion shortly after the disruption. Assuming a decline law (e.g., Rees 1990, Komossa & Bade 1999) for the luminosity evolution after disruption, and extrapolating backwards in time starting with the observed X-ray luminosity in 2008, the predicted luminosity is still below the Eddington luminosity in 2004, consistent with tidal disruption. Given uncertainties in the decline law and the EUV part of the continuum, this estimate is uncertain by at least one order of magnitude. We note in passing that the observed X-ray spectrum of SDSSJ0952+2143 is much harder than the previously observed, very soft, tidal flares (e.g., Komossa & Bade 1999).
4.5. Links between Supernovae, tidal disruption, and GRBs
There might well be a region of parameter space where the mechanisms discussed in previous Sections are related: It has long been pointed out, and re-confirmed in recent studies, that high penetration factors of stars approaching SMBHs could ignite nuclear burning in the stellar core (including especially white dwarfs) and thus trigger an SN explosion121212Most of these events would occur strictly in galaxy cores even though tidal disruption/detonation of stars around recoiling SMBHs (Komossa & Merritt 2008) and white dwarf tidal detonation by intermediate-mass BHs (Rosswog et al. 2008) could happen offnuclear. (e.g., Carter & Luminet 1982, Bicknell & Gingold 1983, Luminet & Marck 1985, Luminet & Pichon 1989, Frolov et al. 1994, Dearborn et al. 2005, Brassart & Luminet 2008, Rosswog et al. 2008). In that case, the collisions of the ejected stellar debris with the ISM could be even more powerful than in a classical SNR (Khoklov & Melia 1996). Variants of tidal disruption and detonation have also been employed to explain certain classes of GRBs (e.g., Carter 1992, Lu et al. 2008, Brassart & Luminet 2008). Among the GRBs, a few appear to be associated with SNe (of type Ic) (e.g., SN 1988bw/GRB980425: Galama et al. 1998, SN 2003dh/GRB030329: Hjorth et al. 2003, SN 2006aj/GRB060218: Mazzali et al. 2006; see Woosley & Bloom 2006 for a review).
We have checked the data base131313http://www.mpe.mpg.de/jcg/grbgen.html of well-localized (better than 1 degree) GRBs since 1997 in order to see whether any GRB was recorded from the direction of SDSSJ0952+2143. This includes GRB detections by HETE II, BeppoSAX, INTEGRAL, , AGILE, Fermi-LAT and the Interplanetary Network. None was found within 10 degrees. However, we note that the temporal coverage of the field was below about 25%. SN (in dense media) and GRB-related models have also been discussed by Komossa & Bade (1999) for the tidal disruption candidate NGC 5905, but were not favored.
Another interesting phenomenon is a SN exploding in an “AGN-like” gaseous core, e.g., in or near a BLR or NLR cloud, or the molecular torus. This would complicate emission-line modelling, and if not identified as such could lead to wrong conclusions about the properties of the wind of the progenitor star.
At present, the similarities in several spectral properties of SN 2005ip and SDSSJ0952+2143 suggest a similar mechanism at work; and the overall appearance of SN 2005ip suggests a classical SN explosion, albeit with a number of peculiarities.
While it is important to keep in mind potentially large similarities between SN “light echoes” and tidal disruption “light echoes”, at present the SN scenario perhaps is the most conservative interpretation of SDSSJ0952+2143 – even though the coronal line luminosity and the MIR luminosity is spectacular and unprecedented.
Other very peculiar iron coronal lines in AGN might have an SN origin, too (while the bulk of AGN coronal lines are spatially extended and have properties which are best explained by classical models of the coronal line region).
4.6. Event rate
In order to estimate the rate of events as unusual as SDSSJ0952+2143, we have started a systematic search for similar objects among 7 105 galaxies of the SDSS galaxy data base. A first quick-look study produced at least two more events which fulfil the following three criteria: (1) [FeVII]-[FeXI] comparably strong as [OIII]5007, (2) large Fe line luminosities, and (3) detection of Fe line variability in our follow-up optical spectroscopy (Zhou et al., in prep.; Komossa et al., in prep.). All three events arise from the galaxy cores within the errors. There may be more such objects, but taking those 3 safely identified so far results in a lower limit on the event rate of 4 10-6/galaxy/(“a few” years). The exact value of “a few” depends on the longevity of the iron features which could be on the order of 0.5-5 years. This rate compares to theoretical predictions of the tidal disruption rate of 10-5/galaxy/year (Merritt 2009), and to observational constraints on this rate which are on the same order (Donley et al. 2002, Esquej et al. 2008).
4.7. Future follow-up observations
A number of future observations are of interest in further distinguishing between different scenarios for SDSSJ0952+2143. Several type II SNe turned out to be luminous radio emitters (e.g., Weiler et al. 1990, van Dyk et al. 1993), while in the context of stellar tidal disruption it is still unknown whether these events will produce significant radio emission. Radio follow-ups are therefore of interest. X-ray monitoring will tell the long-term decline law. While all tidal disruption candidates showed a continuous fading of their X-ray lightcurves (Komossa 2002), supernovae have more complicated X-ray lightcurves which can strongly increase or decrease with time (Schlegel 2006, Immler 2007). A new or observation should confirm the fading of the UV emission. An optical image of sub-arcsecond resolution would allow accurate localization of the faint continuum source within the galaxy core. Optical spectroscopic monitoring of the broad and narrow emission lines will provide the best diagnostic of the line-emitting gas. Among all spectral features of SDSSJ0952+2143 three stand out as special: (1) The narrow horns in the Balmer lines; luminous, with small kinematic separation, and very small line widths ( km s-1). High S/N observations would much better resolve the profile, and its temporal evolution. (2) The ultra-luminous coronal lines. [FeVII]6087 is still luminous and persistent in the most recent spectra, and measurement of its longevity will give tight constraints on the power source of the line emission, and therefore on the outburst mechanism. (3) The huge MIR luminosity of at least erg s-1. One more or a observation would tell whether this emission is permanent or varies in luminosity and temperature, and is therefore definitely related to the flare.
5. Summary and conclusions
After the initial detection of the exceptional optical emission-line spectrum of SDSSJ0952+2143 and its variability (paper I), and suspecting a tidal disruption event, peculiar AGN or supernova explosion, we have carried out multi-wavelength follow-up observations, employing , , , the telescope, and , in combination with archival observations with , , , 2MASS, NVSS, and .
SDSSJ0952+2143 shows the following continuum and emission-line properties:
-
•
The 2MASS detection (likely pre-flare) indicates a non-active galaxy.
-
•
The observed X-ray luminosity of erg s-1 in 2008 is below that of a typical AGN and above a typical SN.
-
•
The optical spectrum of SDSSJ0952+2143 is dominated by luminous coronal lines, and those of the highest ionization have dramatically faded between 2005 and 2008.
-
•
The wide range in ionization states and critical densities of the forbidden emission lines and several density-sensitive line ratios indicate a range in electron densities of the line-emitting gas (). The temperature-sensitive line ratios imply photoionization as dominant ionization mechanism.
-
•
The luminosity in each of the high-ionization lines [FeVII]6087, [FeX], [FeXI] and [FeXIV] is extraordinary and exceeds 1040 erg s-1 in 2005. It persists in [FeVII] for at least 3 years. Depending on the efficiency of reprocessing UV–X-ray radiation into coronal lines, this implies an intrinsic luminosity of at least erg s-1.
-
•
At least three to four different kinematical components are present in the optical spectrum, with FWHMs in the range 200 – 2000 km s-1.
-
•
The narrow Balmer lines are triple-peaked with two remarkable unresolved horns which do not have a counterpart in any other emission line; possibly the signature of collisionless shocks.
-
•
The SED shows a 10 bump and a rise toward longer wavelengths, reminiscent of emission by warm silicate dust. It shares some similarity with the average PG quasar SED. However, the NIR falls short of the extrapolated MIR SED by one order of magnitude, unlike quasar spectra. For few, if any, of such extreme transients as SDSSJ0952+2143, MIR spectroscopy was ever done.
-
•
The MIR luminosity is huge and amounts to at least erg s-1 at the time of the observation. The inferred black body radius of 0.5 pc implies that we see an IR light echo from pre-existing dust.
Taken together, these data paint the picture of a very energetic outburst of radiation in the inner 1.5 kpc of the galaxy SDSSJ0952+2143. The high-energy part of this flare was not observed directly, but we did see the reprocessing of this radiation into emission lines, and the low-energy continuum variability.
There are two possible explanations for the radiation outburst: a tidal disruption/accretion event onto the SMBH of a non-active or mildly active galaxy, or an extreme supernova explosion. Since only one single AGN previously showed high-amplitude variability in its iron coronal lines and no known non-active galaxy has shown this phenomenon, a rigorous comparison with known object classes can only be done for SNe. Since there appears to be nothing in the spectrum of SDSSJ0952+2143 which differs enough from a few known extreme SNe, we cannot exclude an SN interpretation. If an SN, SDSSJ0952+2143 is the most distant, and most X-ray and MIR luminous, X-ray detected SNIIn; and the most luminous known in high-ionization iron coronal lines. An extreme accretion flare in a low-luminosity AGN or non-active galaxy, especially by stellar tidal disruption, remain possibilities at present and would produce potentially very similar emission-line spectra. The large observed iron coronal line luminosities are unprecedented among SNe and exceed previous record holders by a factor 100.
References
- Adelman-McCarthy et al. (2008) Adelman-McCarthy, J.K., Agüeros, M.A., Allam, S.S. et al. 2008, ApJS, 175, 297
- (2) Ajello, M., Greiner, J., Kanbach, G., et al. 2008, ApJ, 678, 102
- (3) Ayal, S., Livio, M., & Piran, T. 2000, ApJ, 545, 722
- (4) Alonso-Herrero, A., Ward, M.J., & Kotilainen, J.K. 1996, MNRAS, 278, 902
- (5) Aretxaga, I., Benetti, S., Terlevich, R.J., et al. 1999, MNRAS, 309, 343
- (6) Berrington, K.A. 2001, ASPC, 247, 137
- (7) Bicknell, G. V., & Gingold, R. A. 1983, ApJ, 273, 749
- (8) Binette, L., & Robinson, A. 1987, A&A, 177, 11
- (9) Binette, L., Wilson, A.S., Raga, A., & Storchi-Bergmann, T. 1997, A&A, 327, 909
- (10) Blandford, R.D., & McKee, C.F. 1982, ApJ, 255, 419
- Bogdanovic et al. (2004) Bogdanovic, T., et al. 2004, ApJ, 610, 707
- Brandt et al. (1995) Brandt, W.N., Pounds, K., & Fink, H.H. 1985, MNRAS, 273, L47
- (13) Brassart, M. & Luminet, J.-P. 2008, A&A, 481, 259
- (14) Bregman, J.N., & Pildis, R.A. 1992, ApJ, 398, L107
- (15) Brinkmann, A.C., Kaastra, J.S., van der Meer, R.L.J., et al. 2002, A&A, 396, 761
- Capellaro et al. (1999) Capellaro, E., Evans, R., Turatto, M. 1999, A&A, 351, 459
- (17) Cappelluti, N., et al. 2009, A&A, 495, L9
- Carter (1992) Carter, B. 1992, ApJ, 391, L67
- Carter and Luminet (1982) Carter, B., & Luminet, J.-P. 1982, Nature, 296, 211
- (20) Chugai, N.N., 1990, Sov. Astron. Let., 16, 475
- (21) Chugai, N.N., & Danziger, I.J. 1994, MNRAS, 268, 173
- (22) Chugai, N.N., Blinnikov, S.I., Cumming, R.J., et al. 2004, MNRAS, 352, 1213
- (23) Condon, J.J., Cotton, D., Greissen, E.W., et al. 1998, AJ, 115, 1693
- (24) Dearborn, D.S.P., Wilson, J.R., & Mathews, G.J. 2005, ApJ, 630, 309
- Devillard (1997) Devillard, N. 1997, ”The eclipse software”, The Messenger No 87
- (26) Dale, D.A., Smith, J.D.T., Sclawin, E.A., et al. 2009, arXiv:0811.4190v1
- (27) Donley, J.L., Brandt, W.N., Eracleos, M., & Boller, T. 2002, AJ, 124, 1308
- (28) Dopita M.A., & Sutherland, R.S. 1996, ApJS, 102, 161
- (29) Dopita M.A., & Sutherland, R.S. 2003, Astrophysics of the Diffuse Universe, Springer
- Elitzur (2008) Elitzur, M. 2007, ASPC, 373, 415
- Eracleous et al. (1995) Eracleous, M., Livio, M., Halpern, J.P., & Storchi-Bergmann 1995, ApJ, 438, 610
- Esquej et al. (2008) Esquej, P., Saxton, R., et al. 2008, A&A, 489, 543
- (33) Evans, C.R., & Kochanek, C.S. 1989, ApJ, 346, L13
- (34) Fabian, A.C., & Terlevich, R. 1996, MNRAS, 280, L5
- Filippenko (1982) Filippenko, A.V. 1982, PASP, 94, 715
- Filippenko (1989) Filippenko, A.V. 1989, AJ, 97, 726
- Filippenko (1997) Filippenko, A.V. 1997, ARA&A, 35, 309
- (38) Fox, O., Skrutskie, M.F., Chevalier, R.A., et al. 2008, ApJ, in press, arXiv:0807.3555
- Fransson et al. (2002) Fransson, C., Chevalier, R., Filippenko, A.V., et al. 2002, ApJ, 572, 350
- (40) Frolov, V.P., Khokhlov, A.M., Novikov, I.D., & Pethick, C.J. 1994, ApJ, 432, 680
- (41) Ferguson, J.W., Korista, K., & Ferland, G. 1997, ApJS, 110, 287
- (42) Galama, T.J., Vreeswijk, P.M., van Paradijs, J., et al. 1998, Nature, 395, 670
- (43) Gal-Yam, A., Leonard, G.C., Fox, D.B., et al. 2007, ApJ, 656, 372
- (44) Garnavich, P.M., Jha, S., Kirshner, R., et al. 1998, IAU Circ. 7058
- (45) Garnavich, P.M. & Ann., H.B. 1994, AJ, 108, 1002
- (46) Gerardy, C.L., Fesen, R.A., Höflich, P., & Wheeler, J.C. 2000, AJ, 119, 2968
- (47) Gerardy, C.L., Fesen, R.A., Nomoto, K., et al. 2002, ApJ, 575, 1007
- (48) Gerardy, C.L., Meikle, W.P.S., Kotak, R., et al. 2007, ApJ, 661, 995
- (49) Germany, L.M., Reiss, D.J., Sadler, E.M., Schmidt, B.P., & Stubbs, C.W. 2000, ApJ, 533, 320
- (50) Gezari, S., et al. 2003, ApJ, 592, 42
- (51) Gezari, S., Basa, S., Martin, D.C., et al. 2008, ApJ, 676, 944
- (52) Glass, I.S., & Moorwood, A.F.M. 1985, MNRAS, 214, 429
- (53) Gomboc, A., & Cadez, A. 2005, ApJ, 625, 278
- (54) Greiner, J., Schwarz, R., Zharikov, S., & Orio, M. 2000, A&A, 362, L25
- Greiner et al. (2008) Greiner, J., Bornemann, W., Clemens, C., et al. 2008, PASP, 120, 405
- (56) Gröningsson, P., Fransson, C., Leibundgut, B., et al. 2008, A&A, 492, 481
- (57) Groves, B.A., Dopita, M.A., & Sutherland, R.S. 2004, ApJS, 153, 75
- (58) Grindlay, J., Gursky, H., Schnopper, H., et al. 1976, ApJ, 205, L127
- Grupe et al. (1995) Grupe, D., Beuermann, K., Mannheim, K., et al. 1995, A&A, 299, L5
- (60) Grupe, D., Thomas, H.-C., & Leighly, K.M. 1999, A&A, 350, L31
- (61) Gurzadian, V.G., & Ozernoi, L.M. 1981, A&A, 95, 39
- Halpern et al. (2004) Halpern, J., et al. 2004 , ApJ, 604, 572
- Heckman et al. (2005) Heckman, T., Ptak, A., Hornschemeier, A., & Kauffmann, G. 2005, ApJ, 634, 161
- (64) Heng, K., & McCray, R. 2007, ApJ, 654, 923
- (65) Hills, J.G. 1975, Nature, 254, 295
- (66) Hjorth, J., Sollerman, J., Moller, P., et al. 2003, Nature, 423, 847
- (67) Hoffman, J.L., Leonard, D.C., Chornock, R., et al. 2008, ApJ, 688, 1186
- (68) Houck, J.R., Roellig T.L., Van Cleve, J., et al. 2004, ApJS, 154, 18
- (69) Humphreys, R.M., & Davidson, K. 1994, PASP, 106, 1025
- (70) Hyland, A.R., & Allen, D.A. 1982, MNRAS, 199, 943
- (71) Immler, S. 2007, AIPC, 937, 246
- (72) Immler, S., & Pooley, D. 2007, AT, 1004, 1
- (73) Immler, S., Brown, P.J., Filippenko, A.V., & Pooley, D. 2007, AT, 1420, 1
- (74) Ivanov, P.B., & Chernyakova, M.A. 2006, A&A, 448, 843
- (75) Kato, M., & Hoshi, R. 1978, Prog. Theor. Phys., 60, 1692
- (76) Keenan, F.P., & Norrington, P.H. 1987, A&A, 181, 370
- Khoklov and Melia (1996) Khoklov, A., & Melia, F. 1996, ApJ, 457, L61
- (78) Klebesadel, R.W., Strong, I.B., & Olson, R.A. 1973, ApJ, 182, L85
- Komossa and Schulz (1997) Komossa, S., & Schulz, H. 1997, A&A, 323, 31
- Komossa and Bade (1999) Komossa, S., & Bade, N. 1999, A&A, 343, 775
- Komossa and Greiner (1999) Komossa, S., & Greiner, J. 1999, A&A, 349, L45
- Komossa (2002) Komossa, S. 2002, in: Reviews in Modern Astronomy, 15, R. Schielicke (ed), Wiley-VCH, 27
- Komossa et al. (2004) Komossa, S., Halpern, J., Schartel, N., et al. 2004, ApJ, 603, L17
- Komossa and Merritt (2008) Komossa, S., & Merritt, D. 2008, ApJ, 683, L21
- Komossa et al. (2008) Komossa, S., Zhou, H., Wang, T., et al. 2008, ApJ, 678, L13 (paper I)
- (86) Kotak,R., Meikle, P., Pozzo, M., et al. 2006, ApJ, 651, L117
- (87) Laguna, P., Miller, W.A., Zurek, W.H., & Davies, M.B. 1993, ApJ, 410, L83
- (88) Lamb, D.Q. 2000, ApJS, 127, 395
- (89) Lee, H.M., Kang, H., & Ryu, D. 1996, ApJ, 464, 131
- (90) Leonard, D.C., Filippenko, A., Barth, A., & Matheson, T. 2000, ApJ, 536, 239
- (91) Li, L.-X., Narayan, R. & Menou, K. 2002, ApJ, 576, 753
- (92) Lu, H., Zhou, H., Wang, J., et al. 2006, AJ, 131, 790
- (93) Lu, Y., Huang, Y.F., & Zhang, S.N. 2008, ApJ, 684, 1330
- (94) Lucy, L.B., Danziger, I.J., Gouiffes, C., & Bouchet, P. 1989, in: Structure and Dynamics of the Interstellar Medium, G. Tenorio-Tagle et al. (eds), Berlin: Springer, 164
- (95) Luminet, J.-P. 1985, Ann. Phys., 10, 101
- (96) Luminet, J.-P., & Marck, J.-A. 1985, MNRAS, 212, 57
- (97) Luminet, J.-P., & Pichon, B. 1989, A&A, 209, 103
- (98) Markwardt, C.B., Tueller, J., Skinner, G.K., et al. 2005, ApJ, 633, L77
- Martin et al. (2005) Martin, D.C., Fanson, J., Schiminovich, D., et al. 2005, ApJ, 619, L1
- Mazzali et al. (2006) Mazzali, P.A., Deng, J., Nomoto, K., et al. 2006, Nature, 442, 1018
- (101) Meikle, W.P.S., Mattila, S., Gerardy, C.L., et al. 2006, ApJ, 649, 332
- (102) Merrill, K.M. 1980, IAUC, 3444, 3
- (103) Merritt, D. 2009, ApJ, in press (arXiv:0803.3186v2)
- (104) Mohan, M., Hilbert, A., & Kingston, A.E. 1994, ApJ, 434, 389
- (105) Moseley, S.H., Dwek, E., Glaccum, W., Graham, J.R., Loewenstein, R.F., & Silverberg, R.F. 1989, Nature, 340, 697
- Mullaney and Ward (2008) Mullaney, J.R., & Ward, M.J. 2008, MNRAS, 385, 53
- Nagao et al. (2000) Nagao, T., Taniguchi, Y., & Murayama, T. 2000, AJ, 119, 2605
- (108) Netzer, H. 1974, MNRAS, 169, 579
- Netzer et al. (2006) Netzer, H., Mainieri, V., Rosati, P., & Trakhtenbrot, B. 2006, A&A, 453, 525
- (110) Netzer, H., Lutz, D., Schweitzer, M., et al. 2007, ApJ, 666, 806
- Nussbaumer and Storey (1982) Nussbaumer, H., & Storey, P.J. 1982, A&A, 113, 21
- (112) Oliva, E. 1997, ASPC, 113, 288
- (113) Oliva, E., Salvati, M., Moorwood, A.F.M., & Marconi, A. 1994, A&A, 288, 475
- (114) Osterbrock, D.E. 1969, Astrophys. Let., 4, 57
- (115) Osterbrock, D.E. 1989, Astrophysics of Gaseous Nebulae
- (116) Pastorello, A., Turatto, M., Benetti, S., et al. 2002, MNRAS, 333, 27
- (117) Pelan, J., & Berrington, K.A. 1995, A&AS, 110, 209
- (118) Penston, M.V., Fosbury, R.A.E., Boksenberg, A., Ward, M.J., & Wilson, A.S. 1984, MNRAS, 208, 347
- Peterson and Ferland (1986) Peterson, B.M., & Ferland, G. 1986, Nature, 324, 345
- (120) Piran, T. 2005, Rev. Mod. Phys., 76, 1143
- (121) Pozzo, M., Meikle, W.P.S., Fassia, A. et al. 2004, MNRAS, 352, 475
- (122) Puget, J.-L., & Leger, A. 1989, ARA&A, 27, 161
- (123) Quimby, R.M., Aldering, G., Wheeler, J.C., et al. 2007, ApJ, 668, L99
- (124) Raymond, J.C. 1995, Ap&SS, 233, 231
- Rees (1988) Rees, M.J. 1988, Nature, 33, 523
- Rees (1990) Rees, M.J. 1990, Science, 247, 817
- (127) Renzini, A. 2001, ESO Astrophysics Symposia, Springer, 161
- (128) Roche, P.F., Aitken, D.K., Smith, C.H., & James, S.D. 1989, Nature, 337, 533
- (129) Rosswog, S., Ramirez-Ruis, E., & Hix, R.W. 2008, astro-ph/0811.2129
- (130) Schlegel, E.M. 1990, MNRAS, 244, 269
- (131) Schlegel, E.M. 1995, Rep. Prog. Phys., 58, 1375
- (132) Schlegel, E.M. 2006, in IAU Symp. 230, 252 (San Francisco: ASP)
- (133) Schlegel, E.M., & Petre, A. 2006, ApJ, 646, 378
- (134) Schweitzer, M., Lutz, D., Surm, E., et al. 2006, ApJ, 649, 79
- (135) Seyfert, C.K. 1943, ApJ, 97, 28
- (136) Shields, G.A.,& Bonning, E.W. 2008, ApJ, 682, 756
- (137) Shull, M.J. 1980, ApJ, 237, 769
- (138) Skrutskie, M.F., Cutri, R.M., Stiening, R., et al. 2006, AJ, 131, 1163
- (139) Smartt, S.J., Eldrige, J.J., Crockett, R.M., & Maud, J.R. 2009, MNRAS, in press (arXiv:0809.0403v2)
- (140) Smith, N., Chornock, R., Li, W., et al. 2008a, ApJ, 686, 467
- (141) Smith, N., Foley, R.J., & Filippenko, A.V. 2008b, ApJ, 680, 568
- Smith et al. (2009) Smith, N., Silverman, J.M., Chornock, R., et al. 2009, ApJ, in press, arXiv:0809.5079 (S09)
- (143) Soderberg, A.M., Berger, E., Page, K.L., et al. 2008, Nature, 453, 469
- (144) Stathakis, R.A., & Sadler, E.M. 1991, MNRAS, 250, 786
- (145) Stern, D., van Dokkum, P.G., Nugent, P., et al. 2004, ApJ, 612, 690
- Storchi-Bergmann et al (1995) Storchi-Bergmann, T., Eracleous, M., Livio, M., et al. 1995, ApJ, 443, 617
- (147) Storchi-Bergmann, T., Nemmen da Silva, R., Halpern, J.P., et al. 2003, ApJ, 598, 956
- (148) Sturm, E., Lutz, D., Verma, A., et al. 2002, A&A, 393, 821
- (149) Sugerman, B.E.K., Ercolano, B., Clayton, G., et al. 2006, Science 313, 196
- (150) Sutherland, R.S., & Dopita, M. A. 1995, ApJ, 439, 381
- (151) Temple, R.F., Raychaudhury, S., & Stevens, I.R. 2005, MNRAS, 362, 581
- (152) Terlevich, R., & Melnick, J. 1988, Nature 333, 239
- (153) Tommasin, S., Spinoglio, L., Malkan, M., et al. 2008, ApJ, 676, 836
- (154) Turatto, M., Suzuki, T., Mazzali, P.A., et al. 2000, ApJ, 534, L57
- Turatto et al. (1993) Turatto, M., Capellaro, E., Danziger, I.J., Bentti, S., Gouiffes, C., & Della Valle, M. 1993, MNRAS, 262, 128
- (156) van Dyk, S.D., Weiler, K.W., Sramek, R.A., & Panagia, N. 1993, ApJ, 419, L69
- (157) Vaughan, S., Edelson, R., & Warwick, R.S. 2004, MNRAS, 349, 1
- (158) Veilleux, S. 1988, AJ, 95, 1695
- (159) Viegas-Aldrovandi, S.M., & Contini, M. 1989, A&A, 215, 253
- (160) Voges, W., et al. 1999, A&A, 349, 389
- (161) Wegner, G., & Swanson, S.R. 1996, MNRAS, 278, 22
- (162) Weiler, K.W., Panagia, N., & Sramek, R.A. 1990, ApJ, 364, 611
- (163) Wheeler, J.C., Mazurek, T.J., & Sivaramakrishnan, A. 1980, ApJ, 237, 781
- (164) Willner, S.P., Ward, M., Longmore, A., et al. 1984, PASP, 96, 143
- (165) Wooden, D.H., Rank, D.M., Bregman, J.D., et al. 1993, ApJS, 88, 477
- (166) Woosley, S.E., & Bloom, J.S. 2006, ARA&A, 44, 507
- (167) Wright, E.L. 2006, PASP, 118, 1711
- (168) Young, P.J., Shields, G.A., & Wheeler, J.C. 1977, ApJ, 212, 367
- Zhou et al. (06) Zhou, H.-Y., Wang, T., Yuan, W., et al. 2006, ApJS, 166, 128
| date | type of observationaaThe following abbreviations have been used: RASS ( all-sky survey; Voges et al. 1999), NVSS (NRAO VLA Sky Survey; Condon et al. 1998), 2MASS (Two Micron All Sky Survey; Skrutskie et al. 2006), (Galaxy Evolution Explorer; Martin et al. 2005), (Gamma-Ray Burst Optical/NIR Detector, Greiner et al. 2008), and (New Technology Telescope). | waveband or filter | comments and source brightness |
|---|---|---|---|
| 1990 Nov. | RASS | 0.12.4 keV | no X-ray detection |
| erg cm-2 s-1 (unabsorbed flux, 0.2-2 keV) | |||
| 1993 Dec. | NVSS | 1.4 GHz | no radio detection |
| mJy | |||
| 1998-01-23 | 2MASS | J,H,Ks | IR detection of extended emission; likely pre-flare state |
| J=15.4, H=14.5, Ks=14.4 mag | |||
| 2002-05-07 | - slew | 0.210 keV | no X-ray detection |
| erg cm-2 s-1 (unabsorbed flux, 0.2-10 keV) | |||
| 2004-12-20 | SDSS photometry | u,g,r,i,z | peculiar SED and i,z high-point, highest observed state |
| u=18.34, g=17.7, r=17.11, i=16.65, z=16.22 mag (SDSS DR7) | |||
| 2005 Mar. – | BAT survey | 1555 keV | no X-ray detection |
| 2008 Mar. | erg cm-2 s-1 (unabsorbed flux, 15-55 keV) | ||
| 2005-12-30 | SDSS spectroscopy | 3900–9100Å | strong emission lines incl. iron; continuum fainter than during photometry |
| 2006-03-02 | NUV, FUV | blue color | |
| NUV=20.2 mag, FUV=19.9 mag | |||
| 2007 Dec. | source noticed by us, searching the SDSS data base | ||
| 2007 Dec. 4-15 | spectroscopy | 4000–8000Å | highest-ionization iron lines, HeII, and broad H decreased in strength |
| 2008 Jan. 1 | photometry | g,r,i,z,J,H,Ks | confirms the galaxy(core) got fainter in the optical band |
| 2008 Feb. 4 | 0.1–10 keV | first detection of faint X-ray emission; implies high amplitude of variability | |
| erg cm-2 s-1 (unabsorbed flux, 0.1-10 keV) | |||
| 2008 Feb. 6 | spectroscopy | 3800–8600Å | confirms fading lines in broader wavelength range |
| 2008 April | spectroscopy | NIR | NIR emission lines detected; analysis ongoing |
| May | |||
| 2008 June 5 | IRS | 9.9–19.6m | search for emission lines; first MIR SED measurement |
| mJy at 12.5m | |||
| 2008 Dec. 25 | spectroscopy | 4000–8000Å | some iron lines fainter |
| 2009 | 0.1–10 keV | X-ray monitoring; to be carried out |
| line | aaLine ratios reported in this table are based on single Gaussian fits to the emission lines, except for the broad components of H and H which were represented by two Gaussians (see text for details). For each epoch, line ratios have been normalized to [OIII]5007. The observed [OIII] flux is = 1.8 10-15 erg cm-2 s-1 and = 1.9 10-15 erg cm-2 s-1, in the 2005 SDSS and 2008 spectrum, respectively. | FWHM | ratiobbThe ratio is the direct flux ratio between 2005 SDSS and 2008 emission lines. | |||
|---|---|---|---|---|---|---|
| SDSS | SDSS | ESO | ESO/SDSS | |||
| [FeVII] | 3586 | 0.44 | 230 | … | … | |
| [OII] | 3727 | 0.51 | 350 | 0.57 | 1.16 | |
| [FeVII] | 3759 | 0.74 | 515 | 0.47 | 0.67 | |
| [NeIII] | 3869 | 0.22 | 150 | 0.25 | 1.18 | |
| H | 4340 | 0.24 | 380 | 0.13 | 0.57 | |
| [OIII] | 4363 | 0.23 | 710 | 0.27 | 1.20 | |
| HeII | 4686 | 0.72 | 820 | 0.25 | 0.36 | |
| H | 4861 | 0.33 | 210! | 0.30 | 0.95 | |
| H | 0.09: | unresolved | 0.03: | 0.39 | ||
| H | 0.23 | unresolved | 0.07: | 0.32 | ||
| H | 0.79 | 2100 | 0.58 | 0.76 | ||
| [FeVII] ? | 4942 | 0.22 | 690 | 0.10 | 0.47 | |
| [OIII] | 5007 | 1.0aaLine ratios reported in this table are based on single Gaussian fits to the emission lines, except for the broad components of H and H which were represented by two Gaussians (see text for details). For each epoch, line ratios have been normalized to [OIII]5007. The observed [OIII] flux is = 1.8 10-15 erg cm-2 s-1 and = 1.9 10-15 erg cm-2 s-1, in the 2005 SDSS and 2008 spectrum, respectively. | 330 | 1.0 | 1.04 | |
| [FeVII] | 5158 | 0.14 | 300 | 0.03 | 0.25 | |
| [FeVI] | 5176 | 0.38 | 1180: | … | … | |
| [FeXIV]ccPotentially blended with [CaV]5309 in the ESO spectrum.
Line ratios marked with a colon are uncertain measurements, and an exclamation mark indicates that this parameter was fixed in the fitting procedure. A question mark indicates an uncertain line identification. |
5303 | 0.44 | 620 | 0.06: | 0.13 | |
| ? | 5621 | 0.35 | 820 | 0.08 | 0.24 | |
| [FeVII] | 5722 | 0.56 | 450 | 0.25 | 0.46 | |
| [FeVII] | 6087 | 0.67 | 320 | 0.50 | 0.76 | |
| [FeX] | 6375 | 1.17 | 370: | 0.14: | 0.12 | |
| [OI] | 6300 | 0.12 | 210! | 0.05 | 0.41 | |
| H | 6564 | 1.06 | 210! | 0.78 | 0.77 | |
| H | 0.32 | unresolved | 0.06 | 0.2 | ||
| H | 0.50 | unresolved | 0.1 | 0.24 | ||
| H | 9.7 | 2100 | 3.29 | 0.35 | ||
| [NII] | 6584 | 0.25 | 210! | 0.32 | 1.38 | |
| [SII] | 6716 | 0.31 | 210 | 0.17 | 0.56 | |
| [SII] | 6731 | 0.24 | 210 | 0.15 | 0.65 | |
| [FeXI] | 7892 | 0.87 | 440 | 0.10 | 0.12 |
| parameter | measurement | comment |
|---|---|---|
| X-ray luminosity | 1 1041 erg s-1 | 2008 (0.1-10 keV) |
| R magnitude | –20.8 | 2004 SDSS photometry |
| MIR luminosity | 3.5 1043 erg s-1 | 2008 (10 – 20 m) |
| broad H luminosity | 3 1041 erg s-1 | 2005 SDSS spectrum |
| [FeX]6375 luminosity | 3.5 erg s-1 | brightest detected coronal line in 2005 |
| [FeVII]6087 luminosity | 1.6 erg s-1 | brightest detected coronal line in 2008 |
| Balmer decrement H/H | 12 | 2005 SDSS spectrum |
| SMBH mass | from stellar absorption features of the host galaxy; paper I |