Bulges Of Nearby Galaxies With Spitzer: The Growth Of Pseudobulges In Disk Galaxies And Its Connection To Outer Disks
Abstract
We study star formation rates (SFR) and stellar masses in bulges of nearby disk galaxies. For this we construct a new SFR indicator that linearly combines data from Spitzer Space Telescope (SST) and The Galaxy Evolution Explorer (GALEX). All bulges are found to be forming stars irrespective of bulge type (pseudobulge or classical bulge). At present day SFR the median pseudobulge could have grown the present day stellar mass in 8 Gyr. Classical bulges have the lowest specific SFR implying a growth times that are longer than a Hubble time, and thus the present day SFR does not likely play a major role in the evolution of classical bulges. In almost all galaxies in our sample the specific SFR (SFR per unit stellar mass) of the bulge is higher than that of the outer disk. This suggests that almost all galaxies are increasing their through internal star formation. SFR in pseudobulges correlates with their structure. More massive pseudobulges have higher SFR density, this is consistent with that stellar mass being formed by moderate, extended star fromation. Bulges in late-type galaxies have similar SFRs as pseudobulges in intermediate-type galaxies, and are similar in radial size. However, they are deficient in mass; thus, they have much shorter growth times, 2 Gyr. We identify a class of bulges that have nuclear morphology similar to pseudobulges, significantly lower specific SFR than pseudobulges, and are closer to classical bulges in structural parameter correlations. These are possibly composite objects, evolved pseudobulges or classical bulges experiencing transient, enhanced nuclear star formation.
Our results are consistent with a scenario in which bulge growth via internal star formation is a natural, and near ubiquitous phenomenon in disk galaxies. Those galaxies with large classical bulges are not affected by the in situ bulge growth, likely because the majority of their stellar mass comes from some other phenomenon. Yet, those galaxies with out a classical bulge, over long periods of extended star formation are able to growth a pseudobulge. Though cold accretion is not ruled out, for pseudobulge galaxies an addition of stellar mass from mergers or accretion is not required to explain the bulge mass. In this sense, galaxies with pseudobulges may very well be bulgeless (or “quasi-bulgeless”) galaxies, and galaxies with classical bulges are galaxies in which both internal evolution and hierarchical merging are responsible for the bulge mass by fractions that vary from galaxy-to-galaxy.
Subject headings:
galaxies: bulges — galaxies: formation — galaxies: evolution — galaxies: structure — galaxies: fundamental parameters1. Introduction
Observations now indicate that many bulges in nearby disk galaxies are more complicated than previously thought. Bulges were once considered to be essentially elliptical galaxies surrounded by disks (e.g. Renzini, 1999). Yet, contrary to historic assumptions (e.g. Whitford, 1978), we now know that bulges are not typically uniformly old, non-star forming systems. Many bulges in the nearby universe are filled with young stars and cold molecular gas (Peletier & Balcells, 1996; Helfer et al., 2003). The most active bulges have star formation rates as high as 1 M⊙ yr-1 (Kormendy & Kennicutt, 2004; Kennicutt, 1998b), and exceedingly higher star formation rate densities than their outer disk. Yet it is certainly true that many non-star forming, red bulges exists; for example the nearest bulge outside our own galaxy, M 31, is made of mostly old stars. Fisher (2006) shows with mid-IR colors, bulges are either actively forming stars at similar rates to their associated outer disk, or they show a break in mid-IR colors indicating no activity in the bulge; star formation activity in bulges is bimodal. Fisher (2006) finds that those bulges with active disk-like star-formation have disk-like morphology within the central few hundred parsecs of the bulge. Such differences suggest that the nature of bulge growth in nearby disks galaxies is dichotomous. In this paper we wish to study the nature of the mass growth in nearby star-forming bulges. We compare present day star formation rates to stellar masses of bulges to estimate the significance of the star formation rate in nearby active bulges. We also compare star formation rate density to properties of the bulge and the disk.
In addition to stellar populations and SFR, bulges lack homogeneity in many fundamental properties (see Kormendy & Kennicutt, 2004 for a review). The observations suggest that bulges are bimodal in nature, and furthermore, this division is linked to the well-known bimodality in global galaxy properties (Drory & Fisher, 2007). Thus, it seems that the difference in bulge type is fundamentally connected to the history of the entire galaxy.
The two types of bulges are typically called classical bulges and pseudobulges. Classical bulges have properties similar to elliptical galaxies; whereas pseudobulges are similar in many ways to disk galaxies. Properties that can identify bulges as pseudobulges include the following: dynamics that are dominated by rotation (Kormendy, 1993), the bulge has a nearly exponential surface brightness profile (Fisher & Drory, 2008b, a), flattening similar to that of their outer disk (Fathi & Peletier, 2003; Kormendy, 1993), nuclear bar (Erwin & Sparke, 2002), nuclear ring, and/or nuclear spiral (Carollo et al., 1997). Classical bulges are typically identified as having hot stellar dynamics, more nearly r1/4 surface brightness profiles, typically more round than the outer disk (Fisher & Drory, 2008b), and a relatively featureless morphology. Also, Fisher & Drory (2008b) show that the structural properties of classical bulges (absolute magnitude, Sérsic index, half-light radius, and surface brightness at the half-light radius) correlate in the same way as elliptical galaxies, yet pseudobulges do not participate in these correlations. Gadotti (2008) shows that many bulges fall below the Kormendy relation, and are thus lower in surface density per radial size than a similar sized elliptical galaxy.
As stated above, the dichotomy in bulge properties extends to the ISM properties of bulges. Regan et al. (2001) compare the radial distribution of CO to the stellar light profiles in 15 spiral galaxies. They find that most of the galaxies in their sample show an excess of CO emission in the bulge region of the galaxy, and further that the central CO radial distribution is similar to that of the stellar light. Regan et al. (2006) shows a similar result with Spitzer IRAC 8 m (PAH) data. Helfer et al. (2003) find that 45% of the galaxies in the BIMA SONG survey have a peak CO emission within the central 6″, while many galaxies have a central hole in the CO map. This is similar to the result of Fisher (2006), described above. Thus their appears to be a bimodal distribution of ISM properties in nearby bulges.
Stellar populations and age-gradients in bulges of disk galaxies suggest multiple formation mechanisms as well. Peletier & Balcells (1996) show with optical and near-IR colors that many, but not all, bulges are young. MacArthur et al. (2004) find that earlier-type, more luminous, and higher surface brightness galaxies are older and more metal-rich, suggesting an early and more rapid star formation history for these galaxies Recent work with the SAURON survey continues to show such results. Peletier et al. (2007) shows that a large fraction of bulges fall below the Mg2 - correlation of Coma cluster ellipticals, as do all the bulges in Sb-Sd galaxies in the sample of Ganda et al. (2007). There is evidence that those bulges in Falcón-Barroso et al. (2006) with central velocity dispersion drops tend to be younger. However, Moorthy & Holtzman (2005) find that bulges in their sample follow similar correlations of stellar populations and dynamics as elliptical galaxies. Also, Thomas & Davies (2006) suggest that only the late-type bulges in their sample could have been significantly affected by slow internal growth. As in ISM properties, stellar populations seem to come in two separate flavors, some bulges are young and others are old.
Many observations indicate that the properties of pseudobulges are linked to those of their associated outer disks. Observed connections between bulge and disk stellar populations (Peletier & Balcells, 1996; MacArthur et al., 2004), inter-stellar medium (Regan et al., 2001), and scale lengths (Courteau et al., 1996a) suggest that pseudobulges form through processes intimately linked to their host disks. Fisher & Drory (2008b) show that the connection between the radial sizes of bulges and disks only exists for pseudobulges. Similarly, Fisher (2006) shows that only pseudobulges have ISM properties and SFR like their outer disks. These connections between pseudobulge and disk properties motivate some authors to consider the possibility that pseudobulge formation is linked to disk properties.
In summary, the observations suggest that pseudobulges are rotating rapidly, actively forming stars, and structurally different than elliptical galaxies. Furthermore, many properties of pseudobulges (e.g. radial size, and stellar populations) are linked to their outer disk. Yet, classical bulges are dominated by random motions, contain old stars, and are structurally similar to elliptical galaxies; they’re properties thus far appear somewhat independent of the surrounding disk.
In this paper we use data from Spitzer Space Telescope, Hubble Space Telescope, and the Galaxy Evolution Explorer to study the present day growth of bulges in nearby disk galaxies. We use specific star formation rates to estimate the time-scales for bulge formation. Also, we report on connections between star formation rates in bulges and structural properties of those bulges and with properties of their associated outer disks.
2. Implications Of Secular Formation Of Pseudobulges
To be explicit, in this paper the term “pseudobulge” is purely observational. We classify a bulge as pseudobulge only if the bulge has disk-like morphology, Sérsic index lower than two, or both of these (discussed in more detail in §4). Separate from this observational definition, it has been proposed by many authors that pseudobulges could have formed through internal disk evolution. Our aim is to test this hypothesis. If pseudobulges truly form all of their stellar mass through internal means, the implication would be that galaxies with pseudobulges are physically more similar to a bulgeless galaxy.
How can one observe a bulgeless galaxy with ? A large number of simulations show that non-axisymetries are able to rearrange disk gas such that the central gas density increases (Simkin et al., 1980; Combes & Sanders, 1981; Pfenniger & Norman, 1990; Athanassoula, 1992; Zhang, 1999). If a hypothetical galaxy initially has a purely exponential stellar mass density profile (), but the gaseous inflow generates a steeper than exponential gas profile, the central star formation rate density will be enhanced accordingly (Kennicutt, 1998a; Wu et al., 2005). If the central few hundred parsecs of this hypothetical galaxy have a greater SFR per unit mass than the outer parts do, then eventually the stellar density profile will become steeper than an exponential profile. When one applies typical bulge-disk decomposition machinery that assumes an exponential disk and Sérsic bulge to observations of the hypothetical galaxy, the result will be This scenario is typically referred to as “secular” bulge growth.
Observationally the hypothetical galaxy has a bulge, but theoretically speaking its just that this disk galaxy has a stellar density profile that is steeper than an exponential. Given that we can not know for certain what happened to make a particular pseudobulge, we choose a purely observational terminology to label bulges. In what follows we will not assume a priori that our classification implies distinct physical nature.
The evidence suggest that a large fraction of disks are barred and those bars are long-lived (Eskridge et al., 2000; Jogee et al., 2004). Connections between the presence of bars and bulge growth give credence to the secular bulge growth hypothesis. In simulations, barred potentials are efficient mechanisms to drive gaseous inflows (Athanassoula, 1992). Observations show that galaxies with bars tend to have higher molecular gas densities than those without (Sheth et al., 2005). As well, Gadotti & dos Anjos (2001) find in a sample of 257 Sbc barred and unbarred systems that blue star-forming bulges are predominantly in barred galaxies. Sakamoto et al. (1999) estimate that the mean rate of inflow of molecular gas in barred galaxies must be 0.1-1 M⊙ yr-1. Furthermore, molecular gas densities and dynamics in barred galaxies suggest that active star formation is currently building rapidly rotating bulges (Jogee et al., 2005).
Though bulges in barred galaxies on average do have higher SFR, many barred galaxies exist with bulges that are not currently growing. Fisher (2006) shows that the growth is better connected to bulge morphology, finding that pseudobulges are growing, but classical bulges are not. Fisher & Drory (2008b) find many unbarred galaxies with pseudobulges. Indeed, simulations by Zhang (1999) indicate that spiral structure can drive secular evolution in disk galaxies as well. Furthermore, spiral structure is certainly a common phenomenon in disk galaxy. Kormendy & Fisher (2005) argue that secular evolution in rotationally supported disks is a natural response to local energy minimization, and thus given the opportunity, disks will innately drive gas inward. Bars may be sufficient but not necessary. Thus it makes sense that secular bulge growth is common, and it appears that even mild non-axisymmetries like spiral structure can drive gaseous inflows.
Recent studies show that galaxy formation models do not predict enough disk galaxies with low . Weinzirl et al. (2008) finds that the predicted fraction of high mass spirals with a present-day is a factor of fifteen smaller than the observed fraction of high mass spirals with such small bulges. Similarly Stewart et al. (2008) finds in simulations that almost all giant galaxies would have accreted a mass that is larger than the mass of the Milky Way disk in the past 10 Gyr. Given that such an encounter is likely to destroy a disk, these results, “raise serious concerns about the survival of thin-disk-dominated galaxies within the current paradigm for galaxy formation in a CDM universe.”
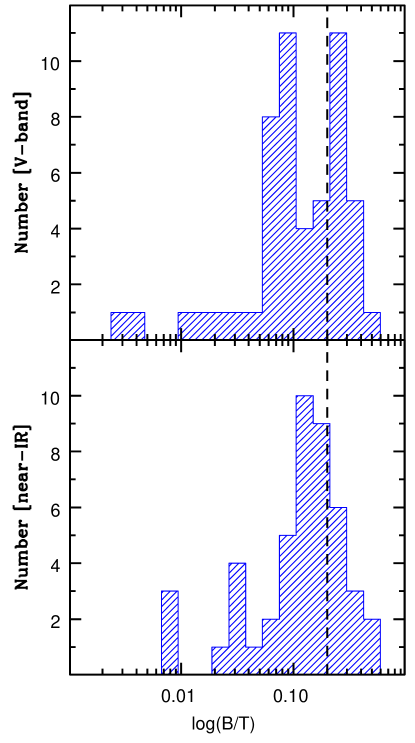
If pseudobulges form secularly, then even pseudobulge galaxies with observed B/T0.3 are still “bulgeless” galaxies. In Fig. 1 we show the distribution of bulge-to-total light ratios (B/T) for pseudobulges (blue lines) with -band data (top panel) from Fisher & Drory (2008b) and near-IR data (bottom panel). The vertical dashed line represents . It is certainly true that pseudobulges much more commonly have low bulge-to-total ratios. However, 33% of the pseudobulges in Fisher & Drory (2008b) and 24% of the pseudobulges with near-IR data have . Pseudobulges with are by no means rare among pseudobulges. If pseudobulges form all their mass secularly, then the data in Fig. 1 would imply that the number of bulgeless galaxies is underestimated, and those gaps between observation and theory become more dire.
What else might form pseudobulges? It is often assumed that bulges formed through successive merging of similar-mass sub-halo objects early on, and remaining gas that was not involved in the merging process settles into a gas disk (e.g. Steinmetz & Muller, 1995; Kauffmann, 1996). Something similar to this process may be able to describe the population of classical bulges. Indeed, Drory & Fisher (2007) find that classical bulges reside exclusively in red sequence galaxies. Yet, it would be difficult for the end products of such processes as roughly equal-mass merging with violent relaxation to make bulges with cold dynamics and disk-like morphologies. Furthermore, major-mergers are likely to consume most of the fuel for future star formation (see Schweizer, 2005 for a recent review). Yet, as discussed above, cold molecular gas is not-at-all rare in bulges of disk galaxies.
Perhaps successions of minor-mergers with high gas ratios are responsible for pseudobulges formation. Cox et al. (2008) show that the effect of merging and accretion on the resulting galaxy is a function of the mass ratio. It is thought, though, that bulge growth by subsequent accretion of mass results in heating and eventually destruction of a galactic disk (Toth & Ostriker, 1992; Velazquez & White, 1999), and recent simulations (Purcell et al., 2008) also suggest that is hard for accretion not to destroy a thin disk.
Other scenarios for the formation of bulges have been suggested. Clump instabilities in disks at high redshift can form bulge-like structures in simulations (Noguchi, 1999). Many recent observations show that this process may indeed be happening at high redshift (Genzel et al., 2008; Bournaud et al., 2008). However, recent work by Elmegreen et al. (2008) suggests that bulges built through clump instabilities in simulated galaxies better resemble classical bulges. One should therefore keep in mind that the population of bulges as a whole, and any one particular bulge, may be the result of more than one of these processes.
3. Estimating Time scales For Bulge Growth
Is the amount of star formation in typical pseudobulges enough to significantly alter their stellar mass? This is what we seek to estimate in this paper. If we assume a continuous gas supply from internal disk evolution, and approximate that historic SFR as a constant, we can use the present-day SFRs in bulges to determine the time-scale for pseudobulge growth.
Mass growth in bulges can be described as
| (1) |
where is the current stellar mass; is the star formation rate; is the rate at which previously formed stars are transferred to the bulge (either by accretion or by secular evolution); and are the time scales over which each of these phenomena occur; and finally is that mass that exists initially in the bulge region. Assuming constant growth (and that ) this can be simplified, and solved for ,
| (2) |
SST provides the ideal instrument to measure . Using the 3.6 luminosity from SST IRAC CH 1 we can measure , where (this is discussed in more detail below) and the 24 luminosity obtained with SST MIPS CH 1 can measure the star formation rate (Calzetti et al., 2007).
To measure we subtract the inward extrapolation of an exponential profile fit to the outer disk. Thus we set
| (3) |
where is the central mass density of the outer disk, is the scale-length of the outer disk, and is the radius at which the bulge is 25% brighter than the disk. We set the bulge mass as
| (4) |
It is likely that , as defined in Eq. 4, is only a rough estimate. Giant disk galaxies may have formed with central profiles that are cuspier than exponentials. Alternatively, some galaxies, such as M 104, have central holes in the gaseous disk. Also, as pseudobulges grow (at times to ; Fisher & Drory, 2008b and Fig. 1) the structural parameters of the disk are likely to change. Hence, it may follow that inward extrapolation of the outer stellar disk of those galaxies may be inaccurate. Nonetheless, we feel that is likely a reasonable estimate of bulge mass for most galaxies.
We make the approximation that star formation internal to the bulge need only account for a fraction of the mass, hence
| (5) |
where is a quantity that measures the amount of stellar mass growth that is from star formation internal to the bulge, and is the SFR at . For the sake of simplicity the “growth times” quoted in this paper will assume unless otherwise stated. The factor is likely the product of the following two phenomena: (1) SFRs that are not constant, and, (2) the fraction of stellar mass that migrates to the bulge.
The ratio of the the present-day SFR to the average historic SFR (called the birth-rate parameter, ; Scalo, 1986) is known two range from in local disks galaxies, and is preferentially larger in late-type galaxies (Kennicutt et al., 1994). If pseudobulges are anything like their outer disks, then Sa-Sbc pseudobulges are likely to have lower values of (and thus ) than pseudobulges in late-type galaxies. Thus, it is necessary to consider present day SFRs in intermediate-type galaxies with different expectations than those in late-type galaxies.
We cannot yet measure the rate at which previously-formed disk stars are transferred to the bulge. Simulations indicate that it is occurring, though. Roškar et al. (2008) finds that a non-negligible amount of stellar mass migrates within the disk in simulated disk galaxies. Further, many pure -body simulations are able to move mass around within a disk without the presence of any gas (e.g. Pfenniger & Norman, 1990; Norman et al., 1996; Debattista et al., 2004). Also, Cox et al. (2008) show that accretion of relatively low mass galaxies does not significantly alter a galaxy’s SFR.
The total fraction of stellar mass that SFR must therefore account for is , where is the mass that is transferred as stars formed outside the bulge, . There will always be some degeneracy between and , in fact it is possible that the only way we can ever know is through simulation, not observation.
We have no detailed models on which to base our predictions. Yet, we can place them inside the context of disk-galaxy evolution, and use what we know about star formation in disk galaxies to make estimates for how long it might take to form pseudobulges. Typical SFR densities in galactic disks are about M☉ yr-1 kpc-2 (Kennicutt, 1998a). Bulges are typically about 1 kpc in radius Fisher & Drory (2008a). Therefore, if pseudobulges grow stars at similar rates to the high end of the distribution for disks, then we expect them to form roughly M☉ yr-1. If a bulge is M☉ then it should take a few billion years to make a bulge through internal disk evolution. Given that disks are not too much older than 5-10 Gyr (Bell & de Jong, 2000), we expect to find the bulges still forming stars today. Also, if pseudobulges form too quickly we run into a problem again, because not every galaxy has a large pseudobulge. Kautsch et al. (2006) find that of giant disk galaxies roughly 1/10th are “simple disks” meaning they have no detectable bulge when viewed edge-on. We know already that gas consumption time of the most actively star forming bulges, calculated by Kormendy & Kennicutt (2004), tend to be in the fast region of this range, about 1 Gyr. Thus we suggest that if the growth time of pseudobulges are significantly outside the range of 1-10 Gyr, then this would pose a problem for secular evolution scenario of pseudobulge formation. Furthermore variations in historic SFR can account for differences of at most a factor of two outside of this range.
4. Methods
4.1. The Sample
The purpose of this work is to study the present day growth of bulges, and thus we wish to sample galaxies with a wide range of bulge properties. Therefore, our sample of 53 galaxies spans the Hubble types from Sa to Sd.
We begin by visually selecting galaxies from the Carnegie atlas (Sandage & Bedke, 1994) with distance less than 20 Mpc, such that all galaxies are at least resolved to a few hundred parsecs with MIPS on board the SST. Also, we restrict our sample to exclude significantly inclined galaxies, we only keep galaxies that satisfy ¡80°. We also select galaxies that have “well behaved” morphology: free of tidal-tails, warps and asymmetries to exclude galaxies with significant interaction-induced star formation.
Though not volume limited, our sample is constructed to cover parameter space, especially a sequence in mass. To do this, we select galaxies covering a range in Hubble types from Sa to Sd; Our sample consists of 15 Sa - Sab, and 21 Sb - Sbc, 17 Sc-Sd galaxies. Galaxies in our sample are not fainter than -17 absolute -band magnitude, and they are typically distributed with magnitudes around the mean of -19.5 -mags.
The link between non-axisymmetries (barred and oval distortions) and secular evolution motivates us to create a sample containing roughly equal numbers of galaxies with a driving agent (galaxies with a bar and/or an oval) and galaxies without a driving agent (Kormendy & Kennicutt, 2004; Peeples & Martini, 2006). Indeed, a correlation between central SFR and the presence of bars and ovals has been found. (Sheth et al., 2005; Fisher, 2006). Detection of oval distortions are discussed in Kormendy (1982). They are identified by nested shelves in the surface brightness profile usually having different position angles. We identify bars by consulting the Carnegie Atlas of Galaxies (Sandage & Bedke, 1994), the RC3 (de Vaucouleurs et al., 1991), and visual identification in 3.6 m images. If a galaxy has both a bar and an oval, we call that galaxy barred. Note that we do not distinguish grand design spirals as a possible secular driver, though they may be able to generate a similar but less extreme effect as bars do (KK04). In our sample 22 galaxies are unbarred and unovalled, and 31 are driven (25 barred and 6 ovaled).
4.2. Identification of pseudobulges
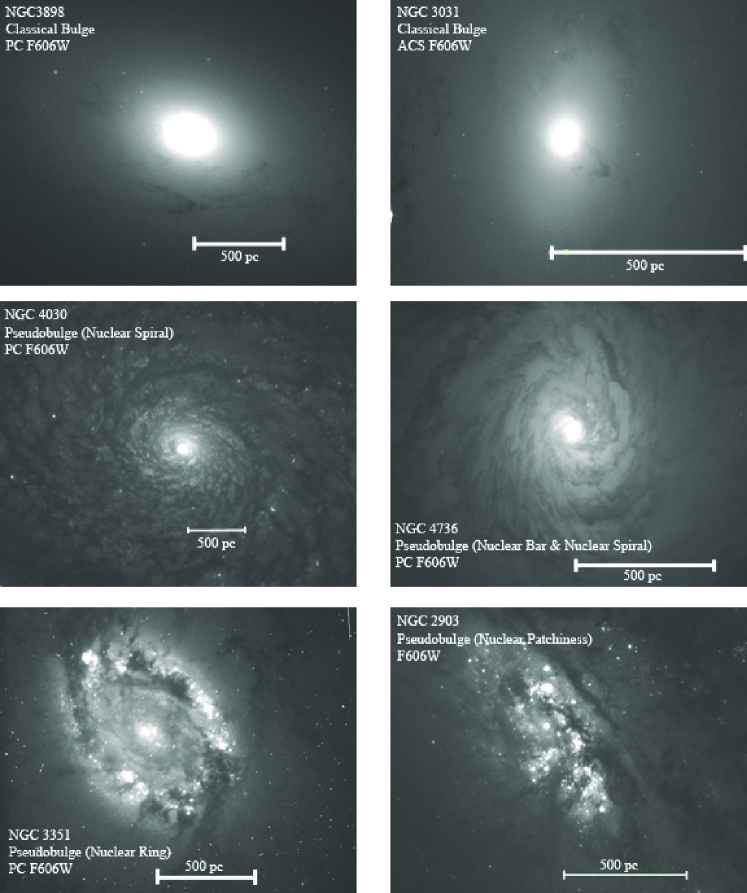
In this study, we classify galaxies as having a pseudobulge using two methods bulge morphology and Sérsic index. If the “bulge” is or contains a nuclear bar, nuclear spiral, and/or nuclear ring the “bulge” is a pseudobulge. Also, if the bulge has Sérsic index less than two, the bulge is called a pseudobulges. Conversely if the bulge is featureless and has a higher Sérsic index, the bulge is called a classical bulge. However, Fisher & Drory (2008b) show that about 10% of bulges with Sérsic index higher than two, have disk-like nuclear morphology. For a detailed description of this method, see Fisher & Drory (2008b). Examples of nuclear morphology that indicates a bulge as a pseudobulge or a classical bulge are shown in Fig. 2.
Their is significant overlap of our sample with Fisher & Drory (2008b), 31 galaxies are in both samples. We therefore use bulge Sérsic indices from Fisher & Drory (2008b), when available. For the remaining 23 galaxies we generate new bulge-disk decompositions using archival data from HST archive, Sloan Digital Sky Survey, and NASA Extragalactic Database (NED). Bulge Sérsic indices for all galaxies are given in Table 1.
Our decomposition method is discussed in the Appendix. We also show results of each new fit in both figure and tabular form. The method we use to calculate surface brightness profiles and Sérsic fits to those profiles is the same procedure as used in Fisher & Drory (2008b). This procedure is also employed in Kormendy et al. (2008) on elliptical galaxies. We refer interested readers to these two papers for more detailed discussions of our reduction and analysis software and procedures.
We identify pseudobulges using HST archival images in the optical wavelength regime ( through ). This makes bulge classification subject to the effects of dust. However, the structures used to identify pseudobulges are usually experiencing enhanced star formation rates, and are easier to detect in the optical region of the spectrum where the mass-to-light ratios are more affected by young stellar populations, rather than in the near infrared where the effects of dust are lesser. Classical bulges may have dust in their center, as do many elliptical galaxies (Lauer et al., 2005). The presence of dust alone is not enough to classify a galaxy as containing a pseudobulge. We indicate which galaxies are pseudobulges, and classical bulges in Tables 1 & 2. These structures are often present, and affect the surface brightness profile, even in the near-IR, at 3.6 m, where differences from varying mass-to-light ratios are minimized.
We use the NASA Extragalactic Database NED to search for any evidence of close companions of similar magnitude, tidal distortions, or peculiar morphology. We remove those galaxies which seem to be interacting with other galaxies from our sample. Three galaxies in our sample have companions at kpc, which do not appear to affect the morphology of these galaxies’ disks. However, M 51 is a notable exception to this rule as it is currently accreting a smaller galaxy.
4.3. Photometry
Imaging data used to calculate fluxes for this paper comes from the following sources: Spitzer IRAC CH 1 (3.6 m), Spitzer MIPS CH 1 (24 m), GALEX FUV (Martin et al., 2005) and HST NICMOS. The IRAC and NICMOS images are used to calculate stellar mass (discussed below), and the GALEX and MIPS images are used to determine SFRs. We use post-BCD frames for all Spitzer data, and pipeline reduced GALEX and HST data.
To measure 3.6 m surface brightness profiles we use the code of Bender & Moellenhoff (1987). First, interfering foreground objects are identified in each image and masked. Then, isophotes are sampled by 256 points equally spaced in an angle relating to polar angle by , where is the polar angle and is the axial ratio. An ellipse is then fitted to each isophote by least squares. The software determines six parameters for each ellipse: relative surface brightness, center position, major and minor axis lengths, and position angle along the major axis. We then shift the NICMOS F160W images (when available in the archive) to the same zero point as the IRAC data. The composite profile is NICMOS data for r¡1.22 arcsec, the average of the two profiles when they overlap, and IRAC 3.6 m data at large radii (typically arcsec).
We note that this procedure assumes a color gradient of zero from -band to -band in our bulges. This assumption introduces a source of uncertainty, yet allows for a more complete description of the stellar mass profile. To quantify this uncertainty we calculate the entire radial surface brightness profile in -band using NICMOS and 2MASS data. We then shift that profile to have the same zero point as the IRAC 3.6 m profile, and then calculate the bulge luminosity, which we call . The difference is scaled by the fraction of light that comes from the shifted NICMOS F160W data. This is taken as the error. This error is typically less than 5% and rarely larger than errors from other sources, such as fitting uncertainty. We use NICMOS data because it is our belief that the high resolution data increases accuracy, even if precision is compromised slightly.
Prior to measuring the bulge flux of MIPS images we run the images through a few iterations of the Lucy-Richardson deconvolution routine in IRAF; we are primarily interested in reducing the effects of the Airy rings in the MIPS 24 m point-spread-function (PSF). We construct a PSF from point sources in the image. However, many of our images do not include enough high signal-to-noise point sources; in this case we use the theoretical PSF available on the MIPS web-site. To calculate the surface brightness profile at 24 m we use the PROFILE tool in the the image analysis package VISTA (Lauer, 1985). The 24 m luminosity is then calculated by integrating the 2-D surface brightness profile to the bulge radius (), determined using the 3.6 m profile. Galactic extinction is considered negligible for 24 m images. Aside from deconvolution, we carry out the same procedure to measure FUV luminosities. We calculate the extinction in FUV using the results from Cardelli et al. (1989) and Schlegel et al. (1998).
For the 24 m and FUV profiles, we consider two sources of error in calculating our luminosities. First, uncertainty in the choice of leads to errors in the luminosity calculation. We choose as the radius at which a galaxy is 25% brighter than the inward extrapolation of an exponential profile fit to the outer disk. We construct an error to this by simply integrating the luminosity to the next resolved points in the profile. Secondly, we also consider the variance in the image as a source of error. These two errors are then combined in quadrature to construct the total error in luminosty. Typically the uncertainty due to heavily dominates the total error.
4.4. Calculation Of Mass From 3.6 Luminosity
We assume that the near-infrared light is a good tracer of stellar mass due to its weak dependence on star formation history (Aaronson et al., 1979; Rix & Rieke, 1993). In this paper, we calculate stellar mass by using the relation between mass-to-light ratio () and color. We assume that where is determined from optical colors with as in Bell & de Jong (2001), and take the mean ratio from Dale et al. (2007). We use the color from the RC3 (de Vaucouleurs et al., 1991); if the galaxy does not have a in the RC3 we use the value from Prugniel & Heraudeau (1998). We correct these optical colors for Galactic extinction using data from Schlegel et al. (1998). For the calculation of stellar mass we assume that total colors are good estimates of the stellar populations of the bulges; this may introduce a source of uncertainty. However, the color of the bulge has been shown to be very similar to the color of the outer disk in intermediate type galaxies (Peletier & Balcells, 1996). Thus it is likely a safe assumption.
4.5. Contamination From Active Galactic Nuclei
One difficulty in measuring the SFR in bulges of galaxies is that active galactic nuclei can contribute significantly to the mid-IR flux in the centers of galaxies. Most of the galaxies in our sample have an active non-thermal source in their center; what remains is to determine what the typical effect is and which galaxies are most heavily affected.
We use IRAC 8 m to determine which galaxies have strong nuclear point sources due to their increased angular resolution. In a few galaxies in our original sample, over 80% of the bulge light is contained within a point source in the 8 m images. We identify this light as non-thermal by comparing the [OIII]/H and [NII]/H line-ratios (Ho et al., 1997) and exclude these galaxies from the rest of the study. The excluded galaxies are NGC 1068, NGC 4258, and NGC 5273.
We find that for the remaining galaxies the point sources typically make up less than 10% of the bulge light. This is within the typical amount of measurement uncertainty so that it is not necessary to account for contributions from the remaining low-luminosity active galactic nuclei in the rest of the sample. In Fabricius et al. (2008) we directly investigate connections between growth of pseudobulges and the growth of central active galactic nuclei.
4.6. Calibration Of Star Formation Rates
In optically thick environments, massive young stars heat dust grains which re-radiate that light in the IR. Even though newly formed stars are easily detected in the UV, even small amounts of internal extinction within those galaxies will hamper efforts to measure the SFR only using UV light. For this reason, IR emission has and continues to be a good indicator of SFRs in most galaxies (Kennicutt, 1998a). However, different galaxies have differing opacities, and this difference can depend on the ages of the stars being probed and the amount of star formation (e.g. Calzetti et al., 1994; Bell, 2003; Seibert et al., 2005). Also, Boissier et al. (2007) find UV emission in the absence of IR emission in some nearby galaxies, indicating the existence of unobscured young stars. Therefore, we calibrate a new SFR indicator that combines the re-emission from warm dust (MIPS 24 m) and directly the emission from young stars (GALEX FUV 1350-1750 Å) luminosities,


| (6) |
where is a conversion constant. A similar SFR indicator is calibrated by Bigiel et al. (2008).
We use the “high metallicity” galaxies in Calzetti et al. (2007) as a sample on which to calibrate Eq. 6. These galaxies are used, in part, because they all have measured Paschen- luminosity, which is a more direct probe of HII regions, and is much less affected by internal extinction. Thus, a linear correlation with the Pa luminosity would imply that the SFR indicator is robust. However, there are important distinctions between the methods used in this paper and those of Calzetti et al. (2007). They measure luminosity of the central regions of galaxies by summing the luminosity of individual point sources within those images; we measure luminosity, as described above, using isosphote measurements. Each method has advantages and disadvantages, and we do not wish to claim either is better or worse. Our method will measure a certain amount of diffuse emission that may not have been counted by Calzetti et al. (2007), and because we calculate isophotes based on the mean value of an ellipse, our method may underestimate the luminosity of extremely bright knots of star formation. We note that these two effects act against each other, and may lessen systematic differences. In interest of measuring SFRs that are comparable across these two methods, we calibrate Eq. 6 using our measurements of and and those SFRs taken from Calzetti et al. (2007). Also, Calzetti et al. (2005) measures luminosities in a square arcsecond field (the field of view of NICMOS 3); we adjust this to an elliptical aperture that matches our galaxies assuming a constant azimuthal density. We expect that this affects the measurements very little, but is a difference none-the-less.
The constant is intended to scale our combined luminosities to units of SFR. We find
| (7) |
In the top panel of Fig. 3, we show the comparision of our SFR indicator to the Paschen emission. We find good agreement with a linear correlation (overplotted as a solid line) of our indicator with Paschen , thus indicating that our estimates are robustly measuring the high-mass star formation. In the bottom panel of Fig. 3, we show the comparison our SFR to that of Calzetti et al. (2007); a line of equality is overplotted. We find good agreement between these two different SFR indicators.
Not every galaxy in our sample has GALEX data available. Typical disk galaxies like the ones in our sample would be classified as “high metallicity” based on the criteria in Calzetti et al. (2007); therefore single-band fluxes would be considered sufficient. However, if more data exists that may improve the reliability of our SFRs then we ought to use that data. Therefore, when both FUV and Spitzer data are available we use the SFR indicator described above, and a single band indicator when only 24 m data is available. In our sample 35 galaxies have both 24-m and FUV datas, and 17 galaxies only have 24 m data.
To measure the SFR from 24 m luminosity alone we use all galaxies in our sample that have both FUV and 24 m data. We find that single-band 24 m-luminosity SFRs (using the calibration from Calzetti et al., 2007) are systematically low compared the the SFR computed with Eq. 6, although the exponent of the correlation appears the same (). In attempt to account for this we multiply the equation from Calzetti et al. (2007) for 24 m alone by the mean fractional difference, which we find . Thus we use
| (8) |
where is in ergs s-1, as opposed to the original formula which has a multiplier of 1.27. This same scaling difference exists when comparing our single flux measurements to the SFR in Calzetti et al. (2007) for those galaxies that are present in both samples. This small difference in scaling is likely a concequence of the different methods to calculate the bulge luminosity. Our method intergrates azimuthaliy averaged isophotes, which likely reduces the effects of bright sources.
In Fig. 4 we compare SFR calculated with both methods, our single-band SFR and our FUV plus 24 m indicator. As one can see from Fig. 4 33 of 35 bulges have very similar SFR as measured by IR+FUV indicator or the single-band IR indicator (standard deviation of the difference between the two indicators is 0.02 M yr-1). The two outlying galaxies (NGC 0925 & NGC 1512) show an unusually large number HII regions (Sandage & Bedke, 1994). We check NED for similar comments on all our galaxies that contain only IR data, of those 17 only NGC 3726 has similar comments. We conclude in general single band fluxes yield a good estimate of the SFR, and in rare circumstances, likely requiring unusually high numbers of HII regions, single band IR calibrations may understimate the SFR. Those galaxies that do not have GALEX observations are indicated in Table 2. Also, in Fig. 6 we replot our principle result such that symbols indicate the different methods used to determine SFR.

5. The Growth Of Pseudobulges In Galactic Disks
5.1. Growth Times In Pseudobulges
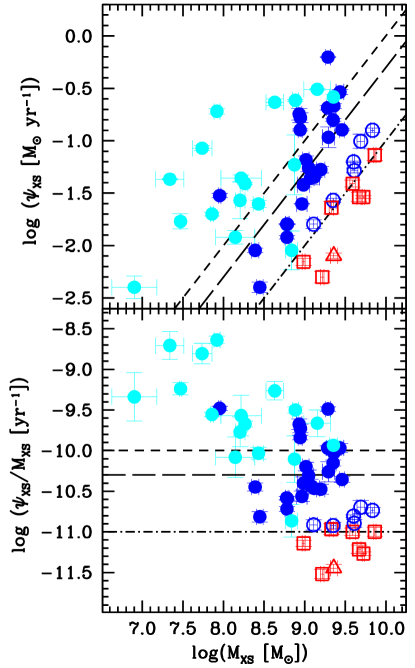
All bulges in our sample are forming some stars, irrespective of whether they are classical bulges or pseudobulges. This is apparent in the top panel of Fig. 5, where we plot SFR of the bulge, , versus bulge mass, . Typical star formation rates in bulges range from 0.01 to 1.0 yr-1; both the highest and lowest SFR bulges are pseudobulges. Generically speaking, SFR of bulges are consistent with a linear correlation with mass (MXS), where is the total SFR within the bulge radius, . The lines indicate three linear growth models, where Gyr, represented by dotted lines, short dashes, and long dashed lines, respectively. The classical bulge with the highest SFR is M 81 with , denoted as a triangle in Fig. 5. M 81 is known to be interacting with nearby M 82.
We are principally interested in determining if an extended SFR roughly equivalent to the present-day SFR is able to account for the growth of the stellar mass in pseudobulges. To better illustrate this result, in the bottom of Fig. 5 we plot the specific SFR against bulge mass. The black lines indicate the time necessary to grow the stellar mass in Gyr from top to bottom.
We distinguish four types of bulges in this paper. The first distinction comes from morphology of the bulge and Sérsic index in optical bands, as discussed above: classical bulges (open red squares) and pseudobulges (light and dark blue circles). Further, we distinguish three types of pseudobulges: pseudobulges in late-type galaxies (light blue filled circles); active pseudobulges in intermediate-type galaxies (blue filled circles); inactive pseudobulges in intermediate-tyep galaxies (specifc SFR Gyr-1 and , open blue circles). These four sets of galaxies produce four roughly parallel sequences in the plane, each growing roughly linear, and each being offset toward higher mass per unit SFR as one goes from late-type pseudobulges to intermediate-type pseudobulges to inactive pseudobulges to classical bulges.
From the figure it is clear that present day SFR in almost all active pseudobulges is sufficient to account for the mass of those bulges (in both late and intermediate type galaxies), but not enough to account for the mass of any of the classical bulges or inactive pseudobulges. There is a high-scatter negative correlation between specific SFR of all bulges with stellar mass that is roughly consistent with mass growth via constant SFR.
For all pseudobulges (all 3 types) the median growth time is 12.4 Gyr, however there is signifigant spread. Of all 45 pseudobulges in our sample 33 have growth times less than 10 Gyr. For active pseudobulges in intermediate-type galaxies we find the median growth time is 6.3 Gyr, and 19 of the 39 active-pseudobulges have growth times less than 10 Gyr, and 30 of 39 would require less than 20 Gyr. The star formation growth times calculated by Kormendy & Kennicutt (2004) are on the high end of this distribution, however we note that they restrict their sample to nuclear rings, which are forming stars much more vigoursly than the typical pseudobulge.
We remind the reader that a degeneracy exists between the time necessary to grow a structure and the fraction of mass for which the present day SFR needs to account. It is very likely that this ratio (, see Eq. 5 and subsequent discussion) varies from galaxy to galaxy, and may possibly correlate with mass. Therefore discussion of a single metric of growth time for all pseudobulges is likely an oversimplification. Furthermore, we remind the reader that in typical disk galaxies historic SFR were higher than present day SFR by roughly a factor of two (Kennicutt et al., 1994).
Late-type bulges have the highest specific SFRs due to their small masses. The mean specific SFR of late-type bulges is yr-1. The mean SFR of late-type bulges is 0.1 M⊙ yr-1, and the average mass is . Thus if the mean late-type bulge is able to maintain a constant SFR for the next gigayear, the resulting bulge would fall near the low-mass end of the present-day intermediate-type pseudobulge sequence in Fig. 5.
Classical bulges and inactive pseudobulges are uniformly not forming stars at high enough rates to form their stellar masses within a reasonable amount of time, including M 81. The mean growth time for classical bulges in our sample is yr. Inactive pseudobulges are slightly higher in specific SFR than classical bulges.
In Fig. 6 we replot our main result, shown in Fig. 5. However here plotted symbols reflect the type of method used to calculate the SFR; open symbols represent SFR determined with FUV & 24 m, and solid symbols represent SFR determined with 24 m only. There does not appear to be any strong bias between the two methods. We reiterate our earlier statement that single band (24 m) fluxes are sufficient to determine the SFR; however, additional information from UV data improves reliability and should therefore be included when possible.
5.2. A Link Between the Growth of Pseudobulges and their Structure
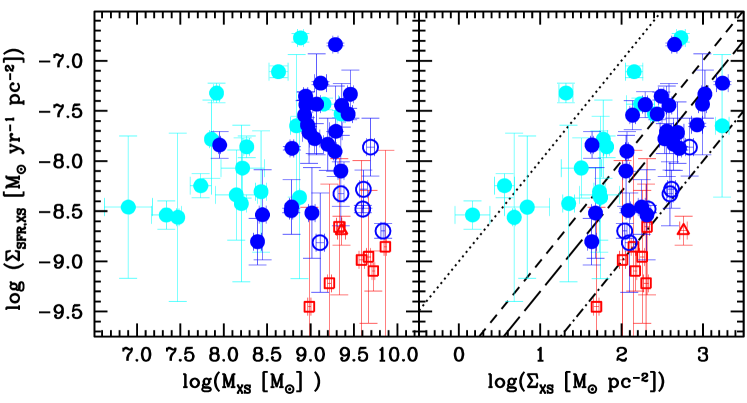
In Fig, 7 we show the SFR density of the bulge, , as a function of bulge mass, , (left panel) and mass surface density of the bulge, (right panel). To calculate densities we set , and likewise for mass density. The most striking feature in both of these panels is the absence of low-mass bulges with high SFR densities.
We find that, similar to specific SFR in Fig. 5, classical bulges have small compared to their masses, and they do not show much correlation between and mass. As was the case with mass in Fig. 5, normalizing classical bulges by area shows that their SFR is insignifigant, especially in comparison to the pseudobulges. Indeed all bulges are forming stars at similar rates, yet classical bulges are just too large for the present day SFR to be important. Inactive pseudobulges are between the classical bulges and pseudobulges. We cannot say whether there is any correlation in this space for the inactive pseudobulges. Finally, late-type bulges have comparable SFR densities as pseudobulges but are offset to lower mass.
In the right panel of Fig. 7, we show the SFR density versus mass density of the bulge, vs. . A weak positive correlation exists between mass density and SFR density of all pseudobulges. In the figure (Fig. 7) we overplot four lines that indicate different characteristic times in the simple formula,
| (9) |
where Gyr (dotted, short dash, long dash, & dot-dashed).
A linear regression fit to all active pseudobulges shows a weak postive correlation that is ; yet the correlation has somewhat high scatter, with Pearson correlation coefficient . A regression fit to all pseudobulges yields a similar correlation, but with higher scatter. In this plane, it appears as if the inactive pseudobulges lie at the low SFR end of the correlation defined by the active pseudobulges. Notice that the power of the correlation is significantly below unity. This may simply reflect different times over which significant bulge growth has occured. Also, if the ratio of present day SFR to historic SFR differs systematically from pseudobulge-to-pseudobulge then this could cause the slope in the fitted correlation to be less steep than unity.
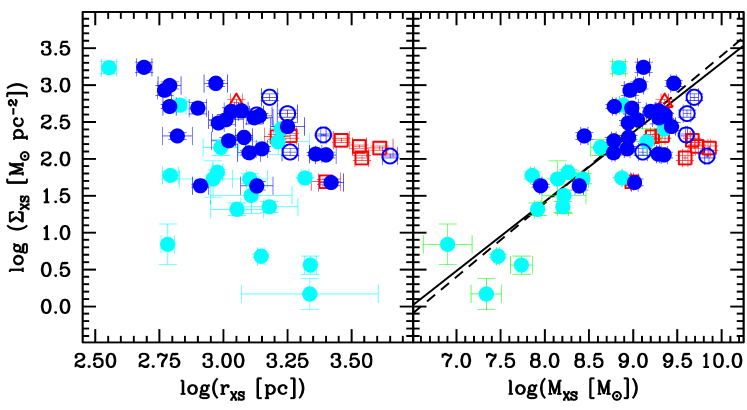
In Fig. 8 we show structural parameter correlations between bulge surface density and radial bulge size (; left panel), and bulge mass (; right panel). Similar to the right panel of Fig. 7 we show two correlations. Similar results are obtained using the half-light radius of bulges instead of (Fisher & Drory, 2008a). However, the half-light radius is ill-determined in the absence of high-resolution data from NICMOS, and using it would therefore restrict us to a much smaller sample. Further, it seems logical that the radius at which a disk ceases to be exponential (from outside-in) would be a relevant metric if secular evolution is occuring within the galaxy.
Pseudobulges show a postive correlation in the mass-density plane. For all active pseudobulges we find , with correlation coefficient ; this is shown as the solid line in Fig. 8. This correlation is remarkably close to unity. For comparison we also show a linear bisector ; the bisector is represented by a dashed line in Fig. 8. The left panel of Fig. 8 shows that when considering all actively growing bulges, there is no real correlation between surface density of the bulge and radial bulge size. Thus the radial extent of pseudobulges is independent of the mass of the bulge. These two results fit well together. If the radial size of pseudobulges is not affected by an increase in mass, then surface density and mass ought to have a linear correlation; indeed, this is what we find.
Inactive pseudobulges have systematically higher density per unit size than pseudobulges and late-type bulges, and systematically lower density for a given mass than pseudobulges. In fact, they are in the same location as classical bulges in both of these plots.
The simplistic assumption that bulges maintain a roughly constant SFR results in horizontal evolution of pseudobulges in the mass-SFR density plane (Fig. 7, left panel). Those bulges with higher would move faster, thus vacating the high- low mass region of Fig. 7. As this growth occurs, the bulge maintains roughly the same radial size, and thus moves vertically, upward, in the left panel of Fig. 8. Therefore, as bulges move horizontally from left-to-right in the plane, they move diagonally in the mass-density plane with .
5.3. Connections between The Growth Of Bulges To Outer Disks
All bulges are forming stars, as was shown in fig. 5, and SFRs in pseudobulges are high enough to suggest that this mode of growth contributes a significant fraction of their stellar mass. Now we wish to know, firstly, if this growth leads to an increase in stellar mass , and, secondly, if this growth is connected to properties of the outer disk.
If the outer disk were forming stars at high enough rates, then the galaxy will not increase stellar despite the bulge SFR. The change in the ratio of bulge mass to disk mass, , can be expressed as
| (10) |
As one can see from Eq. 10, the trend in can be determined by comparing the specific SFR of bulges to that of disks. If the bulge has a higher specific SFR than the disk, then over a time the galaxy will evolve toward earlier Hubble types.
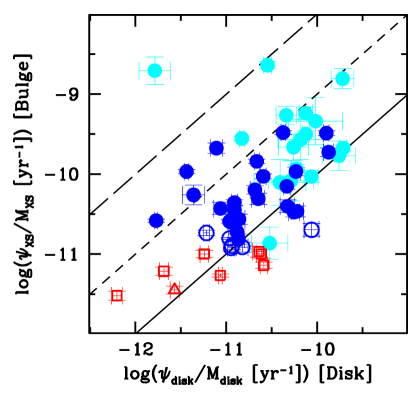
We compare the specific SFR of the bulge to that of the outer disk in Fig. 9. The solid line in represents the line of equality, the shortdashed line represents bulge growth that is ten times that of the disk, and the long-dashed line represents bulge growth that is one hundred times that of the outer disk. Galaxies above the solid line in Fig. 9 are increasing . We find that almost all (80%) of the galaxies in our sample are increasing the ratio, and thus evolving toward earlier Hubble types. Aside from one galaxy that has grown its bulge extremely fast compared to the outer disk (NGC 4580), the typical bulge is is growing at 2-6 times that of the outer disk. The small bulges, pseudobulges in late-type galaxies, are growing much faster than their outer disk, on average in late-type galaxies the bulge is growing at a rate roughly eight times that of the outer disk (again excluding NGC 4580 from that average).
If a galaxy has a classical bulge, the entire galaxy is forming fewer stars. Drory & Fisher (2007) show that galaxies with classical bulges are on the red sequence (as defined by Strateva et al. (2001)) and galaxies with pseudobulges are in the blue cloud. Also Peletier & Balcells (1996) find that bulge and disk ages are correlated from galaxy to galaxy, older bulges are in older disks. Similar to these results, we find in Fig. 9 that those disks that are not forming many stars have bulges that are not growing either, and the bulges that are the most active are in the most active disks. Thus the present-day SFR in classical bulges will not produce significant evolution in those galaxies. However, if galaxies with pseudobulges are able to supply enough gas to support their star formation, they will evolve considerably.
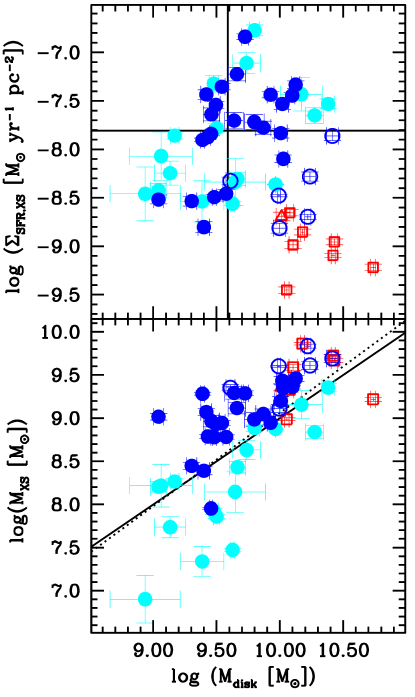
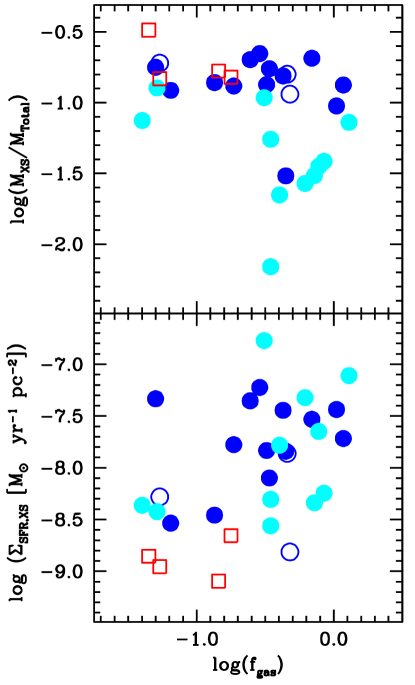
In Fig. 10, we compare the mass of disks to the mass of the bulges (bottom panel), and to the the SFR density of the bulges (top panel). Pseudobulges show a high-scatter positive correlation between the SFR density and the disk mass. In the top panel of Fig. 10, we show a horizontal line representing the median bulge SFR density (median M⊙ yr-1 kpc-2) and the vertical line represents the median disk mass (median M⊙). Larger disks are driving higher SFR densities in their centers, if the center of the galaxy contains an active pseudobulge. Less massive disks do not contain bulges with high SFR densities. Pseudobules in late-type galaxies are located in the same region of the parameter space as those in intermedate-type galaxies. In both intermediate- and late-type objects, if the disk mass is small the bulge is not forming stars as vigoroursly.
In general we find that larger bulges are in larger disks. This is not necessarily due to internal evolution, but rather it could be that all substructure is larger if more mass is available in the halo. Though, the low number of classical bulges and inactive pseudobulges in our sample prevent us from saying too much about them. The classical bulges and inactive pseudobulges in this paper tend to be slightly more massive per unit disk mass.
Pseudobulges in late-type galaxies are systematically lower in bulge mass per unit disk mass compared to pseudobulges. Of course, is part of the definition of Hubble type, so this is in no way suprising. The boundary seperating late-type and intermediate type galaxies in our sample is around , indicated bt the solid line in the bottom panel of Fig. 10. There is also a fitted relation to all active pseudobulges that indicates that the correlation of disk mass and bulge mass is almost exactly linear , with correlation coefficient . This fit is plotted as a dotted line in Fig. 10. The spread in the correlation between bulge and disk mass becomes much greater at low-disk mass.
6. Discussion
6.1. Summary of Results
In this paper we study the star formation and stellar masses in the centers of bulge-disk galaxies, with a specific emphasis on pseudobulges. Primarily, we wish to know if the present day star formation rate in pseudobulges is sufficient to have played a major role in the formation of bulges we see today. Amoung those pseudobulges with presently active star formation, the answer to this question appears to be yes. In large pseudobulges (Sa-Sbc) the present day SFR can account for half the stellar mass in 6 Gyr; in smaller pseudobulges (Sc-Sd) present day SFR needs only 2 Gyr to form their entire stellar mass.
In pseudobulges, SFR density postively correlates with both mass and mass density. A regression fit to all presently active pseudobulges yields . We argue that if the present-day SFR has been sustained for some time, then the postive correlations between mass and mass density with SFR density are expected: bulges with higher SFR densities grow faster; over a long time this process will evacuate the low-mass high-SFR-density region of parameter space, as we observe in Fig. 7. Therefore, positive correlations with mass and SFR density are constsitent with long-term internal bulge growth. We note that this arguement is only valid if pseudobulges do not change radius as they increase stellar mass; this is indeed consitent with the observation of Fisher & Drory (2008a) that low-mass pseudobulges are the same size as high mass pseudobulges.
We investigate the location of inactive pseudobulges in structural parameter correlations. We often find that inactive pseudobulges are more similar in these parameter spaces to classical bulges, than they are to pseudobulges that are actively forming stars.
We find that bulges with higher specific SFR live inside disks with higher specific SFR, though most bulges are in increasing their relative mass faster than their outer disk. Therefore, the of almost all of the galaxies in our sample is increasing. More massive disks are shown to contain both higher star formation rate densities, and more massive bulges.
6.2. Is Secular Evolution Evolution Building Pseudobulges?
Is secular evolution responsible for building pseudobulges in disk galaxies we observe today? Many observations of disk galaxies, combined with results of simulations, strongly suggest that the rearrangement of disk mass into rings and bars is also funneling gas and stars to the center of the galaxy (see Kormendy & Kennicutt, 2004; Athanassoula, 2005 and references therein for reviews). Although detailed predictions about the growth of pseuodbulges in disk galaxies do not exist, our results are consistent with expectations that derive from the idea that pseudobulges are built out of disk material.
We find a picture emerging from our data that is consistent with secular growth of bulges in disk galaxies. The specific SFR of bulges in our sample indicate that the typical pseudobulge requires roughly 5 Gyr to form at the present day SFR (shown in Fig. 5). If long-term, moderate SFR was responsible for evolving galaxies from little-to-no to , then we should not find pseudobulges with low mass and high SFR density. Indeed this is what we find in Fig. 7. Fisher & Drory (2008a) show that low-mass pseuodbulges cover the same radial extent as high-mass pseudobulges; this is replotted in Fig. 8. If pseudobulges are made slowly through internal star formation there is no violent event that rearranges the orbits of stars. Thus these bulges would stay the same size as they increase their mass, and unlike in elliptical galaxies and classical bulges the mass density would positively increase with mass. This is what is found by Fisher & Drory (2008a). Finally, if bulges are forming out of disk material it is reasonable to expect that larger disks would make larger bulges. This is indeed what we find, and show in Fig. 10. More massive pseudobulges are in more massive disks, also the highest SFR densities only occur in more massive disks. Our data suggest that small disks cannot grow large bulges.
The correlations of bulge SFR density and stellar mass with disk mass fit in well with other correlations of bulge and disk properties. There is a well-known correlation between the size of the bulge (as measured by scale-length or half-light radius) and the scale-length of the outer disk (Courteau et al., 1996b; MacArthur et al., 2003). Fisher & Drory (2008b) show that this correlation only exists in pseudobulges. Additionally, Fisher & Drory (2008a) show that at 3.6 m the size of the pseudobulges () and the half-light radius of the associated outer disk are similarly correlated. Also, Carollo et al. (2007) show that the mass of bulges is correlated with the total mass of galaxies. However, this is not too suprising since bulges contribute significant fractions of the mass. In fig. 10, we show that bulges are correlated with the disk mass. Though this does not really rule out other possible mechanisms of pseudobulge formation, it seems reasonable that secular growth of bulges would produce such connections between the stellar mass of bulges and disks.
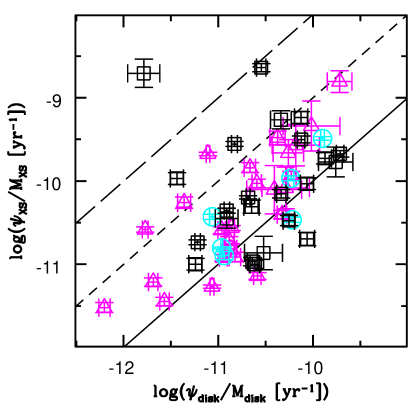
We find the correlation between the specific star formation rates of the disk and bulge particularly compelling for secular evolution. That the specific SFR of bulges and disks are correlated is no surprise; correlations between the stellar populations of bulges and disks are well known (e.g. Peletier & Balcells, 1996). What we show in Fig. 9 is that most bulges are growing faster than their associated outer disk, and this is common for both pseudobulges and classical bulges. In Fig. 11 we replot Fig. 9 which compares the specific SFR of the bulge to that of the disk, however this time the symbols represent the type of disk in the galaxy (barred galaxies are represented by magenta triangles, ovaled galaxies are represented by cyan circles and galaxies with neither bars nor ovals are represented by black squares). The solid lines indicates the line of equality; the dashed line indicates bulge growth that is the growth of the disk. For all types of galaxy disks (barred, ovaled, and disks with neither bars nor ovals) the bulge is growing faster than the disk. Further, the growth is not signifigantly more pronounced in barred and ovaled galaxies. This does not mean that bars are not important. Although the exact conditions for bar dissolution are not well understood, we know that increasing can cause a bar to fade (Shen & Sellwood, 2004; Athanassoula et al., 2005). It may be that many galaxies that are driving faster growth in destroy their bars faster. Nonetheless, we observe that most galaxies in our sample are increasing through present day star formation. If this evolution is due to internal rearrangement of disk gas and stars (i.e. secular evolution), this implies that secular evolution is a universal process, occurring in every giant galactic disk. Kormendy & Fisher (2005) discuss the universality of secular evolution. They argue that the processes that drive the internal growth of bulges arise from natural tendencies of self gravitating disks. If secular evolution is what is driving bulge growth in our sample, then it comes as no suprise that it appears common in intermediate-type galaxies. Drory & Fisher (2007) show that if a galaxy contains a classical bulge, the entire galaxy is on the red sequence. If secular evolution is occurring in all galaxies with disks, those galaxies who no longer have as much fuel for significant star formation, namely red sequence galaxies, would simply not grow as much.
The time scales of pseudobulge growth we observe are similar to the time-scale of bulge formation in simulations (Debattista et al., 2004; Heller et al., 2007a, b). Yet present-day star formation in more massive pseudobulges in our sample can only account for half of their stellar mass within a reasonable time-frame. It is likely that the SFR of pseudobulges were higher in the past just as higher historic SFRs in the past are typical in disk galaxies (Kennicutt et al., 1994). Also, simulations show that there is a signifigant amount of radial transfer of stellar mass that occurs naturally within disk galaxies Roškar et al. (2008). Taking all of these different factors into account, it seems quite reasonable to us to assume that the present-day SFR need only accound for some fraction, possibly of the order of one-half, of the mass of the bulge. Thus, the star formation rates we observe in nearby pseudobulges are sufficient to form their stellar mass, and are not so high as to require some mechanism to shut off secular evolution in many galaxies.
Also, it is quite possible that the stellar mass in present day pseudobulges arises from multiple evolutionary mechanisms. Carollo et al. (2007) find an underlying population of old stars in many very late-type bulges. Cox et al. (2008) show that very minor mergers do not signifigantly alter the SFR of disk galaxies, thus it may be that part of the mass is directly accreted while or before a pseudobulge is built in the same galaxy. Also, clump instabilities occur frequently in simulations (e.g. Noguchi, 1999; Immeli et al., 2004; Debattista et al., 2006), and the clumps fall to the center of the galaxy. The result is a central density that is higher than the inward extrapolation of the disk profile. These clumps may have been observed in high redshift galaxies (Bournaud et al., 2008). However, Elmegreen et al. (2008) show that these clumps genarally heat the disk, and produce structures looking more similar to classical bulges than to pseudobulges. Also, accretion of mass to make half the bulge mass is likely to heat a disk (Toth & Ostriker, 1992; Velazquez & White, 1999), therefore stabilizing the disk against efficient mechanisms to drive more radial gas and mass inflow.
6.3. Future Pseudobulge Growth In Late-Type Galaxies
If secular evolution is responsible for pseudobulges, then it makes sense that there is a distribution of bulge-to-total ratios that extends all the way to zero. Fisher & Drory (2008a) show that late-type bulges and pseudobulges form a sequence in the mass versus surface density plane; this is reproduced in Fig. 8. Also, late-type bulges are roughly the same size as pseudobulges (as measured by ). Thus, it appears that adding stellar mass to late-type bulges would make them similar to pseudobulges in intermediate-type galaxies.
Is there enough gas in the bulges of late-type galaxies to build a pseudobulge in the future? We combine the central surface density of gas from BIMA SONG (Helfer et al., 2003; Sheth et al., 2005) and our SFR densities to determine gas consumption time scales. Given the small sample this produces, the results should only be taken as suggestive. A more rigorous study is needed for a more accurate analysis. We find gas consumption times of 5-8 Gyr, very similar to the typical pseudobulge doubling time which is about 5 Gyr. However, some of the smaller late-type bulges are an order of magnitude smaller than the typical pseudobulge.
We combine our sample with nuclear gas masses from Sheth et al. (2005); we find that if late-type pseudobulges continue consuming the gas in their centers at the same rates as today, only the few with the highest nuclear gas masses (which typically have M⊙ yr-1) will be able to build a pseudobulge before running out of gas in the center. Thus if the smaller pseudobulges in late-type galaxies with lower SFR are to build larger pseudobulges, then gas must be driven inward from the outer disk. However, as discussed by Sheth et al. (2005) it is not trivial to get the gas to the center of the galaxy. Nonetheless, we ask if there is a large enough reservoir of gas in the whole galaxy to supply late-type bulges with enough gas to grow a pseudobulges more similar to those in intermediate-type galaxies.
Some late-type bulges have capacity to grow into typical pseudobulges, but not all. In Fig. 12, we compare the gas mass fraction, , to bulge-to-total ratio (top panel) and the SFR density of the bulge (bottom panel). Note that the quantity is describing the entire galaxy, not just the bulge. We use gas masses reported in (Sheth et al., 2005) and (Kennicutt, 1998a). In this sample, late-type pseudobulges have similar total gas fractions on average as the population of pseudobulges. There is enough gas in the entire galaxy in the lowest pseudobulges systems to build a bulge with (given that the process of gas inflow and conversion into stars can maintain an efficiency of order 10%). However, at the current SFR this would take longer than a Hubble time for smaller late-type pseudobulges.
There is some evidence that disk mass plays an important role. In Fig. 10 we show that massive bulges exist only in massive disks, and that the spread in increases for lower-mass disks. Yet, M 101 is an unbarred Sc galaxy with total stellar mass , a total SFR of and gas fraction of . These three properties are similar to M 63, an unbarred Sbc galaxy with , a total SFR of , and gas fraction of . The total mass is less than a factor of 2 different, the total SFR is similar, yet M 63 has a pseudobulge mass of but M 101 has a bulge that is 2 orders of magnitude smaller, . It seems that having a large disk mass is necessary, but not sufficient to form a large pseudobulge.
Bars in early type galaxies are longer than bars in late-type galaxies (Erwin, 2005). It may be that bars observed in Sa-Sbc galaxies are able to fuel more active growth of pseudobulges than bars in later types. However, Combes & Elmegreen (1993) show with simulations that as bars grow they also slow down and become longer; therefore it seems possible that the difference in bar types is a consequence of the difference in bulge mass, or at least they arise from a common process. Also recall from Fig. 11, that barred galaxies are not showing faster growth. It is possible that some other process such as external accretion of satellites could supply the disk with cold gas that may foster secular evoution (see Bournaud & Combes, 2002). It may be worth noting that warps in disks due to accretion survive in simulations for times that are comparable to the typical growth time of a pseuodbulges, a few Gyr (Shen & Sellwood, 2006). If accretion triggers internal evolution, this generates a seeemingly arbitrary, and possibly unobservable, distinction between those galaxies that form large pseudobulges (%) and those with almost no bulge at all, as in M 101.
Other possibilities for generating the differences between galaxies with massive pseudobulges and those with small pseudobulges include dark matter halo-triaxiality or other couplings between baryonic mass and dark matter properties (Foyle et al., 2008, e.g.). Finally, it may just be a matter of time. Fig. 10 shows that late-type bulges and pseudobulges at the same disk mass have the same SFR density; if internal evolution continues driving gas to the centers of late-type disk galaxies it may be that in a few Gyr M 101 will look similar to galaxies like NGC 5055 in as well as in other properties.
6.4. Inactive Pseudobulges or Acitve Classical Bulges?
In §5 we distinguish galaxies based upon two seperate properties. First, galaxies are seperated via morphology; we call those bulges that possess disk-like structure, as outlined in Kormendy & Kennicutt (2004), pseudobulges and those with bulges that better resemble E-type galaxies classical bulges. However, we notice that the set of pseudobulges has two subsets: those that actively form stars and those that are inactive.
In all cases involving star formation rates, inactive pseudobulges are found between (active) pseudobulges and classical bulges. Yet, their nuclear morphology is similar to pseudobulges. Furthermore, they have Sérsic index less than two, which strengthens the claim that they are pseudobulges (Fisher & Drory, 2008b). However, in the structural parameter correlations, presented in Fisher & Drory (2008a), when we distinguish the bulges based not just on morphology but also specific SFR the inactive pseudobulges appear more like classical bulges than pseudobulges. Their true nature is thus, somewhat uncertain.
Inactive pseudobulges seem to be transition objects in parameter space, and possibly in formation mechanism. In Fig. 9 we show that all bulges in our sample are growing faster than their outer disk, and this is independent of the type of bulge. Thus, if secular evolution is driving this trend, and if the bulge is small enough and the disk has enough gas, it is possible that a pseudobulge could grow on top of the classical bulge. In this case the bulge mass would be high with respect to the SFR, because a large fraction of the mass is in a classical bulge. This argument is supported by the fact that inactive pseudobulges typically have higher than active pseudobulges.
Secondly, it is also possible that inactive pseudobulges are galaxies in which secular evolution is effectively shutting off. We note again that inactive pseudobulges are the largest pseudobulges, thus it is possible that the disk has built a large bulge that now stabilzes the disk against large scale instabilities, as has been seen in many simulations (e.g. Friedli & Benz, 1993; Shen & Sellwood, 2004; Athanassoula et al., 2005). However, this would not explain why inactive pseudobulges look more similar to classical bulges in structural parameter correlations.
It is possible that we are seeing externally driven star formation in a few classical bulges. This would explain why the structural properties of inactive pseudobulges are so similar to classical bulges, seen in Fig. 8. Also, it appears that in both the and planes (Fig. 5) inactive pseudobulges show similar behavior to classical bulges that is shifted slightly toward higher SFR. We note that M 81, which is denoted in each figure as a red triangle, has a classical bulge and the galaxy is known to be interacting with nearby M 82. Thus, it has dust in the bulge that is easily seen in MIPS and IRAC 8 m images (Gordon et al., 2004). Inactive pseudobulges have different optical morphology and also much higher specific SFR than M 81. However, since M 81 is the largest bulge in our sample, it is probably not the best comparison object. This would imply that the method classifying bulges based on the presence of disk-like morpholgy may be flawed in this respect, and that 6 out of 22 pseudobulges in our sample would be misclassified. However, it would be hard to explain why inactive pseudobulges have Sérsic indices below 2 just like pseudobulges and unlike any classical bulges.
Given these three possibilities we do not know what the true nature of inactive pseuodbulges is. It is quite possible that inactive pseudobulges are a mixed bag of objects, that some are evolved pseudobulges, others true composites, and some are active classical bulges. Furture work involving dynamics may be more revealing of their physical nature. Nonetheless, the existance of inactive pseuodbulges in no way denies the fact that active pseuodbulges are growing rapidly. We note in Tables 1 & 2 that these galaxies do not have significantly perturbed global morphology. Recall that in Fig. 5 we show that some pseudobulges have sufficient SFR to double their stellar mass in 1-2 Gyr. If this star formation were due to non-secular means, (namely mergers) it is unlikely that the merger remnant would have relaxed so much as to form a cold disk with a central bulge yet star burst.
References
- Aaronson et al. (1979) Aaronson, M., Huchra, J., & Mould, J. 1979, ApJ, 229, 1
- Abazajian & Sloan Digital Sky Survey (2008) Abazajian, K., & Sloan Digital Sky Survey, f. t. 2008, ArXiv e-prints
- Athanassoula (1992) Athanassoula, E. 1992, MNRAS, 259, 345
- Athanassoula (2005) —. 2005, MNRAS, 358, 1477
- Athanassoula et al. (2005) Athanassoula, E., Lambert, J. C., & Dehnen, W. 2005, MNRAS, 363, 496
- Bell (2003) Bell, E. F. 2003, ApJ, 586, 794
- Bell & de Jong (2000) Bell, E. F., & de Jong, R. S. 2000, MNRAS, 312, 497
- Bell & de Jong (2001) —. 2001, ApJ, 550, 212
- Bender & Moellenhoff (1987) Bender, R., & Moellenhoff, C. 1987, A&A, 177, 71
- Bigiel et al. (2008) Bigiel, F., Leroy, A., Walter, F., Brinks, E., de Blok, W. J. G., Madore, B., & Thornley, M. D. 2008, ArXiv e-prints
- Boissier et al. (2007) Boissier, S., Gil de Paz, A., Boselli, A., Madore, B. F., Buat, V., Cortese, L., Burgarella, D., Muñoz-Mateos, J. C., Barlow, T. A., Forster, K., Friedman, P. G., Martin, D. C., Morrissey, P., Neff, S. G., Schiminovich, D., Seibert, M., Small, T., Wyder, T. K., Bianchi, L., Donas, J., Heckman, T. M., Lee, Y.-W., Milliard, B., Rich, R. M., Szalay, A. S., Welsh, B. Y., & Yi, S. K. 2007, ApJS, 173, 524
- Bournaud & Combes (2002) Bournaud, F., & Combes, F. 2002, A&A, 392, 83
- Bournaud et al. (2008) Bournaud, F., Daddi, E., Elmegreen, B. G., Elmegreen, D. M., Nesvadba, N., Vanzella, E., Di Matteo, P., Le Tiran, L., Lehnert, M., & Elbaz, D. 2008, ArXiv e-prints, 803
- Calzetti et al. (2005) Calzetti, D., Kennicutt, R. C., Bianchi, L., Thilker, D. A., Dale, D. A., Engelbracht, C. W., Leitherer, C., Meyer, M. J., Sosey, M. L., Mutchler, M., Regan, M. W., Thornley, M. D., Armus, L., Bendo, G. J., Boissier, S., Boselli, A., Draine, B. T., Gordon, K. D., Helou, G., Hollenbach, D. J., Kewley, L., Madore, B. F., Martin, D. C., Murphy, E. J., Rieke, G. H., Rieke, M. J., Roussel, H., Sheth, K., Smith, J. D., Walter, F., White, B. A., Yi, S., Scoville, N. Z., Polletta, M., & Lindler, D. 2005, ApJ, 633, 871
- Calzetti et al. (2007) Calzetti, D., Kennicutt, R. C., Engelbracht, C. W., Leitherer, C., Draine, B. T., Kewley, L., Moustakas, J., Sosey, M., Dale, D. A., Gordon, K. D., Helou, G. X., Hollenbach, D. J., Armus, L., Bendo, G., Bot, C., Buckalew, B., Jarrett, T., Li, A., Meyer, M., Murphy, E. J., Prescott, M., Regan, M. W., Rieke, G. H., Roussel, H., Sheth, K., Smith, J. D. T., Thornley, M. D., & Walter, F. 2007, ApJ, 666, 870
- Calzetti et al. (1994) Calzetti, D., Kinney, A. L., & Storchi-Bergmann, T. 1994, ApJ, 429, 582
- Cardelli et al. (1989) Cardelli, J. A., Clayton, G. C., & Mathis, J. S. 1989, ApJ, 345, 245
- Carollo et al. (2007) Carollo, C. M., Scarlata, C., Stiavelli, M., Wyse, R. F. G., & Mayer, L. 2007, ApJ, 658, 960
- Carollo et al. (1997) Carollo, C. M., Stiavelli, M., de Zeeuw, P. T., & Mack, J. 1997, AJ, 114, 2366
- Cheng et al. (1997) Cheng, K. P., Collins, N., Angione, R., Talbert, F., Hintzen, P., Smith, E. P., Stecher, T., & The UIT Team, eds. 1997, Uv/visible Sky Gallery on CDROM
- Ciotti & Bertin (1999) Ciotti, L., & Bertin, G. 1999, A&A, 352, 447
- Combes & Elmegreen (1993) Combes, F., & Elmegreen, B. G. 1993, A&A, 271, 391
- Combes & Sanders (1981) Combes, F., & Sanders, R. H. 1981, A&A, 96, 164
- Courteau et al. (1996a) Courteau, S., de Jong, R. S., & Broeils, A. H. 1996a, ApJ, 457, L73+
- Courteau et al. (1996b) —. 1996b, ApJ, 457, L73+
- Cox et al. (2008) Cox, T. J., Jonsson, P., Somerville, R. S., Primack, J. R., & Dekel, A. 2008, MNRAS, 384, 386
- Dale et al. (2007) Dale, D. A., Gil de Paz, A., Gordon, K. D., Hanson, H. M., Armus, L., Bendo, G. J., Bianchi, L., Block, M., Boissier, S., Boselli, A., Buckalew, B. A., Buat, V., Burgarella, D., Calzetti, D., Cannon, J. M., Engelbracht, C. W., Helou, G., Hollenbach, D. J., Jarrett, T. H., Kennicutt, R. C., Leitherer, C., Li, A., Madore, B. F., Martin, D. C., Meyer, M. J., Murphy, E. J., Regan, M. W., Roussel, H., Smith, J. D. T., Sosey, M. L., Thilker, D. A., & Walter, F. 2007, ApJ, 655, 863
- de Vaucouleurs et al. (1991) de Vaucouleurs, G., de Vaucouleurs, A., Corwin, Jr., H. G., Buta, R. J., Paturel, G., & Fouque, P. 1991, Third Reference Catalogue of Bright Galaxies (Volume 1-3, XII, 2069 pp. 7 figs.. Springer-Verlag Berlin Heidelberg New York)
- Debattista et al. (2004) Debattista, V. P., Carollo, C. M., Mayer, L., & Moore, B. 2004, ApJ, 604, L93
- Debattista et al. (2006) Debattista, V. P., Mayer, L., Carollo, C. M., Moore, B., Wadsley, J., & Quinn, T. 2006, ApJ, 645, 209
- Drory & Fisher (2007) Drory, N., & Fisher, D. B. 2007, ApJ, 664, 640
- Elmegreen et al. (2008) Elmegreen, B. G., Bournaud, F., & Elmegreen, D. M. 2008, ArXiv e-prints, 808
- Erwin (2005) Erwin, P. 2005, MNRAS, 364, 283
- Erwin & Sparke (2002) Erwin, P., & Sparke, L. S. 2002, AJ, 124, 65
- Eskridge et al. (2000) Eskridge, P. B., Frogel, J. A., Pogge, R. W., Quillen, A. C., Davies, R. L., DePoy, D. L., Houdashelt, M. L., Kuchinski, L. E., Ramírez, S. V., Sellgren, K., Terndrup, D. M., & Tiede, G. P. 2000, AJ, 119, 536
- Fabricius et al. (2008) Fabricius, M. H., Drory, N., & Fisher, D. B. 2008, In Preperation
- Falcón-Barroso et al. (2006) Falcón-Barroso, J., Bacon, R., Bureau, M., Cappellari, M., Davies, R. L., de Zeeuw, P. T., Emsellem, E., Fathi, K., Krajnović, D., Kuntschner, H., McDermid, R. M., Peletier, R. F., & Sarzi, M. 2006, MNRAS, 369, 529
- Fathi & Peletier (2003) Fathi, K., & Peletier, R. F. 2003, A&A, 407, 61
- Fisher (2006) Fisher, D. B. 2006, ApJ, 642, L17
- Fisher & Drory (2008a) Fisher, D. B., & Drory, N. 2008a, ApJ, submitted
- Fisher & Drory (2008b) —. 2008b, AJ, 136, 773
- Foyle et al. (2008) Foyle, K., Courteau, S., & Thacker, R. J. 2008, MNRAS, 386, 1821
- Frei et al. (1996) Frei, Z., Guhathakurta, P., Gunn, J. E., & Tyson, J. A. 1996, AJ, 111, 174
- Friedli & Benz (1993) Friedli, D., & Benz, W. 1993, A&A, 268, 65
- Gadotti (2008) Gadotti, D. A. 2008, ArXiv e-prints
- Gadotti & dos Anjos (2001) Gadotti, D. A., & dos Anjos, S. 2001, AJ, 122, 1298
- Ganda et al. (2007) Ganda, K., Peletier, R. F., McDermid, R. M., Falcón-Barroso, J., de Zeeuw, P. T., Bacon, R., Cappellari, M., Davies, R. L., Emsellem, E., Krajnović, D., Kuntschner, H., Sarzi, M., & van de Ven, G. 2007, MNRAS, 380, 506
- Genzel et al. (2008) Genzel, R., Burkert, A., Bouche, N., Cresci, G., Foerster Schreiber, N. M., Shapley, A., Shapiro, K., Tacconi, L. J., Buschkamp, P., Cimatti, A., Daddi, E., Davies, R., Eisenhauer, F., Erb, D. K., Genel, S., Gerhard, O., Hicks, E., Lutz, D., Naab, T., Ott, T., Rabien, S., Renzini, A., Steidel, C. C., Sternberg, A., & Lilly, S. J. 2008, ArXiv e-prints, 807
- Gordon et al. (2004) Gordon, K. D., Pérez-González, P. G., Misselt, K. A., Murphy, E. J., Bendo, G. J., Walter, F., Thornley, M. D., Kennicutt, Jr., R. C., Rieke, G. H., Engelbracht, C. W., Smith, J.-D. T., Alonso-Herrero, A., Appleton, P. N., Calzetti, D., Dale, D. A., Draine, B. T., Frayer, D. T., Helou, G., Hinz, J. L., Hines, D. C., Kelly, D. M., Morrison, J. E., Muzerolle, J., Regan, M. W., Stansberry, J. A., Stolovy, S. R., Storrie-Lombardi, L. J., Su, K. Y. L., & Young, E. T. 2004, ApJS, 154, 215
- Hameed & Devereux (1999) Hameed, S., & Devereux, N. 1999, AJ, 118, 730
- Helfer et al. (2003) Helfer, T. T., Thornley, M. D., Regan, M. W., Wong, T., Sheth, K., Vogel, S. N., Blitz, L., & Bock, D. C.-J. 2003, ApJS, 145, 259
- Heller et al. (2007a) Heller, C. H., Shlosman, I., & Athanassoula, E. 2007a, ApJ, 657, L65
- Heller et al. (2007b) —. 2007b, ApJ, 671, 226
- Ho et al. (1997) Ho, L. C., Filippenko, A. V., & Sargent, W. L. W. 1997, ApJS, 112, 315
- Holtzman et al. (1995) Holtzman, J. A., Burrows, C. J., Casertano, S., Hester, J. J., Trauger, J. T., Watson, A. M., & Worthey, G. 1995, PASP, 107, 1065
- Immeli et al. (2004) Immeli, A., Samland, M., Gerhard, O., & Westera, P. 2004, A&A, 413, 547
- Jogee et al. (2004) Jogee, S., Barazza, F. D., Rix, H.-W., Shlosman, I., Barden, M., Wolf, C., Davies, J., Heyer, I., Beckwith, S. V. W., Bell, E. F., Borch, A., Caldwell, J. A. R., Conselice, C. J., Dahlen, T., Häussler, B., Heymans, C., Jahnke, K., Knapen, J. H., Laine, S., Lubell, G. M., Mobasher, B., McIntosh, D. H., Meisenheimer, K., Peng, C. Y., Ravindranath, S., Sanchez, S. F., Somerville, R. S., & Wisotzki, L. 2004, ApJ, 615, L105
- Jogee et al. (2005) Jogee, S., Scoville, N., & Kenney, J. D. P. 2005, ApJ, 630, 837
- Kauffmann (1996) Kauffmann, G. 1996, MNRAS, 281, 487
- Kautsch et al. (2006) Kautsch, S. J., Grebel, E. K., Barazza, F. D., & Gallagher, III, J. S. 2006, A&A, 445, 765
- Kennicutt (1998a) Kennicutt, R. C. 1998a, ApJ, 498, 541
- Kennicutt et al. (2003) Kennicutt, R. C., Armus, L., Bendo, G., Calzetti, D., Dale, D. A., Draine, B. T., Engelbracht, C. W., Gordon, K. D., Grauer, A. D., Helou, G., Hollenbach, D. J., Jarrett, T. H., Kewley, L. J., Leitherer, C., Li, A., Malhotra, S., Regan, M. W., Rieke, G. H., Rieke, M. J., Roussel, H., Smith, J.-D. T., Thornley, M. D., & Walter, F. 2003, PASP, 115, 928
- Kennicutt (1998b) Kennicutt, Jr., R. C. 1998b, ARA&A, 36, 189
- Kennicutt et al. (1994) Kennicutt, Jr., R. C., Tamblyn, P., & Congdon, C. E. 1994, ApJ, 435, 22
- Knapen et al. (2004) Knapen, J. H., Stedman, S., Bramich, D. M., Folkes, S. L., & Bradley, T. R. 2004, A&A, 426, 1135
- Koopmann et al. (2001) Koopmann, R. A., Kenney, J. D. P., & Young, J. 2001, ApJS, 135, 125
- Kormendy (1982) Kormendy, J. 1982, in Saas-Fee Advanced Course 12: Morphology and Dynamics of GalaxiesSaas-Fee Vol. 12: Morphology and Dynamics of Galaxies, 113–288
- Kormendy (1993) Kormendy, J. 1993, in IAU Symp. 153: Galactic Bulges, 209–+
- Kormendy & Fisher (2005) Kormendy, J., & Fisher, D. B. 2005, in Revista Mexicana de Astronomia y Astrofisica Conference Series, Vol. 23, Revista Mexicana de Astronomia y Astrofisica Conference Series, ed. S. Torres-Peimbert & G. MacAlpine, 101–108
- Kormendy & Kennicutt (2004) Kormendy, J., & Kennicutt, R. C. 2004, ARA&A, 42, 603
- Kormendy et al. (2008) Kormendy, J. K., Fisher, D. B., Cornell, M. E., & Bender, R. 2008, Accepted
- Kuchinski et al. (2000) Kuchinski, L. E., Freedman, W. L., Madore, B. F., Trewhella, M., Bohlin, R. C., Cornett, R. H., Fanelli, M. N., Marcum, P. M., Neff, S. G., O’Connell, R. W., Roberts, M. S., Smith, A. M., Stecher, T. P., & Waller, W. H. 2000, ApJS, 131, 441
- Larsen & Richtler (1999) Larsen, S. S., & Richtler, T. 1999, A&A, 345, 59
- Lauer (1985) Lauer, T. R. 1985, ApJS, 57, 473
- Lauer et al. (2005) Lauer, T. R., Faber, S. M., Gebhardt, K., Richstone, D., Tremaine, S., Ajhar, E. A., Aller, M. C., Bender, R., Dressler, A., Filippenko, A. V., Green, R., Grillmair, C. J., Ho, L. C., Kormendy, J., Magorrian, J., Pinkney, J., & Siopis, C. 2005, AJ, 129, 2138
- MacArthur et al. (2004) MacArthur, L. A., Courteau, S., Bell, E., & Holtzman, J. A. 2004, ApJS, 152, 175
- MacArthur et al. (2003) MacArthur, L. A., Courteau, S., & Holtzman, J. A. 2003, ApJ, 582, 689
- Martin et al. (2005) Martin, D. C., Fanson, J., Schiminovich, D., Morrissey, P., Friedman, P. G., Barlow, T. A., Conrow, T., Grange, R., Jelinsky, P. N., Milliard, B., Siegmund, O. H. W., Bianchi, L., Byun, Y.-I., Donas, J., Forster, K., Heckman, T. M., Lee, Y.-W., Madore, B. F., Malina, R. F., Neff, S. G., Rich, R. M., Small, T., Surber, F., Szalay, A. S., Welsh, B., & Wyder, T. K. 2005, ApJ, 619, L1
- Moorthy & Holtzman (2005) Moorthy, B. K., & Holtzman, J. A. 2005, astro-ph/0512346
- Noguchi (1999) Noguchi, M. 1999, ApJ, 514, 77
- Norman et al. (1996) Norman, C. A., Sellwood, J. A., & Hasan, H. 1996, ApJ, 462, 114
- Peeples & Martini (2006) Peeples, M. S., & Martini, P. 2006, ApJ, 652, 1097
- Peletier & Balcells (1996) Peletier, R. F., & Balcells, M. 1996, AJ, 111, 2238
- Peletier et al. (2007) Peletier, R. F., Falcón-Barroso, J., Bacon, R., Cappellari, M., Davies, R. L., de Zeeuw, P. T., Emsellem, E., Ganda, K., Krajnović, D., Kuntschner, H., McDermid, R. M., Sarzi, M., & van de Ven, G. 2007, MNRAS, 379, 445
- Pfenniger & Norman (1990) Pfenniger, D., & Norman, C. 1990, ApJ, 363, 391
- Prugniel & Heraudeau (1998) Prugniel, P., & Heraudeau, P. 1998, A&AS, 128, 299
- Purcell et al. (2008) Purcell, C. W., Kazantzidis, S., & Bullock, J. S. 2008, ArXiv e-prints
- Regan et al. (2001) Regan, M. W., Thornley, M. D., Helfer, T. T., Sheth, K., Wong, T., Vogel, S. N., Blitz, L., & Bock, D. C.-J. 2001, ApJ, 561, 218
- Regan et al. (2006) Regan, M. W., Thornley, M. D., Vogel, S. N., Sheth, K., Draine, B. T., Hollenbach, D. J., Meyer, M., Dale, D. A., Engelbracht, C. W., Kennicutt, R. C., Armus, L., Buckalew, B., Calzetti, D., Gordon, K. D., Helou, G., Leitherer, C., Malhotra, S., Murphy, E., Rieke, G. H., Rieke, M. J., & Smith, J. D. 2006, ApJ, 652, 1112
- Renzini (1999) Renzini, A. 1999, in The Formation of Galactic Bulges, ed. C. M. Carollo, H. C. Ferguson, & R. F. G. Wyse, 9–+
- Rix & Rieke (1993) Rix, H.-W., & Rieke, M. J. 1993, ApJ, 418, 123
- Roškar et al. (2008) Roškar, R., Debattista, V. P., Quinn, T. R., Stinson, G. S., & Wadsley, J. 2008, ApJ, 684, L79
- Sakamoto et al. (1999) Sakamoto, K., Okumura, S. K., Ishizuki, S., & Scoville, N. Z. 1999, ApJ, 525, 691
- Sandage & Bedke (1994) Sandage, A., & Bedke, J. 1994, The Carnegie atlas of galaxies (Washington, DC: Carnegie Institution of Washington with The Flintridge Foundation, —c1994)
- Scalo (1986) Scalo, J. M. 1986, Fundamentals of Cosmic Physics, 11, 1
- Schlegel et al. (1998) Schlegel, D. J., Finkbeiner, D. P., & Davis, M. 1998, ApJ, 500, 525
- Schweizer (2005) Schweizer, F. 2005, in ASSL Vol. 329: Starbursts: From 30 Doradus to Lyman Break Galaxies, 143–+
- Seibert et al. (2005) Seibert, M., Martin, D. C., Heckman, T. M., Buat, V., Hoopes, C., Barlow, T., Bianchi, L., Byun, Y.-I., Donas, J., Forster, K., Friedman, P. G., Jelinsky, P., Lee, Y.-W., Madore, B. F., Malina, R., Milliard, B., Morrissey, P., Neff, S., Rich, R. M., Schiminovich, D., Siegmund, O., Small, T., Szalay, A. S., Welsh, B., & Wyder, T. K. 2005, ApJ, 619, L55
- Shen & Sellwood (2004) Shen, J., & Sellwood, J. A. 2004, ApJ, 604, 614
- Shen & Sellwood (2006) —. 2006, MNRAS, 370, 2
- Sheth et al. (2005) Sheth, K., Vogel, S. N., Regan, M. W., Thornley, M. D., & Teuben, P. J. 2005, ApJ, 632, 217
- Simkin et al. (1980) Simkin, S. M., Su, H. J., & Schwarz, M. P. 1980, ApJ, 237, 404
- Sirianni et al. (2005) Sirianni, M., Jee, M. J., Benítez, N., Blakeslee, J. P., Martel, A. R., Meurer, G., Clampin, M., De Marchi, G., Ford, H. C., Gilliland, R., Hartig, G. F., Illingworth, G. D., Mack, J., & McCann, W. J. 2005, PASP, 117, 1049
- Skrutskie et al. (2006) Skrutskie, M. F., Cutri, R. M., Stiening, R., Weinberg, M. D., Schneider, S., Carpenter, J. M., Beichman, C., Capps, R., Chester, T., Elias, J., Huchra, J., Liebert, J., Lonsdale, C., Monet, D. G., Price, S., Seitzer, P., Jarrett, T., Kirkpatrick, J. D., Gizis, J. E., Howard, E., Evans, T., Fowler, J., Fullmer, L., Hurt, R., Light, R., Kopan, E. L., Marsh, K. A., McCallon, H. L., Tam, R., Van Dyk, S., & Wheelock, S. 2006, AJ, 131, 1163
- Smith et al. (2002) Smith, J. A., Tucker, D. L., Kent, S., Richmond, M. W., Fukugita, M., Ichikawa, T., Ichikawa, S.-i., Jorgensen, A. M., Uomoto, A., Gunn, J. E., Hamabe, M., Watanabe, M., Tolea, A., Henden, A., Annis, J., Pier, J. R., McKay, T. A., Brinkmann, J., Chen, B., Holtzman, J., Shimasaku, K., & York, D. G. 2002, AJ, 123, 2121
- Steinmetz & Muller (1995) Steinmetz, M., & Muller, E. 1995, MNRAS, 276, 549
- Stewart et al. (2008) Stewart, K. R., Bullock, J. S., Wechsler, R. H., Maller, A. H., & Zentner, A. R. 2008, ApJ, 683, 597
- Strateva et al. (2001) Strateva, I., Ivezić, Ž., Knapp, G. R., Narayanan, V. K., Strauss, M. A., Gunn, J. E., Lupton, R. H., Schlegel, D., Bahcall, N. A., Brinkmann, J., Brunner, R. J., Budavári, T., Csabai, I., Castander, F. J., Doi, M., Fukugita, M., Győry, Z., Hamabe, M., Hennessy, G., Ichikawa, T., Kunszt, P. Z., Lamb, D. Q., McKay, T. A., Okamura, S., Racusin, J., Sekiguchi, M., Schneider, D. P., Shimasaku, K., & York, D. 2001, AJ, 122, 1861
- Thomas & Davies (2006) Thomas, D., & Davies, R. L. 2006, MNRAS, 366, 510
- Toth & Ostriker (1992) Toth, G., & Ostriker, J. P. 1992, ApJ, 389, 5
- Tully et al. (1996) Tully, R. B., Verheijen, M. A. W., Pierce, M. J., Huang, J.-S., & Wainscoat, R. J. 1996, AJ, 112, 2471
- Velazquez & White (1999) Velazquez, H., & White, S. D. M. 1999, MNRAS, 304, 254
- Weinzirl et al. (2008) Weinzirl, T., Jogee, S., Khochfar, S., Burkert, A., & Kormendy, J. 2008, ArXiv e-prints, 807
- Whitford (1978) Whitford, A. E. 1978, ApJ, 226, 777
- Wu et al. (2005) Wu, J., Evans, II, N. J., Gao, Y., Solomon, P. M., Shirley, Y. L., & Vanden Bout, P. A. 2005, ApJ, 635, L173
- Zhang (1999) Zhang, X. 1999, ApJ, 518, 613
| Identifier | Alt. | Dist. | Bulge | Hubble | Disk | MB | dd† indicates new decomposition; otherwise is taken from Fisher & Drory (2008b). | Total Stellar Mass | eeSources are as follows: (1)–Sheth et al. (2005); (2)–Kennicutt (1998a) | |
|---|---|---|---|---|---|---|---|---|---|---|
| Name | (Mpc) | TypeaaC – classical bulge; P – pseudobulge; P(I) – pseudobulge designated as inactive; P(L) – pseudobulge in a late-type galaxy. | TypebbTaken from Sandage & Bedke (1994) | TypeccB – Barred Disk; O – Ovalled Disk; U – Unbarred & Onovalled. | (B mags) | (M⊙ yr-1) | ( M⊙) | |||
| NGC 1617 | 13.78 | C | Sa | B | -19.5 | 2.04 0.22 † | 0.03 0.002 | 12.7 0.9 | … | |
| NGC 2775 | 14.42 | C | SB0/a | U | -19.7 | 3.80 0.19 | 0.09 0.013 | 16.5 1.1 | … | |
| NGC 2841 | 8.96 | C | Sb | U | -19.7 | 2.15 0.24 | 0.23 0.027 | 14.1 0.5 | 0.29 (1) | |
| NGC 3031 | M 81 | 3.91 | C | Sb | U | -20.2 | 3.79 0.20 | 0.36 0.020 | 22.6 2.3 | 0.07 (1) |
| NGC 4450 | 14.28 | C | Sab | B | -19.9 | 3.67 0.29 † | 0.07 0.007 | 31.8 1.8 | 0.09 (1) | |
| NGC 4698 | 15 | C | Sa | B | -19.3 | 3.60 0.26 | 0.03 0.004 | 56.4 2.7 | 0.01 (2) | |
| NGC 4725 | 16.32 | C | Sa | B | -21.1 | 5.23 0.18 | 0.21 0.006 | 31.5 1.1 | 0.24 (1) | |
| NGC 6744 | 10.28 | C | SBbc | B | -20.9 | 2.53 0.30 | 0.27 0.021 | 12.3 0.5 | … | |
| NGC 3368 | M 96 | 13 | P(I) | Sab | O | -20.5 | 1.71 0.37 | 0.20 0.011 | 21.5 2.2 | 0.09 (1) |
| NGC 3953 | 13.24 | P(I) | SBbc | B | -20.1 | 2.69 0.37 † | 0.15 0.014 | 11.2 1.2 | 0.77 (1) | |
| NGC 4274 | 13.17 | P(I) | Sa | O | -19.3 | 1.82 0.24 | 0.14 0.002 | 13.7 0.4 | … | |
| NGC 7177 | 16 | P(I) | Sab | B | -19.2 | 1.51 0.18 | 0.06 0.003 | 6.3 0.5 | … | |
| NGC 7217 | 16.63 | P(I) | Sb | U | -20.1 | 3.52 0.20 | 0.20 0.010 | 23.3 1.3 | … | |
| NGC 7331 | 13.24 | P(I) | Sb | U | -20.4 | 4.53 0.45 † | 2.09 0.322 | 31.1 3.3 | 0.74 (1) | |
| NGC 1433 | 9.85 | P | SBb | B | -19.2 | 0.90 0.13 † | 0.06 0.002 | 3.8 0.2 | … | |
| NGC 1512 | 9.85 | P | SBb | B | -18.8 | 1.56 0.14 | 0.20 0.002 | 4.0 0.2 | … | |
| NGC 1672 | 12.3 | P | Sb | O | -20.1 | 1.24 0.11 † | 1.39 0.019 | 7.2 0.3 | … | |
| NGC 3351 | M 95 | 7.06 | P | SBb | B | -18.7 | 1.51 0.39 | 0.19 0.001 | 4.3 0.6 | 0.40 (1) |
| NGC 3521 | 7.2 | P | Sbc | U | -19.4 | 3.20 0.46 | 0.53 0.039 | 11.8 1.4 | 0.52 (1) | |
| NGC 3593 | 9 | P | Sa | U | -17.9 | 1.80 0.37 | 0.21 0.001 | 4.4 0.7 | … | |
| NGC 3627 | M 66 | 6.83 | P | Sb | B | -19.4 | 2.90 0.42 | 0.32 0.015 | 7.2 0.8 | 1.93 (1) |
| NGC 3675 | 10.12 | P | Sb | U | -19.1 | 3.16 0.29 † | 0.18 0.026 | 8.5 0.8 | 0.31 (2) | |
| NGC 3726 | 13.24 | P | Sbc | B | -19.9 | 1.94 0.33 † | 0.21 0.010 | 3.0 0.5 | 0.73 (2) | |
| NGC 4245 | 13 | P | SBa | B | -18.2 | 1.90 0.34 | 0.02 0.001 | 3.6 0.3 | … | |
| NGC 4314 | 14 | P | SBa | B | -19.3 | 2.37 0.39 | 0.12 0.010 | 6.4 0.9 | … | |
| NGC 4380 | 13 | P | Sab | U | -17.9 | 1.41 0.20 | 0.03 0.008 | 2.8 0.5 | … | |
| NGC 4394 | 14.28 | P | SBb | B | -19.2 | 1.65 0.25 | 0.05 0.004 | 4.3 0.4 | 0.22 (2) | |
| NGC 4448 | 10 | P | Sa | B | -18.0 | 1.68 0.34 | 0.04 0.001 | 3.3 0.3 | … | |
| NGC 4457 | 10.22 | P | RSb | O | -18.3 | 1.66 0.50 † | 0.06 0.003 | 3.8 0.2 | … | |
| NGC 4569 | M 90 | 14.28 | P | Sab | B | -20.7 | 1.90 0.28 | 0.53 0.029 | 14.9 1.6 | 0.69 (1) |
| NGC 4639 | 14.28 | P | SBb | B | -18.6 | 1.64 0.45 | 0.03 0.004 | 2.3 0.2 | 0.11 (2) | |
| NGC 4736 | M 94 | 4 | P | RSab | O | -19.3 | 1.62 0.26 | 0.31 0.015 | 5.8 0.2 | 0.47 (1) |
| NGC 4826 | M 64 | 7.48 | P | Sab | U | -20.1 | 3.94 0.34 | 0.27 0.006 | 16.2 1.0 | 0.08 (1) |
| NGC 5055 | M 63 | 7.27 | P | Sbc | U | -20.0 | 1.84 0.24 | 0.62 0.067 | 12.8 0.8 | 0.56 (1) |
| NGC 5194 | M 51 | 6.52 | P | Sbc | U | -20.3 | 0.55 0.07 | 1.46 0.188 | 9.3 0.7 | 1.70 (1) |
| NGC 5248 | 16.75 | P | Sbc | O | -20.2 | 1.62 0.27 | 0.92 0.011 | 13.2 0.8 | 1.13 (1) | |
| NGC 5879 | 13.45 | P | Sb | U | -18.5 | 1.65 0.19 | 0.09 0.004 | 2.1 0.1 | … | |
| IC 342 | 2.58 | P(L) | Scd | U | -17.4 | 1.88 0.41 † | 0.31 0.019 | 3.1 0.3 | 0.76 (2) | |
| NGC 0628 | M 74 | 9.05 | P(L) | Sc | U | -20.1 | 1.45 0.10 | 0.54 0.043 | 4.9 0.7 | 0.56 (1) |
| NGC 0925 | 9.08 | P(L) | SBc | B | -19.2 | 1.18 0.21 † | 0.45 0.024 | 1.4 0.4 | 1.39 (1) | |
| NGC 2403 | 3.35 | P(L) | Sc | U | -18.8 | 1.50 0.62 † | 0.30 0.118 | 1.3 0.2 | 0.08 (2) | |
| NGC 2903 | 8.16 | P(L) | Sc | U | -20.0 | 0.42 0.07 | 0.76 0.018 | 7.1 0.6 | 0.51 (1) | |
| NGC 3184 | 9.11 | P(L) | Sc | U | -19.4 | 1.78 0.48 † | 0.07 0.003 | 3.3 0.2 | 0.64 (1) | |
| NGC 3198 | 9.11 | P(L) | Sc | U | -18.9 | 1.69 0.63 † | 0.39 0.009 | 1.7 0.1 | … | |
| NGC 3769 | 14.04 | P(L) | SBc | B | -18.2 | 0.54 0.09 † | 0.14 0.010 | 1.3 0.8 | … | |
| NGC 3938 | 14.04 | P(L) | Sc | B | -19.8 | 1.68 0.34 † | 0.30 0.044 | 4.6 2.6 | 1.16 (1) | |
| NGC 4136 | 12.48 | P(L) | Sc | B | -18.4 | 0.58 0.65 † | 0.10 0.025 | 0.9 0.6 | … | |
| NGC 4303 | M 61 | 19.77 | P(L) | Sc | B | -21.3 | 0.96 0.14 † | 1.99 0.092 | 26.2 2.9 | … |
| NGC 4321 | M 100 | 14.28 | P(L) | Sc | B | -20.8 | 0.50 0.06 † | 1.20 0.024 | 16.4 6.2 | … |
| NGC 4414 | 12.48 | P(L) | Sc | U | -19.5 | 2.79 0.31 † | 0.49 0.211 | 19.7 3.3 | 1.24 | |
| NGC 4559 | 9.87 | P(L) | Sc | U | -19.7 | 1.85 0.82 † | 0.61 0.398 | 10.0 0.1 | 0.06 (1) | |
| NGC 4580 | 14.63 | P(L) | Sc/Sa | U | -18.1 | 1.65 0.60 † | 0.05 0.001 | 2.4 1.0 | … | |
| NGC 5457 | M 101 | 5.03 | P(L) | Sc | U | -20.1 | 1.83 0.46 † | 0.44 0.073 | 4.2 0.2 | 0.57 (1) |
| NGC 6946 | 5.53 | P(L) | Sc | U | -19.0 | 1.87 0.36 | 0.58 0.042 | 5.8 1.5 | 2.11 (1) |
| Identifier | Alt. | Bulge | LXS(3.6 m) | LXS(24 m) | LXS(FUV) | ||||||
|---|---|---|---|---|---|---|---|---|---|---|---|
| Name | TypeaaWe are only interested in Sérsic index. Thus magnitudes have not been corrected for Galactic extinction. | (kpc) | (1040 erg s-1) | (1040 erg s-1) | (1040 erg s-1) | (10-3 M⊙ yr-1) | ( M⊙ yr-1 pc-2) | ( M⊙) | ( M⊙) | (M⊙ pc-2) | |
| NGC 6744 | C | 2.5 0.21 | 1.4 0.14 | 1.8 0.1 | … | 8.1 0.6 | 8.1 0.6 | 22.79 1.71 | 75.4 5.6 | 57.12 4.68 | |
| NGC 3031 | M 81 | C | 4.07 0.21 | 9.15 0.37 | 15.9 0.6 | 7.50 1.19 | 39.0 5.5 | 39.0 5.5 | 38.85 2.58 | 96.8 6.4 | 10.35 0.75 |
| NGC 4450 | C | 2.86 0.16 | 6.11 0.35 | 8.8 0.7 | 6.44 0.81 | 23.0 2.7 | 23.0 2.7 | 21.38 0.71 | 90.4 3.0 | 20.65 1.39 | |
| NGC 2775 | C | 3.46 0.22 | 4.82 0.32 | 10.2 1.3 | 17.23 1.24 | 73.3 4.1 | 73.3 4.1 | 72.93 7.28 | 118.8 11.9 | 14.01 1.45 | |
| NGC 4725 | C | 3.41 0.21 | 6.97 0.25 | 12.5 0.4 | … | 28.5 2.9 | 28.5 2.9 | 46.66 2.67 | 218.8 12.5 | 18.16 1.21 | |
| NGC 1617 | C | 1.13 0.07 | 2.68 0.12 | 2.1 0.1 | 0.10 0.02 | 5.0 0.6 | 5.0 0.6 | 16.48 0.80 | 421.4 20.5 | 20.16 1.51 | |
| NGC 2841 | C | 1.82 0.16 | 2.63 0.26 | 4 0.4 | 0.45 0.02 | 28.6 0.9 | 28.6 0.9 | 52.97 1.93 | 212.5 7.8 | 14.53 0.71 | |
| NGC 4698 | C | 1.61 0.17 | 2.06 0.17 | 2.2 0.3 | … | 7.0 0.6 | 7.0 0.6 | 9.70 0.39 | 100.9 4.1 | 4.95 0.38 | |
| NGC 3368 | M 96 | P(I) | 1.77 0.15 | 5 0.37 | 21.3 1 | 2.15 0.25 | 51.9 2.7 | 51.9 2.7 | 40.76 4.09 | 131.9 13.2 | 41.50 4.52 |
| NGC 3953 | P(I) | 1.83 0.15 | 1.82 0.2 | 4.5 0.3 | … | 15.8 1.5 | 15.8 1.5 | 12.90 1.42 | 86.0 9.5 | 12.27 1.44 | |
| NGC 4274 | P(I) | 2.43 0.05 | 4.67 0.13 | 26.1 0.3 | 2.27 0.06 | 62.8 0.8 | 62.8 0.8 | 39.95 1.09 | 69.6 1.9 | 21.58 0.63 | |
| NGC 7177 | P(I) | 1.36 0.08 | 2.83 0.11 | 11.2 0.4 | 0.93 0.13 | 26.9 1.2 | 26.9 1.2 | 22.45 1.82 | 31.2 2.5 | 38.60 3.41 | |
| NGC 7217 | P(I) | 4.43 0.28 | 8.81 0.44 | 53.6 2.6 | 3.32 0.22 | 125.9 6.2 | 125.9 6.2 | 68.36 3.76 | 130.7 7.2 | 11.08 0.70 | |
| NGC 7331 | P(I) | 1.5 0.1 | 6.96 0.48 | 31.8 5.9 | 12.86 1.00 | 98.8 15.2 | 98.8 15.2 | 49.11 5.17 | 229.0 24.1 | 69.35 7.59 | |
| NGC 1433 | P | 0.59 0.13 | 1.28 0.08 | 6.1 0.2 | … | 25.2 0.9 | 25.2 0.9 | 9.22 0.54 | 24.6 1.5 | 83.44 8.17 | |
| NGC 1512 | P | 1.42 0.07 | 1.18 0.04 | 9.8 0.1 | 71.88 0.76 | 180.4 2.0 | 180.4 2.0 | 8.55 0.43 | 26.4 1.3 | 13.51 0.79 | |
| NGC 1672 | P | 1.18 0.11 | 3.6 0.12 | 244.9 2.4 | 39.90 1.36 | 629.4 8.4 | 629.4 8.4 | 19.35 0.78 | 60.2 2.4 | 44.18 2.90 | |
| NGC 3351 | M 95 | P | 0.97 0.05 | 1.26 0.04 | 51.2 0.2 | 6.31 0.06 | 127.0 0.6 | 127.0 0.6 | 8.78 1.31 | 30.4 4.6 | 30.01 4.68 |
| NGC 3521 | P | 1.07 0.06 | 2.16 0.25 | 21.1 1.5 | 2.86 0.24 | 52.9 3.9 | 52.9 3.9 | 15.78 1.83 | 86.7 10.1 | 43.98 5.27 | |
| NGC 3593 | P | 2.3 0.13 | 2.26 0.08 | 82.6 0.3 | … | 206.2 1.2 | 206.2 1.2 | 19.15 3.03 | 17.7 2.8 | 11.57 1.88 | |
| NGC 3627 | M 66 | P | 0.8 0.1 | 1.48 0.1 | 17.1 0.8 | 0.18 0.03 | 38.2 1.8 | 38.2 1.8 | 9.66 1.03 | 58.9 6.3 | 48.26 6.30 |
| NGC 3675 | P | 1.03 0.12 | 1.38 0.14 | 18.5 2.1 | … | 54.9 7.9 | 54.9 7.9 | 11.17 1.09 | 56.3 5.5 | 33.21 3.76 | |
| NGC 3726 | P | 0.81 0.06 | 0.22 0.01 | 7.4 0.3 | … | 29.7 1.4 | 29.7 1.4 | 0.90 0.16 | 42.7 7.6 | 4.36 0.78 | |
| NGC 4245 | P | 1.25 0.09 | 0.76 0.06 | 4.5 0.1 | … | 15.7 0.3 | 15.7 0.3 | 5.99 0.46 | 23.9 1.9 | 12.17 1.13 | |
| NGC 4314 | P | 1.31 0.18 | 2.71 0.28 | 29.8 1.3 | 18.97 2.74 | 107.7 9.0 | 107.7 9.0 | 19.58 2.69 | 37.7 5.2 | 36.24 5.67 | |
| NGC 4380 | P | 1.36 0.15 | 0.33 0.03 | 2.9 0.6 | 1.09 0.32 | 8.8 2.0 | 8.8 2.0 | 2.46 0.41 | 20.8 3.5 | 4.21 0.81 | |
| NGC 4394 | P | 1.05 0.26 | 0.81 0.07 | 2.5 0.2 | … | 11.6 1.0 | 11.6 1.0 | 6.05 0.54 | 30.6 2.7 | 17.41 1.85 | |
| NGC 4448 | P | 0.61 0.07 | 0.83 0.07 | 3.6 0.1 | … | 15.7 0.5 | 15.7 0.5 | 6.12 0.49 | 22.8 1.8 | 52.05 4.73 | |
| NGC 4457 | P | 0.62 0.1 | 1.6 0.08 | 14.4 0.5 | … | 43.9 2.2 | 43.9 2.2 | 11.79 0.61 | 22.2 1.1 | 97.81 7.56 | |
| NGC 4569 | M 90 | P | 1.37 0.25 | 3.68 0.35 | 85.4 4.3 | 11.66 0.89 | 214.6 11.5 | 214.6 11.5 | 22.87 2.54 | 125.0 13.9 | 38.86 5.17 |
| NGC 4639 | P | 0.66 0.08 | 0.44 0.04 | 1.9 0.2 | 0.07 0.01 | 4.3 0.5 | 4.3 0.5 | 2.80 0.26 | 19.7 1.8 | 20.61 2.34 | |
| NGC 4736 | M 94 | P | 0.48 0.02 | 2.05 0.08 | 12.8 0.4 | 7.47 0.54 | 44.9 2.2 | 44.9 2.2 | 13.09 0.49 | 43.7 1.6 | 177.26 8.09 |
| NGC 4826 | M 64 | P | 1 0.09 | 4.09 0.15 | 54.2 0.9 | 3.49 0.38 | 127.5 2.8 | 127.5 2.8 | 28.85 1.72 | 116.7 7.0 | 91.20 6.84 |
| NGC 5055 | M 63 | P | 2.5 0.18 | 3.4 0.18 | 58.2 5.5 | 13.22 2.24 | 157.9 17.1 | 157.9 17.1 | 22.38 1.38 | 99.0 6.1 | 11.40 0.82 |
| NGC 5194 | M 51 | P | 1.19 0.06 | 1.65 0.12 | 55.1 7 | 20.22 2.70 | 166.4 21.5 | 166.4 21.5 | 8.85 0.69 | 96.5 7.5 | 19.85 1.59 |
| NGC 5248 | P | 1.79 0.11 | 4.49 0.16 | 131.2 1.5 | 0.99 0.04 | 292.2 3.4 | 292.2 3.4 | 27.17 1.75 | 106.9 6.9 | 27.03 1.94 | |
| NGC 5879 | P | 2.6 0.19 | 1.76 0.04 | 28.9 1.4 | 0.95 0.06 | 65.9 3.1 | 65.9 3.1 | 10.38 0.33 | 11.5 0.4 | 4.88 0.23 | |
| IC 342 | P(L) | 1.13 0.29 | 0.18 0.02 | 60.4 3.2 | … | 191.3 11.7 | 191.3 11.7 | 0.83 0.07 | 40.2 3.4 | 2.07 0.40 | |
| NGC 0628 | M 74 | P(L) | 1.27 0.06 | 0.56 0.03 | 5.8 0.4 | 5.51 0.50 | 25.1 2.0 | 25.1 2.0 | 2.70 0.41 | 59.7 9.0 | 5.34 0.83 |
| NGC 0925 | P(L) | 2.18 0.1 | 0.13 0.01 | 6.7 0.5 | 31.76 1.60 | 85.1 4.6 | 85.1 4.6 | 0.54 0.15 | 19.2 5.4 | 0.36 0.10 | |
| NGC 2403 | P(L) | 1.51 0.33 | 0.37 0.1 | 6.1 2.5 | 6.20 2.38 | 27.2 10.9 | 27.2 10.9 | 1.60 0.22 | 15.5 2.2 | 2.23 0.38 | |
| NGC 2903 | P(L) | 0.68 0.02 | 1.36 0.01 | 99.4 2.2 | 10.44 0.40 | 242.7 5.7 | 242.7 5.7 | 7.68 0.66 | 68.9 6.0 | 53.45 6.63 | |
| NGC 3184 | P(L) | 0.62 0.08 | 0.14 0.02 | 4.7 0.2 | … | 20.1 0.8 | 20.1 0.8 | 0.72 0.04 | 37.0 1.9 | 5.94 0.66 | |
| NGC 3198 | P(L) | 0.95 0.05 | 0.36 0.02 | 16.5 0.3 | 1.15 0.08 | 39.0 0.9 | 39.0 0.9 | 1.84 0.14 | 18.0 1.4 | 6.55 0.56 | |
| NGC 3769 | P(L) | 1.28 0.07 | 0.32 0.02 | 11.7 1 | 8.38 0.47 | 44.5 3.2 | 44.5 3.2 | 1.65 0.94 | 13.8 7.9 | 3.19 1.82 | |
| NGC 3938 | P(L) | 0.91 0.05 | 0.28 0.02 | 5 0.8 | 0.19 0.03 | 11.6 1.7 | 11.6 1.7 | 1.40 0.78 | 55.3 30.7 | 5.35 3.02 | |
| NGC 4136 | P(L) | 0.61 0.21 | 0.02 0 | 0.6 0.2 | 1.02 0.21 | 3.7 0.9 | 3.7 0.9 | 0.08 0.05 | 10.2 6.5 | 0.69 0.44 | |
| NGC 4303 | M 61 | P(L) | 1.68 0.32 | 2.19 0.19 | 101.5 4.2 | 17.19 1.30 | 262.3 12.2 | 262.3 12.2 | 22.60 2.49 | 291.5 32.1 | 25.45 2.84 |
| NGC 4321 | M 100 | P(L) | 1.63 0.12 | 2.52 0.11 | 101.5 2.2 | 38.98 0.63 | 310.4 6.3 | 310.4 6.3 | 14.29 5.41 | 162.1 61.4 | 17.05 6.83 |
| NGC 4414 | P(L) | 0.36 0.02 | 0.95 0.04 | 4.2 1.8 | 0.02 0.01 | 9.4 4.1 | 9.4 4.1 | 6.90 1.17 | 160.5 27.2 | 171.70 32.80 | |
| NGC 4559 | P(L) | 2.08 0.79 | 1.84 0.73 | 12.8 7.4 | 13.86 10.10 | 58.9 38.8 | 58.9 38.8 | 7.48 0.03 | 140.2 0.6 | 5.49 0.04 | |
| NGC 4580 | P(L) | 2.17 0.05 | 0.03 0 | 11.2 0.3 | … | 43.0 0.6 | 43.0 0.6 | 0.22 0.09 | 21.9 8.7 | 0.15 0.07 | |
| NGC 5457 | M 101 | P(L) | 1.4 0.3 | 0.06 0.02 | 5.4 0.8 | 2.30 0.49 | 17.1 2.9 | 17.1 2.9 | 0.30 0.01 | 56.0 2.0 | 0.48 0.02 |
| NGC 6946 | P(L) | 0.98 0.08 | 0.97 0.08 | 94.7 4.9 | … | 232.6 16.9 | 232.6 16.9 | 4.27 1.07 | 75.5 19.0 | 14.22 3.58 |
Appendix A New V-band Photometry and Sérsic Fits

The method we use to calculate surface brightness profiles and Sérsic fits to thos profiles is the same procedure as used in Fisher & Drory (2008b). This same procedure is also employed in Kormendy et al. (2008) on elliptical galaxies. Our reduction software and procedures are discussed in great detail in these two papers. We refer interested readers to these two papers.
We calculate Johnson -band magnitude zero points using the transformations in Holtzman et al. (1995) for the WFPC2 images and Sirianni et al. (2005) for the ACS images. SDSS g and r profiles are converted to a single V-band profile for each galaxy using the transformations in Smith et al. (2002). We use colors from Hyper-LEDA, which refer to colors of the entire galaxies, and the galaxies in our sample most certainly have non-zero color gradients. Therefore the absolute values of surface brightness in this paper are not expected to be consistent to more than 0.3 mag. However, this does not affect our conclusions which are based the structure in the profiles and not on absolute magnitude. We check that our magnitudes are consistent with appature photometry published in the RC3 and Hyper-LEDA.

In two galaxies (M 101 and IC 342) there was not sufficient coverage in the optical two constrain a bulge-disk decomposition. We therefore adduce 2MASS -band data to extend the dynamic fitting range. We stress that we only use the fits in this paper for bulge Sérsic index, and furthermore this Sérsic index is only used two help pseudobulge classification. In both of these galaxies the nuclear morhology and IR activity strongly indicate that the bulge is a pseudobulge, and the fitted Sérsic index does not conflict with this result.
We carry out a bulge-disk decomposition on each galaxy in our sample by fitting the following equation (Eq. A1) to the major axis surface brightness profiles by method of least-squares,
| (A1) |
where is a constant function of given in many publications (e.g. Ciotti & Bertin, 1999),
| (A2) |
and the surface brightness of the bulge and disk are converted to magnitudes respectively as follows and .
The decomposition is carried out on a major axis profile using the mean isophote brightness. It does not take ellipticity into account during the fitting. Thus, we take the mean ellipticity for each component and adjust the luminosity accordingly: . The radius of the component is defined as the radius range within which that component dominates the light of the profile.
Bars, rings, lenses, and similar features do not conform to the smooth nature of Eq. 1, hence we carefully exclude regions of the profile perturbed by such structures from the fit. This is a risky procedure, as it requires selectively removing data from a galaxy’s profile, and undoubtedly has an effect on the resulting parameters. For those galaxies in which a bar is present, it is our assumption that removing the bar from the fit provides the best estimation of the properties of the underlying bulge and disk. If a region is not included in a fit we show that in the figure by using open symbols. This procedure is described extensively in Fisher & Drory (2008b).

| Identifier | aaWe are only interested in Sérsic index. Thus magnitudes have not been corrected for Galactic extinction. | aaWe are only interested in Sérsic index. Thus magnitudes have not been corrected for Galactic extinction. | h | Data SourceaaWe are only interested in Sérsic index. Thus magnitudes have not been corrected for Galactic extinction. | ||
|---|---|---|---|---|---|---|
| (V-mag arcsec-2) | arcsec | (V-mag arcsec-2) | (arcsec) | |||
| NGC0925 | 1.2 0.2 | 24.3 0.3 | 23.8 3.5 | 23.6 0.3 | 101.9 9.5 | 1,2 |
| NGC1433 | 0.9 0.1 | 17.8 0.4 | 5.1 1.0 | 19.8 0.2 | 48.2 1.8 | 1,4 |
| NGC1617 | 2.0 0.2 | 18.8 0.6 | 5.3 3.2 | 19.4 0.1 | 33.0 0.6 | 1,4 |
| NGC1672 | 1.2 0.1 | 17.7 0.3 | 4.9 0.8 | 19.5 0.2 | 36.4 0.8 | 1,5 |
| NGC2403 | 1.5 0.6 | 22.6 1.0 | 48.3 34.9 | 20.2 0.6 | 127.7 14.0 | 1,6 |
| NGC3184 | 1.8 0.5 | 20.1 1.1 | 4.3 1.2 | 20.5 0.3 | 71.2 6.1 | 1,2,3,7 |
| NGC3675 | 3.2 0.6 | 21.1 0.7 | 30.9 21.1 | 19.7 0.4 | 43.4 4.0 | 1,3 |
| NGC3726 | 1.9 0.3 | 20.8 0.8 | 7.4 5.6 | 20.4 0.2 | 46.2 1.0 | 3, 8, 13 |
| NGC3769 | 0.5 0.1 | 19.8 0.2 | 2.6 0.2 | 19.4 0.1 | 20.9 0.2 | 1, 3 |
| NGC3938 | 1.7 0.3 | 20.8 0.7 | 8.0 2.7 | 20.4 0.2 | 44.7 1.3 | 1,2,3 |
| NGC3953 | 2.7 0.4 | 20.7 1.1 | 13.0 10.4 | 20.1 0.2 | 46.3 0.9 | 3,8 |
| NGC4136 | 0.6 0.6 | 20.3 1.7 | 2.0 0.6 | 20.5 0.2 | 27.6 0.7 | 1,3,8 |
| NGC4303 | 1.0 0.1 | 17.8 0.5 | 2.8 0.7 | 19.8 0.1 | 40.7 0.7 | 1,3,8 |
| NGC4321 | 0.5 0.1 | 18.7 0.2 | 7.7 0.5 | 20.2 0.1 | 62.7 1.3 | 1,3 |
| NGC4414 | 2.7 0.4 | 17.8 0.9 | 3.9 1.4 | 18.4 0.2 | 26.4 0.8 | 1,2,3 |
| NGC4450 | 3.7 0.3 | 20.8 0.8 | 18.1 9.2 | 20.2 0.3 | 50.4 1.9 | 1,2,3 |
| NGC4457 | 1.7 0.5 | 17.9 1.7 | 4.5 2.1 | 19.9 0.8 | 26.7 3.6 | 1,3,10,11 |
| NGC4559 | 1.9 0.8 | 22.6 1.4 | 33.8 28.8 | 19.9 0.3 | 69.4 3.4 | 1,3 |
| NGC4580 | 1.6 0.6 | 21.4 2.3 | 3.3 6.0 | 19.9 0.2 | 18.5 0.4 | 3 |
| NGC5457 | 1.8 0.5 | 20.7 1.2 | 11.9 5.5 | 20.3 0.2 | 102.5 2.6 | 1,3,7,12 |
| NGC7331 | 4.5 0.5 | 20.7 0.9 | 24.4 9.5 | 20.0 0.5 | 66.3 4.8 | 1,3 |
| IC0342 | 1.9 0.4 | 21.6 1.3 | 21.1 22.0 | 21.9 0.2 | 189.7 9.3 | 1,12 |