Two distant brown dwarfs in the UKIRT Infrared Deep Sky Survey Deep Extragalactic Survey Data Release 2 ††thanks: Based on observations made with the United Kingdom Infrared Telescope, the Canada-France-Hawaii Telescope Legacy Survey, and the Gemini Observatory
Abstract
We present the discovery of two brown dwarfs in the UKIRT Infrared Deep Sky Survey (UKIDSS) Deep Extragalactic Survey (DXS) Data Release 2. Both objects were selected photometrically from six square degrees in DXS for their blue colour and the lack of optical counterparts in the Sloan Digital Sky Survey (SDSS) Stripe 82. Additional optical photometry provided by the Canada-France-Hawaii Telescope Legacy Survey (CFHT-LS) corroborated the possible substellarity of these candidates. Subsequent methane imaging of UDXS J221611.51003308.1 and UDXS J221903.10002418.2, has confirmed them as T71 and T61 dwarfs at photometric distances of 81 (52–118 pc) and 60 (44–87 pc; 2 confidence level). A similar search in the second data release of the Ultra Deep Survey over a smaller area (0.77 deg2) and shallower depth didn’t return any late-T dwarf candidate. The numbers of late-T dwarfs in our study are broadly in line with a declining mass function when considering the current area and depth of the DXS and UDS. These brown dwarfs are the first discovered in the VIMOS 4 field and among the few T dwarfs found in pencil-beam surveys. They are valuable to investigate the scale height of T dwarfs.
keywords:
Stars: brown dwarfs — techniques: photometric — Infrared: Stars — surveys1 Introduction
T dwarfs are brown dwarfs whose spectral energy distribution is mainly shaped by methane and water at near-infrared wavelengths (Burgasser et al., 2006). Their effective temperatures (Teff) are below 1400 K (Golimowski et al., 2004; Vrba et al., 2004) and the coolest known to date, ULAS J133553.45+113005.2 has an estimated Teff of below 600 K (Burningham et al., 2008). The first T dwarf in the field was discovered orbiting an M star, Gl229A (Nakajima et al., 1995; Oppenheimer et al., 1995) and the same year Rebolo et al. (1995) discovered the first brown dwarf in the Pleiades. Thirteen years later, over 140 T dwarfs are known, the full list is available in an archive dedicated to low-mass stars and brown dwarfs111http://dwarfarchives.org, a compendium of M, L and T dwarfs maintained by C. Gelino, D. Kirkpatrick, and A. Burgasser., including 8 T7, 7 T7.5, and 3 T8, and 3 T8.5–T9, following the classification at infrared wavelengths (Burgasser et al., 2006, see the archive for the full list of objects and references). However, most of these T dwarfs are nearby and only two field T dwarfs have been announced in deep pencil-beam surveys: a T7 in the NTT Deep Survey by Cuby et al. (1999) and T3–T4 dwarf in the IfA Deep Survey (Liu et al., 2002) along with a young T dwarf in the Ori cluster (Zapatero Osorio et al., 2008). Those deep surveys provide deep imaging over a limited area but represent ideal grounds to uncover various (and possibly new) types of objects (including brown dwarfs) at large distances and perform science impossible with shallower surveys. This work aims at finding distant and cool brown dwarfs with Teff below 1000 K and initiating a study of their Galactic distribution and scale height to improve the mass function.
The UKIRT Infrared Deep Sky Survey (UKIDSS; Lawrence et al., 2007)222www.ukidss.org is a new near-infrared survey conducted with the wide-field camera (WFCAM; Casali et al., 2007) on the 4-m UK InfraRed Telescope (UKIRT). The UKIDSS photometric system, described in Hewett et al. (2006), is based on the Mauna Kea Observatory system (Tokunaga et al., 2002). The data are pipelined-processed in the Cambridge Astronomical Survey Unit (CASU; Irwin et al., in prep) and archived in the WFCAM Science Archive (WSA; Hambly et al., 2008). The project consists of three shallow surveys (Large Area Survey; LAS), Galactic Clusters Survey, and the Galactic Plane Survey) and two extragalactic components: the Deep Extragalactic Survey (DXS) and the Ultra-Deep Survey (UDS). One of the main scientific goals of UKIDSS, and the LAS component in particular, is to find the coolest and nearest brown dwarfs, in particular those bridging the gap between the coolest T dwarfs and planets (so-called Y dwarfs; Kirkpatrick et al., 1999). A dozen new T dwarfs have already been reported from a search in the 190 square degrees released in the LAS Data Release 1 (Kendall et al., 2007; Lodieu et al., 2007; Chiu et al., 2008), including one T7 and two T7.5 dwarfs, as well as one of the coolest T dwarfs ever found (ULAS00340052 classified as T8.5; Warren et al., 2007). New discoveries are reported in Pinfield et al. (2008) and Burningham et al. (2008). Although dedicated mainly to the understanding a galaxy formation at high-redshift and other extragalactic projects, the DXS and UDS represent valuable hunting grounds to look for objects with unique infrared colours like late-T dwarfs.
In this paper we present the discovery of two faint and distant T dwarfs from a simple photometric selection in the UKIDSS DXS (Sect. 2). Additional optical photometry was obtained from the Canada-France-Hawaii Telescope (CFHT) Legacy Survey and the Sloan Digital Sky Survey (SDSS) deep stacks (known as Stripe 82) to remove contaminants over a significant area surveyed by the DXS Second Data Release (DR2). The photometric follow-up carried out in the methane ON (CH4l) and OFF (CH4s) narrow-band filters for both candidates confirmed them as a cool brown dwarfs (Sect. 3). The spectral classification of these new brown dwarfs based on near-infrared photometry is examined in Sect. 4. Finally, we discuss the implications of our discovery with respect to the expected number of T dwarfs in the DXS (Sect. 5.2) and report on a similar search in the UDS (Sect. 5.3).

2 Sample selection
2.1 Selection in UKIDSS DXS DR2
The DXS goal is to cover 35 square degrees in four distinct fields (Lockman Hole, XMM-LSS, VIMOS 4, and ELAIS N1) down to 5 depths of = 22.3 mag and = 20.8 mag for a point source (Lawrence et al., 2007). In DR2, the approximate overlapping coverage is six square degrees and the achieved completeness limit is = 19.2-21.1 mag because the survey is still on-going. Observing conditions should meet the following criteria: seeing better than 1.1 arcsec with thin cirrus or better (Dye et al., 2006). The DXS fields have 10 second on-source integration times repeated several times to obtain intermediate stacks with a total exposure time of 640 seconds. These intermediate stacks are then repeated to achieve a final depth of = 22.3 mag and = 20.8 mag before moving to the next tile. The observed dispersion on the coordinates from the multiple epochs can be used to estimate a proper motion. For both objects discussed in this paper, the time baseline span 6 months between June and December 2005. The pipeline processing is identical to the WFCAM standard reduction described in Irwin et al. (in prep). No special treatment is applied to high proper motion sources but a proper motion model should be implemented in UKIDSS DR5 to look for moving sources (Nicholas Cross, personal communication).
We have input a simple Structure Query Language (SQL) query in WSA to look for late-T dwarfs from the UKIDSS DXS Second Data Release (DR2; Warren et al., 2007). We have imposed the following constraints: point sources (ellipticity less than 0.333), stellar (i.e. the mergedClass parameter between 2 and 1), upper limit of 0.5 arcsec on the separation/distance between the two detections (parameters jXi,kXi and jEta,kEta), and good quality (ppErrBits parameter less than 256)333see the WSA webpage at http://wsa.surveys.roe.uk for a detailed description of the parameters. Note that the typical dispersion of the jXikXi and jEtakEta parameters is low (because small offsets in the centroid between different bands are foreseen for the majority of sources), corresponding to a 4–5 sigma clipping at the survey completeness limit. In addition, we have limited our search to fainter than 13 mag (to avoid saturated sources) and brighter than = 21.1 mag (5 limit of the DXS DR2). Finally, we have imposed a constraint on the infrared colour, namely 0.1 mag to select the bluest and therefore the coolest T dwarfs. The query returned 54 sources. Nevertheless, additional optical photometry is required to clean the sample of spurious candidates with neutral infrared colours.
| UDXS J… | RA | dec | Epoch | |||||
|---|---|---|---|---|---|---|---|---|
| 221611.51003308.1 | 22 16 11.51 | 00 33 08.1 | 2005-09-11 | 20.1930.040 | 20.9080.197 | 0.715 | 24.0 | 23.00.6a |
| 22 16 11.52 | 00 33 08.2 | 2006-09-17 | 26.1 | 24.420.29b | ||||
| 221903.10002418.2 | 22 19 03.10 | 00 24 18.2 | 2005-06-20 | 19.0000.017 | 19.1830.040 | 0.182 | 24.2 | 22.5a |
| 22 19 03.09 | 00 24 17.8 | 2006-08-11 | 26.430.61 | 23.420.10b |
2.2 Optical photometry from public databases
First of all, we have input all 54 candidates from DXS DR2 into the SDSS DR6 database (Adelman-McCarthy et al., 2008)444http://cas.sdss.org/dr6/en/tools/crossid/upload.asp and requested the nearest SDSS sources within 3 arcsec of the DXS detection. A total of 36 sources were returned and none of them had and colour typical of T dwarfs (Knapp et al., 2004). Thus, we have rejected those sources and are left with 5436 = 18 candidates. Fig. 1 shows the location of these contaminants in a (,) two-colour diagram, suggesting that they are likely early-type stars according to the synthetic colours compiled by Hewett et al. (2006).
Second, we have looked into public databases with common coverage to the DXS to remove potential outliers, including the CFHT Legacy Survey (CFHTLS; see Sect. 2.3)555http://www.cfht.hawaii.edu/Science/CFHTLS/, the Subaru Deep Survey666http://www.naoj.org/Science/SubaruProject/SDS/, and the SDSS Stripe 82 (Frieman et al., 2008; Adelman-McCarthy et al., 2008). The SDSS stacks centered on the location of the UKIDSS objects were created by combining (on average) 23 single-epoch SDSS images. The single-epoch SDSS images have been released as DRSN1 (Sako et al., 2005) and DRsup (Adelman-McCarthy et al., 2007). The SDSS image were scaled to a common zero-point using the SDSS DR6 catalogue and combined using standard routines in IRAF.
Details of the location of the candidates and their photometry are as follows:
-
•
For the three candidates located in XMM-LSS field centered at (RA,dec)=(02h25,04∘30), we have extracted optical () photometry from the CFHTLS Wide 1. All of them were clearly detected and exhibit optical-to-infrared colours inconsistent with T dwarfs (Knapp et al., 2004).
-
•
In the Lockman Hole pointing (10h57,57∘40), we have three candidates: one has an optical counterpart and no object was visible on the and images of the other two candidates so we discarded them all.
-
•
In ELAIS N1 centered at (16h10,54∘00), we have two candidates but both of them were artefacts beside a bright star (known as cross-talks) and thus rejected.
-
•
Finally, the largest number of candidates (10 in total) is found in the VIMOS 4 pointings (22h17,00∘20). Part of that DXS VIMOS 4 field overlaps with the SDSS Stripe 82 in the 1.266∘ to 1.266∘ declination range. However the northern part of VIMOS 4 has currently no optical photometric catalogue linked to it (from dec=1.266∘ to 1.8∘). Four candidates lie in this area and three of them are detected in USNO (Monet et al., 2003) confirmed as contaminants by the CFHT photometry (Sect. 2.3). The one without photometry, UDXS J222203.56013330.2 (UDXS2222), is not included in Table LABEL:tab_dT:list_cand because discarded after inspection of the CFHT photometry (Sect. 2.3). Three of the remaining six candidates are cross-talks and another one is clearly visible on the images of the SDSS Stripe 82 (thus discarded). The remaining two were kept as potential T dwarfs, UDXS J221611.51003308.1 (hereafter UDXS2216) and UDXS221903.10002418.2 (UDXS2219), because of their lower limits in and from the stacked images of the SDSS Stripe 82 (Table LABEL:tab_dT:list_cand).
2.3 Optical photometry from CFHT
Photometrically calibrated stacks of CFHT/MegaCam images of the candidates were downloaded from the Canadian Astronomy Data Centre777http://www1.cadc-ccda.hia-iha.nrc-cnrc.gc.ca/cadc/. Objects in a 66 arcmin2 box surrounding the object were matched with the UKIDSS catalogue using a search radius of 2 arcsec. Using the UKIDSS positions of the matched objects, the astrometry of those CFHT images was updated. The resulting uncertainty between the positions of objects on the CFHT images and the UKIDSS catalogue is less than 0.1 arcsec.
Magnitudes were measured in apertures with a diameter 1.5 times the seeing FWHM. Nearby bright stars were used to measure the aperture corrections. Magnitude uncertainties were computed by randomly placing apertures on the image and determining the dispersion of the flux distribution. UDXS2216 was imaged for 8610 sec in with a mean seeing of 0.67 and for 3600 sec in with an average seeing of 0.71. UDXS2219 was imaged for 4305 sec in and 10260 sec in with an image quality of 0.73 and 0.80, respectively. Finally UDXS2222 was only imaged in for 3600 sec with a mean seeing of 0.86.
The transmission curves of the MegaCam and filters differ from the SDSS filter curves: the MegaCam is redder than SDSS and the MegaCam is bluer than the SDSS , yielding colours with less contrast. This comparison is detailed in Delorme et al. (2008b). Their Figures 3 and 7 show the colours as a function of spectral type and , respectively. Note that the colour is in AB magnitudes (usually is in AB system and in the Vega system). We will use this definition only for the three objects with CFHT photometry to assign tentative spectral types.
Firstly, UDXS2222 was clearly detected on the CFHT images and we measured = 21.640.03 mag, implying of about 0.75, inconsistent with T dwarfs (Delorme et al., 2008b). Therefore, we rejected this object as a potential T dwarf. Secondly, we looked into the and magnitudes for the remaining two T dwarf candidates with lower limits from the SDSS Stripe 82. For UDXS2216, we measured a lower limit of 26.1 and = 24.420.29 (Table LABEL:tab_dT:list_cand), implying 1.6 and = 3.29 mag. Those values suggest a possible late-T dwarf according to Fig. 7 in Delorme et al. (2008b) and methane imaging presented in Sect. 3 confirms this hypothesis. For UDXS2219, we measured = 26.40.6 and = 23.420.10 (Table LABEL:tab_dT:list_cand), yielding = 3.48 and 3 mag placing that object in the region of late-T dwarfs in Fig. 7 of Delorme et al. (2008b). Therefore, we consider both objects as late-T dwarf candidates. We note that UDXS2219 is redder than any of the new T dwarf candidates presented in Delorme et al. (2008b).
From the time difference of 1 year between the DXS and CFHT observations, we have attempted to compute the proper motion for both candidates. For UDXS2216 the motion is within the error bars of the astrometry. The methane observations described in Sect. 3 and taken two years after the DXS images support a negligible proper motion since the measurements are within the error bars. Repeating the same procedure for UDXS2219 suggests a proper motion 2.5 above the astrometric errors (0.350.15 arcsec/yr).
| Name | RA | dec | CH4s | CH4l | CH4sCH4l | ||
|---|---|---|---|---|---|---|---|
| UDXS J… | J2000 | DXS photometry | aperture photometry | methane colour | |||
| 221611.49003307.8 | 22 16 11.49 | 00 33 07.8 | 20.1930.040 | 20.9080.197 | 17.0080.053 | 18.4720.142 | 1.4640.152 |
| 221612.23003258.8 | 22 16 12.23 | 00 32 58.8 | 17.9680.010 | 17.1420.010 | 14.3310.005 | 14.5730.005 | 0.2420.005 |
| 221611.37003317.8 | 22 16 11.37 | 00 33 17.8 | 18.3890.012 | 17.5070.012 | 14.7410.007 | 14.9630.006 | 0.2220.007 |
| 221609.59003322.5 | 22 16 09.59 | 00 33 22.5 | 18.2060.011 | 17.4100.014 | 14.5570.006 | 14.7810.006 | 0.2240.006 |
| 221903.10002418.2 | 22 19 03.10 | 00 24 18.2 | 19.0000.017 | 19.1830.040 | 21.2900.040 | 21.9540.044 | 0.6640.059 |
| 221900.07002423.3 | 22 19 00.07 | 00 24 23.3 | 19.4000.021 | 18.5830.025 | 21.3100.040 | 19.8740.014 | 0.2260.042 |
| 221903.57002443.7 | 22 19 03.57 | 00 24 43.7 | 17.9050.009 | 17.5450.012 | 19.9580.016 | 19.8740.014 | 0.0840.021 |
| 221901.19002416.8 | 22 19 01.19 | 00 24 16.8 | 18.6050.013 | 17.7240.013 | 20.5630.024 | 20.2990.017 | 0.2640.029 |
3 Methane photometric follow-up
3.1 Observations and data reduction
To confirm the substellar nature of our candidates, we have obtained images in the CH4l and CH4s filters available on the Gemini Near-Infrared Imager (NIRI; Hodapp et al., 2003). This represents a very efficient method to infer a spectral type (for T4 or later) in a reasonably short amount of telescope time and it is much faster in terms of observing time than obtaining a near-infrared spectrum for sources as faint as those extracted from the DXS.
NIRI was used in imaging mode with the f/6 camera giving a 0.117 arcsec pixel scale and a field-of-view of 120 arcsec. Observations were made on in queue mode on 2007 August 08 (program GN-2007B-Q-88) and on 2008 September 02 (program GN-2008B-Q-90) for UDXS2216 and UDXS2219, respectively. For the CH4s filter (central wavelength is 1.58 m) where the late-T dwarfs are the brightest (i.e., less affected by the methane absorption band), we have used shorter integrations than for the CH4l filter (centered at 1.69 m).
For UDXS2216, we have used on-source integrations of 140 (62) sec repeated one (three times) and 10 (20) dithers following a standard pattern, yielding total exposure times of 23 min and 62 min in the CH4s and CH4l filters, respectively. For UDXS2219, we have used on-source integrations of 55 (50) sec and 9 (54) dithers, producing total exposure times of 8.25 min and 45 min in the CH4s and CH4l filters, respectively. The observing conditions for both objects were affected with some patchy clouds and seeing measured on the average images was below 0.5 arcsec in both filters, respectively. The conditions were poorer for UDXS2219 than for UDXS2216, resulting in larger uncertainty in the photometric calibration. No photometric standard star was observed because we were primarily interested in relative photometry.
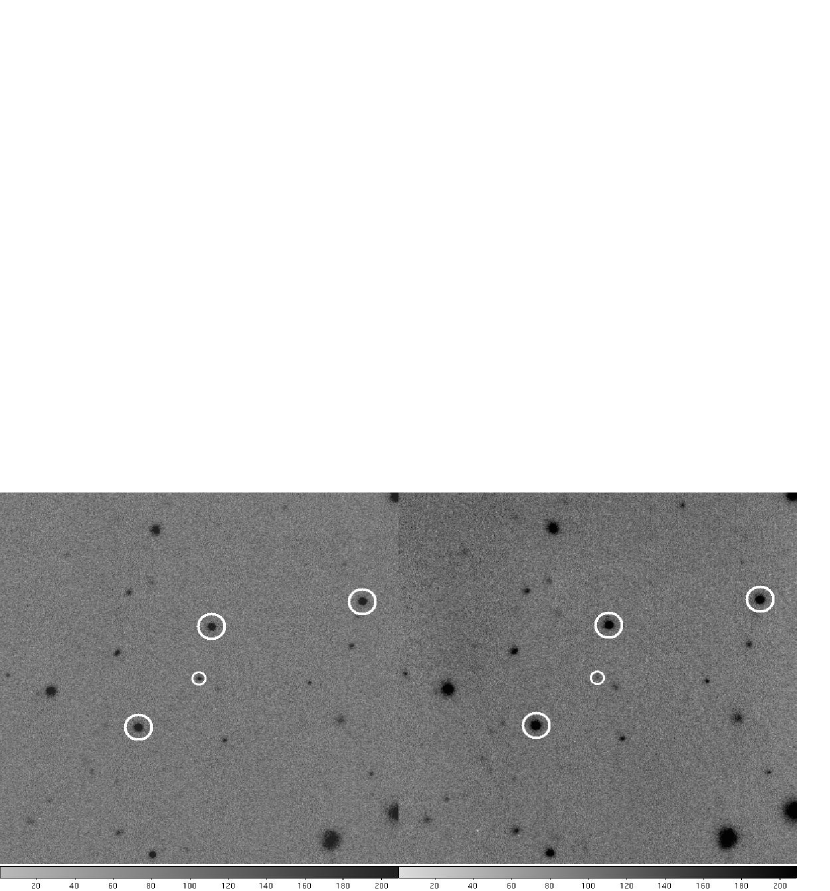
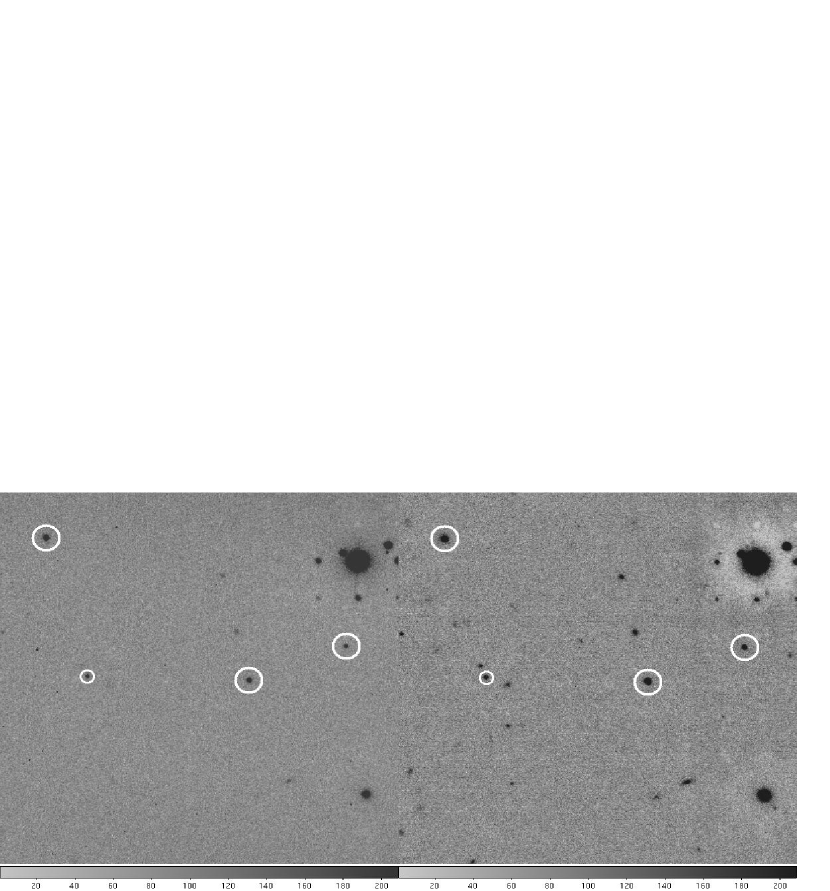
Data reduction was done using tasks in the Gemini IRAF NIRI package following a standard procedure. Files were prepared and corrected for offset bias using NSPREPARE. Then, a normalised flat-field was constructed using flats with the shutter on and off as well as short darks to identify bad pixels. Afterwards, each science image was sky-subtracted and divided by the normalised flat-field. A sky frame was created for each science frame after identifying and removing the stars present on the image. Finally, all images were co-added to create the final science frame. The procedure was identical for both filters. The final images in the CH4s and CH4l filters are displayed in Fig. 2 (UDXS2216 top and UDXS2219 bottom) and the targets marked with a small circle.
3.2 Differential methane photometry
We have carried out differential methane imaging (CH4s CH4l) following the technique described in Tinney et al. (2005). The photometry is neither corrected for exposure time and nor calibrated since we are only interested in relative photometry. We have compared the colour of our targets using several bright nearby stars within the NIRI field-of-view (marked with large circles in Fig. 2). We have assumed a zero methane colour for those stars, a reasonable assumption for any source with a spectral type from A0 to T2 (Tinney et al., 2005).
From a visual inspection of the images, UDXS2216 appears much fainter in the CH4l filter, suggesting that it is indeed a methane dwarf (Fig. 2). To quantify the difference in magnitude and estimate its spectral type, we have measured the flux of UDXS2216 within an aperture radius r=8 pixels, corresponding to 0.95 arcsec on the sky or twice the measured full width at half maximum. We have repeated this procedure for three bright stars within the NIRI field-of-view. The magnitudes and their associated errors are listed in Table LABEL:tab_dT:phot. The mean offset in colour (or methane index) for the three reference stars is 0.23 mag. Therefore, this value should be subtracted from the measured value for UDXS2216, yielding a final (CH4s CH4l) colour of 1.23 mag. The errors on the final colour is 0.15 mag and is dominated by the measurement uncertainties on the faint CH4l magnitude i.e. where the methane absorption band is affecting the spectral energy distribution of late-T dwarfs.
We have repeated the same procedure for UDXS2219 and three reference stars in the NIRI field-of-view (Fig. 2) using an aperture of 8 pixels (as for UDXS2216 for consistency). We have measured a mean offset of 0.191 mag (with a standard deviation of 0.09 mag) for the three stars and a methane index of 0.664 mag for the target (Table LABEL:tab_dT:phot), implying a final colour of 0.850.11 mag. The photometric error include the measurement uncertainties on the CH4s and CH4l magnitudes as well as a calibration uncertainty from the reference stars.
4 Spectral classification
UDXS2216 is one of the bluest late-T dwarfs in (values in the MKO system; Tokunaga et al., 2002) extracted from UKIDSS: the bluest one published in Lodieu et al. (2007) is ULAS J02220024, a T5 dwarf with = 0.47 mag. Since then, new mid to late-T dwarf have been discovered with bluer colours down to 0.95 mag (Pinfield et al., 2008). We observe a significant dispersion among T dwarfs from UKIDSS LAS in the vs spectral type relation, suggesting that our new candidate is later than T5. According to Figure 6 of Pinfield et al. (2008) a colour of 0.71 mag would translate into a spectral type of T5–T5.5 or T7–T8.5. To clarify this issue, we have investigated the synthetic colours of T dwarfs published by Hewett et al. (2006). Among the coolest T dwarfs listed in their Table 10, there is a clear cut-off in the colours between T4.5 and T6 with all sources later than T6 being bluer than 0.31 mag, the bluest being Gl570D (T7.5; Burgasser et al., 2000, 2006) with = 0.71 mag. Hence, according to synthetic colours (Hewett et al., 2006), UDXS2216 is likely to be a T7.5 dwarf, in agreement with the latest spectral range derived from observed colours of LAS T dwarfs.
The colour of UDXS2219 is not as blue as UDXS2216, placing less constraints on the spectral type. Again, according to Figure 6 of Pinfield et al. (2008), UDXS2219 could be an early-T dwarfs but also a mid to late-T with spectral type between T5 and T6.5. As pointed out earlier, the optical-to-infrared colour, however, places UDXS2219 in the late-T regime (Delorme et al., 2008b), favouring the latest spectral types.
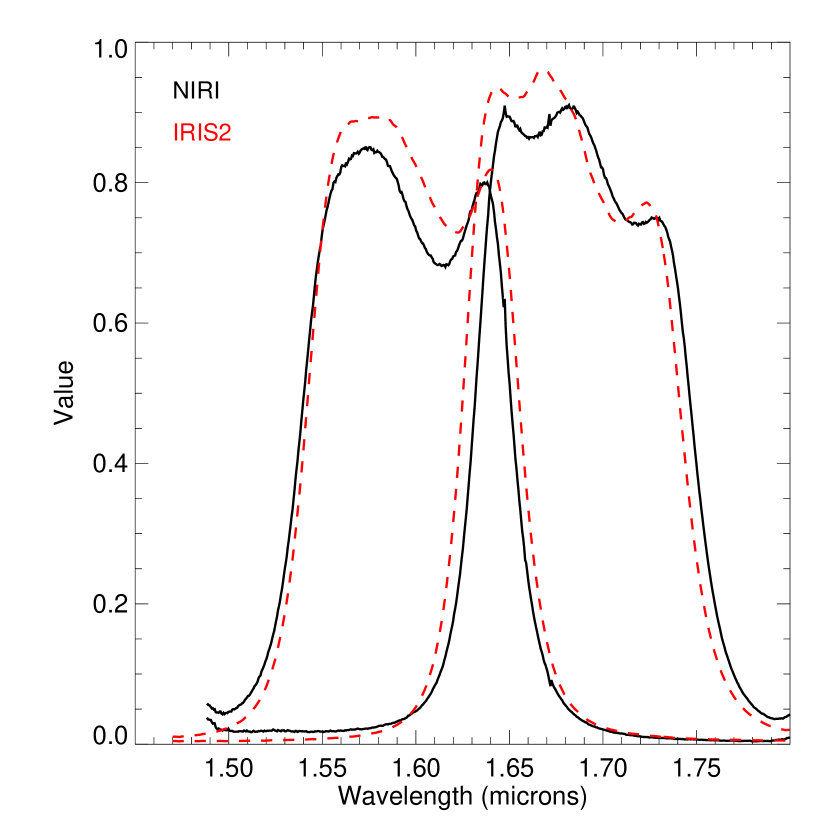
Tinney et al. (2005) presented a relation between the spectral type and the methane index given by the CH4sCH4l colour for 15 T dwarfs spanning the full T class (see their Table 2). The methane index is unique for T dwarfs later than T4, making this technique robust for identifying and classifying T dwarfs. According to Table 2 in Tinney et al. (2005), a clear difference in the methane index is observed between T6.5 and T7, with a sharp decrease of 0.5 mag. We have applied this technique to UDXS2216 using the methane filters on Gemini. Our methane index of 1.23 mag is consistent with the values quoted by Tinney et al. (2005) for SDSSp J134646003150 (T6.5; Tsvetanov et al., 2000) and 2MASS J121711-031113 (T7; Burgasser et al., 1999), yielding a spectral type of T6.5–T7 for UDXS2216. This result is in agreement with the latest spectral range inferred from the colour alone. Similarly, we estimate a spectral type of T6 from a methane index of 0.850.11 for UDXS2219, consistent with the indices derived by Tinney et al. (2005) for 2MASS J222828431026 (T6; Burgasser et al., 2003) and SDSSp J134646003150 (T6.5; Tsvetanov et al., 2000). The difference between the colours obtained with the Gemini NIRI and Anglo-Australian Telescope IRIS2 instrument should be small (0.05 mag) because both sets of filters present similar profiles (Fig. 3).
To summarise, we adopt spectral types of T7.01.0 and T61.0 for UDXS2216 and UDXS2219, respectively. Nonetheless, additional SDSS -band, -band, and/or mid-infrared 4.5m imaging would add further constraints on the spectral type and allow a direct comparison with a large number of late-T dwarfs from the LAS (Lodieu et al., 2007; Pinfield et al., 2008; Burningham et al., 2008).
5 Discussion
5.1 Photometric distances
There have been eight T7 dwarfs published to date (see the L and T dwarf archive)1, including Gl229B classified as peculiar (Nakajima et al., 1995; Burgasser et al., 2006) and only one with a measured parallax, 2MASS J072718171001 (Burgasser et al., 2002; Vrba et al., 2004). Assuming an absolute magnitudes (MJ) of 15.81 mag for the latter object and an dispersion of 0.5 mag on the spectral type vs MJ relation, UDXS2216 would be located at 75 pc. This estimate is in agreement with the 77 pc derived using the absolute magnitude of a T7 dwarf quoted by Vrba et al. (2004). The spectral type vs MJ relations given by Knapp et al. (2004), Liu et al. (2006), and Looper et al. (2008) lead to comparable distance intervals of 73–118 pc, 61–113 pc and 52–96 pc, respectively (assuming that the object is single). Therefore, we adopt a mean photometric distance of 81 pc, making UDXS2216 one of the coolest and furthest field T dwarfs along with NTTDF J12050744 (T7; 20.15 mag and 0.15 mag; Cuby et al., 1999).
There are two T6 dwarfs (not resolved as binary systems) with parallaxes, 2MASSI J024313245329 ( = 15.38; d = 10.68 pc Burgasser et al., 2002) and SDSSp J162414002915 ( = 15.494; d = 11 pc Strauss et al., 1999) along with the companion of SCR 18456357A (Biller et al., 2006) located at 3.85 pc (Henry et al., 2006). As nearby stars, those three objects have well-determined distances and suggest distances in the 54–59 pc range for UDXS2219. The absolute magnitude relation given by Vrba et al. (2004) suggests a distance of 60 pc. The spectral type vs MJ relations given by Knapp et al. (2004), Liu et al. (2006), and Looper et al. (2008) lead to comparable distance intervals of 54–86 pc, 55–87 pc and 44–70 pc, respectively (assuming that the object is single). Therefore, we adopt a mean value of 60 pc based on these seven measurements. We note that low-resolution near-infrared spectroscopy of UDXS2219 should be possible with current instrumentation ( = 19.0 mag).
| Field | Area | depth | 1.5 | 1.0 | 0.5 | 0.0 |
|---|---|---|---|---|---|---|
| Lockman | 0.77 | 20.3 | 0.23 | 0.30 | 0.45 | 0.68 |
| XMM-LSS | 0.77 | 20.4 | 0.22 | 0.31 | 0.52 | 0.84 |
| ELAIS N1 | 1.54 | 20.3 | 0.36 | 0.56 | 0.82 | 1.66 |
| VIMOS 4 | 3.08 | 20.6 | 1.16 | 1.80 | 2.58 | 4.18 |
| All | 6.16 | 20.5 | 1.97 | 2.97 | 4.37 | 7.36 |
5.2 Expected number of T dwarfs in the DXS
We have found two late-T dwarfs in six square degrees down to a completeness limit ranging from = 19.2 to = 21.1 mag (Sect. 2.1). We have estimated the depth of the DXS DR2 in each individual field for good quality point sources (jClass and kClass parameter between 2 and 1; ellipticity less than 0.333; jppErrBits and kppErrBits parameter less than 256). This combination of parameters provides an estimate of the point-source detection of the data for single band detections only. The assessment of the detection efficiency of our selection is, however, a strong function of the types and colours of the sources being sought. Including a colour cut to the above criteria would add different kind of biases. For example, the colour selection made for our purpose (0.1 mag) will result in an extremely small statistics whereas the consideration of all sources will introduce a large sample of extremely red objects (mainly extragalactic) with a better detection in than in . On the other hand, an intermediate colour criterion will return a complicated function of decreasing number of stellar sources and increasing number of extragalactic sources.
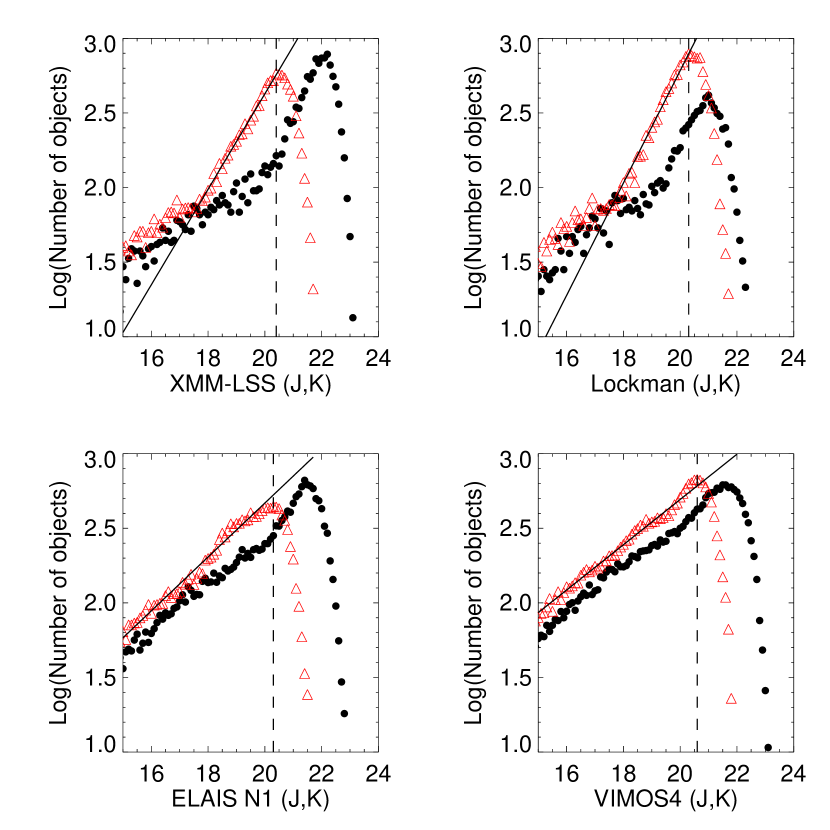
Figure 4 shows the histograms of the number of point sources per magnitude bin as a function of the or magnitudes (scaled to a one-square-degree area) in the XMM-LSS, Lockman Hole, ELAISN N1, and VIMOS 4 fields. We infer a 100% completeness limit of = 20.3–20.6 mag for point sources with a small variation across the four fields (Table LABEL:tab_dT:results_simulations). Many sources may however be extragalactic sources, especially at the faint end of the histograms. These limits are deduced from the points where the histograms deviate from the powerlaw fit to the counts (Figure 4). As we are looking for blue objects, our search is currently limited by the depth in . The total area surveyed in each field is 0.77, 0.77, 1.54, and 3.08 square degrees for the XMM-LSS, Lockman Hole, ELAISN N1, and VIMOS 4 field, respectively (Table LABEL:tab_dT:results_simulations).
Deacon & Hambly (2006) provide simulations of the expected number of late-T dwarfs (defined as brown dwarfs cooler than 1300 K) for various forms of the Initial Mass Function (IMF) and birthrates. We have adapted their simulations to the DXS and used a similar set of simulations to those used in Pinfield et al. (2008). These are essentially those from Deacon & Hambly (2006) but with a few changes described now. The normalisation factor i.e., the density of stars with masses between 0.09 and 0.1 M⊙, was set 0.0038 pc-3 (Deacon et al., 2008). The uncertainty on that normalised factor is about 30%. Also, the former simulations did not require a detection in but and . However, for the DXS and UDS simulations, we have used only and (and not and ) because those surveys are only observing in those two passbands. Additionally, the Galactic model in use is now the one published by Deacon et al. (2008). Finally, the number of simulations has been increased by a factor of ten to get rid off the small number fluctuations.
Following these upgraded simulations, the numbers of expected late-T dwarfs for different values of the power law index (defined in the Salpeter scale as d/d( M) = M-α) and scaled to the depth and area of each DXS field from DR2 are shown in Table LABEL:tab_dT:results_simulations. Thus, we should expect between 2.0 and 7.4 late-T dwarfs in 6.16 square degrees down to 20.5 mag for indices of 1.0, 0.5, and 0 as well as a lognormal form of the IMF (last line in Table LABEL:tab_dT:results_simulations). We should also mention that we looked only for candidates bluer than = 0.1 and some redder late-T dwarfs might have escaped our search criteria. The results agree with a declining mass function but statistics are too small to set any limits on underlying parameters of the IMF such as the index.
The second object is fainter than the limits set for the simulations and lies, within the photometric error bars, at the depth that the DXS aimed to achieve for each tile. If we assume a depth of = 21.1 mag as chosen for our selection search (Sect. 2.1), we would probe a volume 2.3 times larger (on average), implying that we should find 4.6–17 late-T dwarfs in DXS DR2. However, we are only 95% complete in this extra magnitude bin ( = 20.5–21.1 mag) from the ratio of the extrapolated power law fit to the histogram shown in Fig. 4 to the observed number of objects. We found one T dwarf candidate whereas the simulations predict 4.4–16.2.
5.3 Search in the UDS DR2
The UDS field is centered on (2h18,5∘10′) and is located to the west of the XMM-LSS field in the DXS (Lawrence et al., 2007). It was chosen to overlap with the Subaru/XMM Deep Survey field (Furusawa et al., 2008) where multi-wavelength coverage is available888More details at: http://www.nottingham.ac.uk/astronomy/uds. The UDS covers one tile only and will be repeated over the 7 year UKIDSS plan with a 33 microstepping (pixel size of 0.1342 arcsec) to achieve depths of = 25.0 mag , = 24.0 mag and = 24.0 mag ( point-like sources) over a contiguous area of 0.77 deg2. Seeing constraints are 0.85 arcsec in with a sky brightness greater than 16 mag/arcsec2 and seeing at less than 0.75 arcsec with no sky brightness limit (Dye et al., 2006). The data processing follows the standard WFCAM processing (Irwin et al., in prep.) up to the creation of the intermediate deep stacks. The remaining steps to create the final stacked tile is achieved with special processing developed by the UDS team as described in Foucaud et al. (2007) and in more detail in a forthcoming paper (Almaini et al., in prep.). The data releases used in this paper are DR2 (Warren et al., 2007) and DR3, reaching depths of = 22.8 mag and = 21.6 mag, and = 22.8 mag, = 22.1 mag and = 21.8 mag respectively. The measured mean seeing is 0.90′′ in , 0.85′′ in and 0.75′′ in . Internal astrometry is good with a rms of 30 milli-arcsec. The stacking method used was a weighted mean stacking method for DR2 and a 3 clipping weighted stacking method for DR3 which hampers the detection of objects with proper motions larger than the resolution of the final stacked image.
We have applied the same constraints detailed in Sect. 2.1 to the UDS DR2: jClass and kClass between 2 and 1, ellipticity less than 0.333, and 0.1 mag. However, two differences should be emphasised: first, the 5 limit of the UDS is deeper in and and we have set it to = 21.5 mag; second, the UDS field-of-view is made solely of one WFCAM tile i.e. 0.8 square degree located in the Subaru/XMM-Newton Deep Survey field. However, plotting the same histograms as for the DXS suggests that the depth of the UDS DR2 for point sources is 20.0 mag (actually shallower than the DXS) because the coverage do not overlap, implying that the UDS is not taking advantage of the depth of the DXS. If we include galaxies, the depth corresponds to the values quoted in WSA ( = 21.6 mag and = 21.5 mag). Our query returned eight candidates but all of them turned out to be cross-talks. Hence, no new T dwarf candidate was extracted. Moreover, we have extended this search to the latest data release (DR3) and didn’t find any new candidate despite a survey about one magnitude deeper in but not .
Assuming the predictions by Deacon & Hambly (2006) for the UDS with the upgrades detailed in the previous section (Sect. 5.2), we should find at most three late-T dwarfs for the depth ( 20 mag) of the UDS DR2. Those numbers are statistically in agreement with the non-detection of late-T dwarfs in the current data if we add the fact that we are likely missing T dwarfs with large proper motions. Upcoming UDS releases should allow us to extract (and possibly confirm) some candidates, as the simulations predict around 40–200 late-T dwarfs, depending on the shape of the mass function.
6 Conclusions
We have presented the discovery of two new late-T dwarfs at 60 and 80 pc (95% confidence level) extracted photometrically from six square degrees surveyed by the UKIDSS DXS DR2. These new T dwarfs, UDXS2219 and UDXS2216, have colours and methane indices suggesting spectral types of T6 and T7 (with an uncertainty of one subclass), respectively. These are the first confirmed late-T dwarfs found in the DXS VIMOS 4 field. They are also among the coolest and most distant T dwarfs found to date. We have demonstrated the viability of a simple, but well chosen catalogue query for finding brown dwarfs.
These discoveries open new prospects and represent a first step to determine the scale height of T dwarfs. They are currently eight late-T dwarfs at distances larger than 50 pc (this number is approximate since the distance estimates are subject to an uncertainty on the spectral type vs MJ relation for T dwarfs). Moreover, the availability of public deep optical surveys in those regions are extremely valuable to hunt for ultracool brown dwarfs. In this context, additional optical ( or ) imaging is required to complement the SDSS Stripe 82 and cover the full DXS VIMOS 4 field. The upcoming UKIDSS data releases will provide deeper data in the four fields surveyed as part of the DXS and UDS and will certainly trigger additional discoveries of even further T dwarfs and eventually Y dwarfs.
Acknowledgments
We thank the anonymous referee for his/her comments and suggestions which improved significantly the original version of the paper. N.R.D. is funded by NOVA and by NWO-VIDI grant 639.041.405 to Paul Groot. We also would like to thank the Gemini HelpDesk, especially John Holt, for the help with the NIRI data reduction.
This research has made use of the Simbad database and of NASA’s Astrophysics Data System Bibliographic Services (ADS). Research has benefitted from the M, L, and T dwarf compendium housed at DwarfArchives.org and maintained by Chris Gelino, Davy Kirkpatrick, and Adam Burgasser.
The United Kingdom Infrared Telescope is operated by the Joint Astronomy Centre on behalf of the U.K. Science Technology and Facility Council.
Based on observations obtained at the Gemini Observatory (programs GN-2007A-Q-88 and GN-2008B-Q-90), which is operated by the Association of Universities for Research in Astronomy, Inc., under a cooperative agreement with the NSF on behalf of the Gemini partnership: the National Science Foundation (United States), the Particle Physics and Astronomy Research Council (United Kingdom), the National Research Council (Canada), CONICYT (Chile), the Australian Research Council (Australia), CNPq (Brazil) and SECYT (Argentina). The SDSS is managed by the Astrophysical Research Consortium for the Participating Institutions. The Participating Institutions are the American Museum of Natural History, Astrophysical Institute Potsdam, University of Basel, University of Cambridge, Case Western Reserve University, University of Chicago, Drexel University, Fermilab, the Institute for Advanced Study, the Japan Participation Group, Johns Hopkins University, the Joint Institute for Nuclear Astrophysics, the Kavli Institute for Particle Astrophysics and Cosmology, the Korean Scientist Group, the Chinese Academy of Sciences (LAMOST), Los Alamos National Laboratory, the Max-Planck-Institute for Astronomy (MPIA), the Max-Planck-Institute for Astrophysics (MPA), New Mexico State University, Ohio State University, University of Pittsburgh, University of Portsmouth, Princeton University, the United States Naval Observatory, and the University of Washington.
This research has benefitted from observations obtained with MegaPrime/MegaCam, a joint project of CFHT and CEA/DAPNIA, at the Canada-France-Hawaii Telescope (CFHT) which is operated by the National Research Council (NRC) of Canada, the Institut National des Science de l’Univers of the Centre National de la Recherche Scientifique (CNRS) of France, and the University of Hawaii. This work is based in part on data products produced at TERAPIX and the Canadian Astronomy Data Centre as part of the Canada-France-Hawaii Telescope Legacy Survey, a collaborative project of NRC and CNRS.
This research used the facilities of the Canadian Astronomy Data Centre operated by the National Research Council of Canada with the support of the Canadian Space Agency.
References
- Adelman-McCarthy et al. (2008) Adelman-McCarthy J. K., et al. 2008, ApJS, 175, 297
- Adelman-McCarthy et al. (2007) Adelman-McCarthy J. K., et al. 2007, ApJS, 172, 634
- Biller et al. (2006) Biller B. A., Kasper M., Close L. M., Brandner W., Kellner S., 2006, ApJL, 641, L141
- Burgasser et al. (2006) Burgasser A. J., Geballe T. R., Leggett S. K., Kirkpatrick J. D., Golimowski D. A., 2006, ApJ, 637, 1067
- Burgasser et al. (2002) Burgasser A. J., et al. 2002, ApJ, 564, 421
- Burgasser et al. (1999) Burgasser A. J., et al. 1999, ApJL, 522, L65
- Burgasser et al. (2000) Burgasser A. J., et al. 2000, ApJL, 531, L57
- Burgasser et al. (2003) Burgasser A. J., McElwain M. W., Kirkpatrick J. D., 2003, AJ, 126, 2487
- Burningham et al. (2008) Burningham B., et al. 2008, MNRAS, 391, 320
- Casali et al. (2007) Casali M., et al. 2007, A&A, 467, 777
- Chiu et al. (2008) Chiu K., et al. 2008, MNRAS, 385, L53
- Cuby et al. (1999) Cuby J. G., Saracco P., Moorwood A. F. M., D’Odorico S., Lidman C., Comerón F., Spyromilio J., 1999, A&A, 349, L41
- Deacon & Hambly (2006) Deacon N. R., Hambly N. C., 2006, MNRAS, 371, 1722
- Deacon et al. (2008) Deacon N. R., Nelemans G., Hambly N. C., 2008, A&A, 486, 283
- Delorme et al. (2008b) Delorme P., et al. 2008b, A&A, 484, 469
- Dye et al. (2006) Dye S., et al. 2006, MNRAS, 372, 1227
- Foucaud et al. (2007) Foucaud S., et al. 2007, MNRAS, 376, L20
- Frieman et al. (2008) Frieman J. A., et al. 2008, AJ, 135, 338
- Furusawa et al. (2008) Furusawa H.,et al. 2008, ApJS, 176, 1
- Golimowski et al. (2004) Golimowski D. A., et al. 2004, AJ, 127, 3516
- Hambly et al. (2008) Hambly N. C., et al. 2008, MNRAS, 384, 637
- Henry et al. (2006) Henry T. J., et al. 2006, AJ, 132, 2360
- Hewett et al. (2006) Hewett P. C., Warren S. J., Leggett S. K., Hodgkin S. T., 2006, MNRAS, 367, 454
- Hodapp et al. (2003) Hodapp K. W., et al. 2003, PASP, 115, 1388
- Kendall et al. (2007) Kendall T. R., et al. 2007, A&A, 466, 1059
- Kirkpatrick et al. (1999) Kirkpatrick J. D., et al. 1999, ApJ, 519, 802
- Knapp et al. (2004) Knapp G. R., et al. 2004, AJ, 127, 3553
- Lawrence et al. (2007) Lawrence A., et al. 2007, MNRAS, 379, 1599
- Liu et al. (2006) Liu M. C., Leggett S. K., Golimowski D. A., Chiu K., Fan X., Geballe T. R., Schneider D. P., Brinkmann J., 2006, ApJ, 647, 1393
- Liu et al. (2002) Liu M. C., Wainscoat R., Martín E. L., Barris B., Tonry J., 2002, ApJL, 568, L107
- Lodieu et al. (2007) Lodieu N., et al. 2007, MNRAS, 379, 1423
- Looper et al. (2008) Looper D. L., Gelino C. R., Burgasser A. J., Kirkpatrick J. D., 2008, ApJ, 803
- Monet et al. (2003) Monet D. G., et al. 2003, AJ, 125, 984
- Nakajima et al. (1995) Nakajima T., Oppenheimer B. R., Kulkarni S. R., Golimowski D. A., Matthews K., Durrance S. T., 1995, Nat, 378, 463
- Oppenheimer et al. (1995) Oppenheimer B. R., Kulkarni S. R., Matthews K., Nakajima T., 1995, Science, 270, 1478
- Pinfield et al. (2008) Pinfield D. J., et al. 2008, MNRAS, 390, 304
- Rebolo et al. (1995) Rebolo R., Zapatero-Osorio M. R., Martín E. L., 1995, Nat, 377, 129
- Sako et al. (2005) Sako M., et al. 2005, astro-ph/0504455
- Strauss et al. (1999) Strauss M. A., et al. 1999, ApJL, 522, L61
- Tinney et al. (2005) Tinney C. G., Burgasser A. J., Kirkpatrick J. D., McElwain M. W., 2005, AJ, 130, 2326
- Tokunaga et al. (2002) Tokunaga A. T., Simons D. A., Vacca W. D., 2002, PASP, 114, 180
- Tsvetanov et al. (2000) Tsvetanov Z. I., et al. 2000, ApJL, 531, L61
- Vrba et al. (2004) Vrba F. J., et al. 2004, AJ, 127, 2948
- Warren et al. (2007) Warren S. J., et al. 2007, astro-ph/0703037
- Warren et al. (2007) Warren S. J., et al. 2007, MNRAS, 375, 213
- York et al. (2000) York D. G., et al. 2000, AJ, 120, 1579
- Zapatero Osorio et al. (2008) Zapatero Osorio M. R., et al. 2008, A&A, 477, 895