Mid-infrared spectroscopy of infrared-luminous galaxies at 0.5–3
Abstract
We present results on low-resolution mid-infrared (MIR) spectra of 70 infrared-luminous galaxies obtained with the Infrared Spectrograph (IRS) onboard Spitzer. We selected sources from the European Large Area Infrared Survey (ELAIS) with 0.8 mJy and photometric or spectroscopic 1. About half of the sample are QSOs in the optical, while the remaining sources are galaxies, comprising both obscured AGN and starbursts. Redshifts were obtained from optical spectroscopy, photometric redshifts and from the IRS spectra. The later turn out to be reliable for obscured and/or star-forming sources, thus becoming an ideal complement to optical spectroscopy for redshift estimation.
We estimate monochromatic luminosities at several restframe wavelengths, equivalent widths and luminosities for the PAH features, and strength of the silicate feature in individual spectra. We also estimate integrated 8–1000 µm infrared luminosities via spectral energy distribution fitting to MIR and far-infrared (FIR) photometry from the Spitzer Wide-area Infrared Extragalactic survey (SWIRE) and the MIR spectrum. Based on these measurements, we classify the spectra using well-known infrared diagnostics, as well as a new one that we propose, into three types of source: those dominated by an unobscured AGN, mostly corresponding to optical quasars (QSOs), those dominated by an obscured AGN, and starburst-dominated sources. Starbursts concentrate at 0.6–1.0 favored by the shift of the 7.7-µm PAH band into the selection 15-µm band, while AGN spread over the range.
Star formation rates (SFR) are estimated for individual sources from the luminosity of the PAH features. An estimate of the average PAH luminosity in QSOs and obscured AGN is obtained from the composite spectrum of all sources with reliable redshifts. The estimated mean SFR in the QSOs is 50–100 , but the implied FIR luminosity is 3–10 times lower than that obtained from stacking analysis of the FIR photometry, suggesting destruction of the PAH carriers by energetic photons from the AGN. The SFR estimated in obscured AGN is 2–3 times higher than in QSOs of similar MIR luminosity. This discrepancy might not be due to luminosity effects or selection bias alone, but could instead indicate a connection between obscuration and star formation. However, the observed correlation between silicate absorption and the slope of the near- to mid-infrared spectrum is compatible with the obscuration of the AGN emission in these sources being produced in a dust torus.
keywords:
galaxies: starburst – galaxies: high-redshift – galaxies: active – quasars: general1 Introduction
Infrared-luminous Galaxies (LIRGs), those objects with infrared (IR, [8–1000µm]) luminosities above (and the Ultraluminous Infrared Galaxies, those objects with ) are an important population for understanding the cosmological evolution of galaxies. At low redshifts LIRGs are relatively rare, with only a few hundred known over the whole sky at (Soifer et al. 1984). At higher redshifts they are much more common; at they reach a density on the sky of several hundred per square degree, and make a substantial, perhaps even dominant contribution to both the Cosmic Infrared Background and the volume-averaged cosmic star formation rate (Lagache et al. 2005; Sanders & Mirabel 1996; Lonsdale et al. 2006).
Theoretical and empirical studies have shown that many LIRGs and virtually all ULIRGs at low redshift are interacting systems (Gallimore & Keel 1993; Clements et al. 1996; Sanders & Mirabel 1996; Borne et al. 1999; Farrah et al. 2001). The power source behind the IR emission was initially controversial, with both star formation and AGN activity proposed as the sole driver, but in recent years a consensus has started to emerge, with most studies finding that both starbursts and AGN power low-redshift LIRGs and ULIRGs, with the star formation usually dominating (Genzel et al. 1998; Farrah et al. 2003; Imanishi et al. 2007). At high redshifts a broadly similar picture is thought to exist (Farrah et al. 2002; Chapman et al. 2003; Takata et al. 2006; Berta et al. 2007; Bridge et al. 2007).
The ability to reliably distinguish between star formation and AGN activity in high redshift LIRGs is essential for tracing both the cosmic star formation history and the evolution of AGN activity as a function of redshift. Since these galaxies are dusty, the usual optical/near-infrared diagnostics are not always reliable. Instead, mid-infrared (MIR) spectroscopy has proved itself the key tool for determining the dominant energy source in dusty galaxies (e.g. Genzel et al. 1998; Rigopoulou et al. 1999; Laurent et al. 2000; Tran et al. 2001; Weedman et al. 2005), but until recently the limited sensitivity of the Infrared Space Observatory (ISO) constrained the spectroscopic study of ULIRGs to the local Universe. With the Infrared Spectrograph (IRS, Houck et al. 2004) onboard Spitzer, wavelength coverage and sensitivity have improved enough to allow redshift determination and spectroscopic classification for ULIRGs at all redshifts up to (Houck et al. 2005; Yan et al. 2005; Weedman et al. 2006; Armus et al. 2007; Farrah et al. 2007).
In most cases, spectroscopic surveys of high-redshift sources with the IRS have selected sources with a high infrared-to-optical flux ratio (Houck et al. 2005; Yan et al. 2005; Weedman et al. 2006). These turn out to be mostly obscured AGN at high redshift, with spectra dominated by silicate absorption. Starburst ULIRGs with strong PAH emission are rare in these samples, but prolific if the selection criteria instead include sub-mm detections (Lutz et al. 2005) or prominent stellar ‘bumps’ in the IRAC bands (Farrah et al. 2008).
In contrast, the IRS has undertaken relatively few surveys of sources selected solely on the basis of MIR flux. This means that moderately to lightly absorbed sources will be under represented in IRS surveys, thus drawing an incomplete picture of the nature of the infrared galaxy population at high redshifts. In this work we present results on a sample of 70 LIRGs and ULIRGs selected in the MIR with no constraints on the optical fluxes (other than the requirement of detection in at least 3 optical bands in deep imaging and photometric or spectroscopic 1. Our objectives are: (a) to classify the sources into starburst-dominated (SB), obscured AGN-dominated (AGN2) and unobscured AGN-dominated (AGN1), based on their MIR spectral properties, and compare this classification with that obtained from optical data. (b) To estimate the IR luminosity of the sources and the relative contribution of AGN and star formation. (c) To obtain star formation rates for the obscured and unobscured AGN.
The paper is structured as follows: §2 describes the sample selection; §3 discusses the observations and data reduction; §4 presents the measurements and diagnostics; §5 compares the results to other high- MIR-selected samples; and §6 summarizes our conclusions. We adopt the following cosmology: = 0.27, = 0.73, = 71 km s-1 Mpc-1.
2 Sample selection
The sources were selected from the European Large Area ISO Survey (ELAIS; Oliver et al. 2000; Rowan-Robinson et al. 2004) final band-merged catalog (Rowan-Robinson 2003). The selection criteria required detection in the ISOCAM LW3 band (Vaccari et al. 2005) with 0.8 mJy, as well as detection in at least 3 optical bands and spectroscopic or photometric redshift 1.
The 70 objects that matched were observed with the IRS (Hernán-Caballero et al. 2008), resulting in one of the largest 1 samples of MIR spectra of infrared-luminous galaxies to date. Table 1 indicates the name and coordinates of these sources. Only the first 15 entries of each table are shown here. The complete version of the tables is available as on-line material.
In addition to the MIR spectra, there is also optical and IR photometry available for all sources, as well as optical spectroscopy for roughly half of them.
For sources in the northern hemisphere (ELAIS N1 and N2 fields) optical , , , , photometry comes from the Isaac Newton Telescope Wide Field Survey (WFS), with limiting magnitudes 23.4, 24.9, 24.0, 23.2 and 21.9 (Vega) respectively (González-Solares et al. 2005). In the southern hemisphere (ELAIS S1) optical photometry was obtained down to , 25, 24.5 (Berta et al. 2006).
Eight sources (six of them in ELAIS S1) have near-infrared (NIR) photometry from the Two Micron All Sky Survey (2MASS; Skrutskie et al. 2006), and ten more are detected by the UKIRT Infrared Deep Sky Survey (UKIDSS; Lawrence et al. 2007) in the central region of ELAIS N1. Table 2 summarizes the optical and NIR photometry for the ELAIS-IRS sources.
The three ELAIS fields in which the ELAIS-IRS sample was selected were observed by Spitzer in seven IR bands from 3.6 to 160 µm, as part of the Spitzer Wide-Area Infrared Extragalactic Survey (SWIRE; Lonsdale et al. 2003a, 2004). We performed a source match between the ELAIS-IRS catalog and the latest working catalog from SWIRE and found that 69 out of 70 ELAIS-IRS sources are detected in at least two IRAC bands and in the 24-µm band from MIPS, while 33 are detected in the 70-µm band and only 14 at 160 µm (see Table 3).
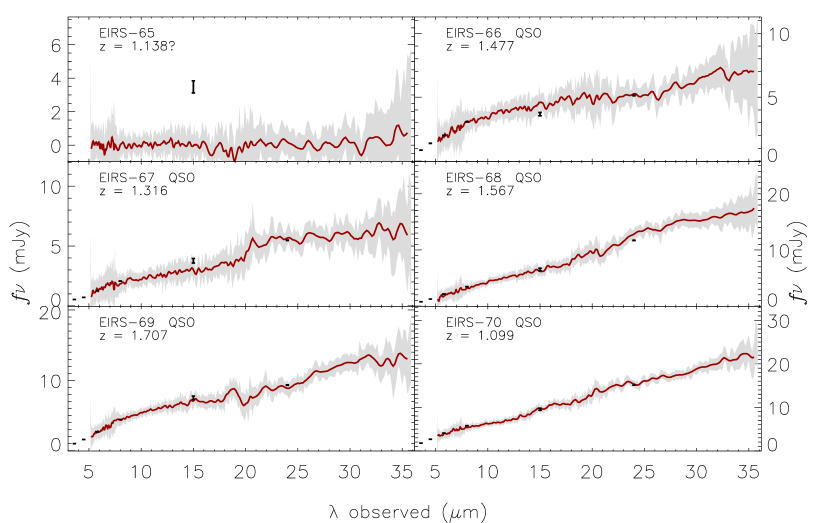
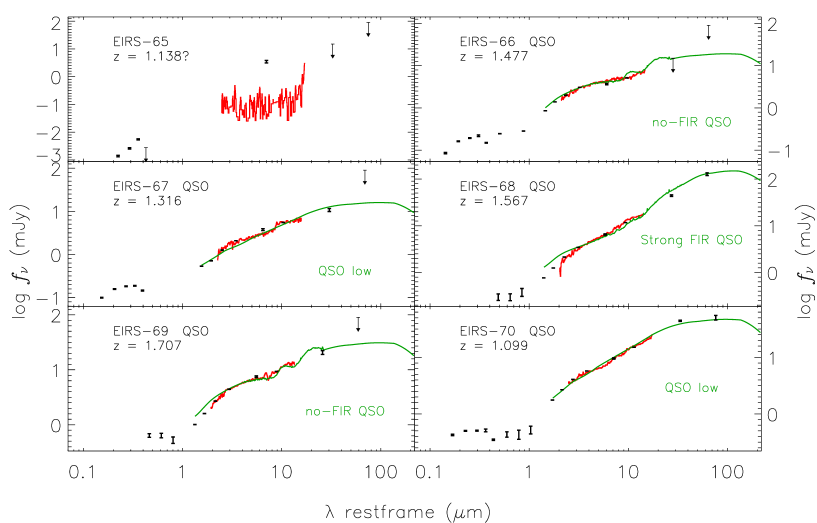
One source, EIRS-65, has no infrared counterpart in the SWIRE catalog and is undetected in the IRS spectrum. Since the 15-µm detection is strong, the 15-µm source is probably real but was associated to the wrong optical counterpart.
Photometric redshifts were calculated using optical and NIR photometry for all sources in the ELAIS bandmerge catalog (Rowan-Robinson et al. 2004). These estimates were revised with posteriority to the sample selection using IRAC photometry from SWIRE (Rowan-Robinson et al. 2004, 2008), leading in some cases to revised photometric 1. At least four and up to nine optical and NIR bands are used for photometric redshift estimation, except in four sources whose redshifts are obtained from just three bands and are thus very unreliable (EIRS-19,40,52,55).
Redshifts from optical spectroscopy are also available for 37 ELAIS-IRS sources, most of them from spectroscopic follow-ups of ELAIS QSOs (Afonso-Luis et al. 2004; La Franca et al. 2004) or the Sloan Digital Sky Survey (SDSS; York et al. 2000).
Since an optical photometric or spectroscopic redshift is required for source selection, the sample is biased against the most obscured sources; and the lack of constraints in the IR-to-optical flux ratio provides a large number of unobscured AGN which are absent in other high- MIR-selected samples (see §6.1).
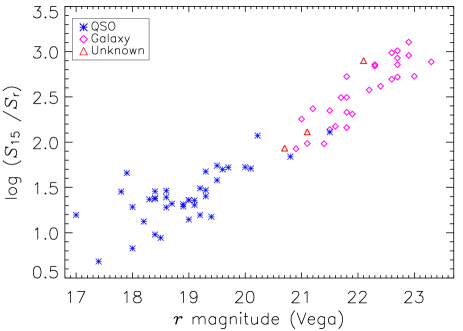
39 sources are classified as QSOs by their optical spectral energy distribution (SED) or spectrum, while 28 are galaxies (including starbursts and obscured AGN) and the remaining 3 are of undetermined type. QSOs and galaxies can be easily distinguished by their optical-to-MIR flux ratios (Fig. 1) with little overlap between populations.
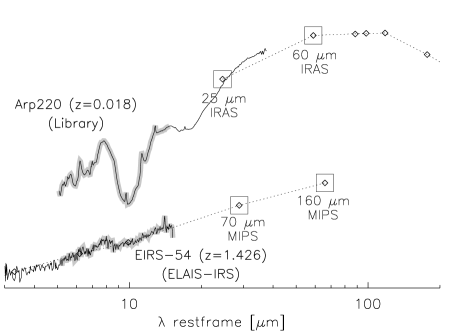
In order to provide a good reference sample for redshift estimation and calibrate the MIR diagnostic tools, we have compiled a set of MIR spectra and MIR-to-FIR photometry containing 137 well-known low-redshift sources (the ‘Library’), including QSOs, Seyfert 1 and Seyfert 2 galaxies, ULIRGs and starbursts. The MIR spectra are high- and low-resolution IRS spectra published in the literature (see Table 4), while redshifts, classification and IR photometry for the sources were extracted from the NASA Extragalactic Database (NED).
3 Observations and Data Reduction
All targets were observed in the two low-resolution modules of the IRS, Short-low (SL) and Long-low (LL), exposing the two sub-slits on each of them (SL1, SL2, LL1 and LL2) and thus covering the 5–38 µm range. Two nod positions were observed in each configuration in order to provide optimal background subtraction. Exposure times for the LL were defined using ISOCAM 15-µm flux densities in order to assure an adequate S/N at this wavelength. Integration times for the SL were calculated from the 15-µm flux density assuming an M82-like SED. The observations log is shown in Table 1.
Raw IRS data were reduced by the IRS pipeline (ver. S15.3.0) at the Spitzer Science Center. This included ramp fitting, dark subtraction, flat-fielding and wavelength and flux calibration.
Since our sources are faint, additional reductions were carried out starting from the Basic Calibrated Data (BCD) stage. Images with the object centred in alternate sub-slits of the same module were subtracted (i.e: SL1-SL2, LL1-LL2) to remove sky background, and their corresponding uncertainty and mask images were, respectively, added and bit-wise XOR combined.111In the mask images, individual bits are set for each pixel that meets a particular condition. In the combined mask, a bit is set if it is set in at least one of the two original masks. One-dimensional spectra for both nod positions were extracted using the Spitzer IRS Custom Extraction (SPICE) version 1.4.1. The extraction aperture was set to the SPICE default, and the Optimal Calibration Mode, in which the signal in each pixel is weighted with its uncertainty, was selected.
Individual spectra were flux-calibrated with SPICE using standard calibration files for pipeline S15.3.0, and then combined into a single spectrum using custom IDL routines.
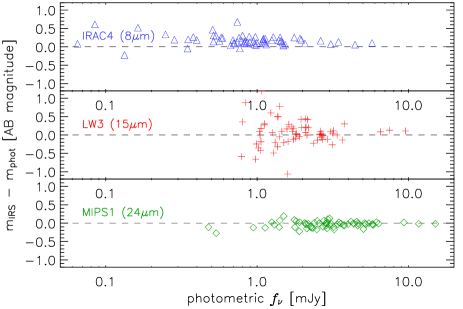
Comparison with IRAC 8.0-µm and MIPS 24-µm photometry from SWIRE and ISOCAM 15-µm from ELAIS indicates that the relative flux calibration uncertainty is around 14, 35 and 8 per cent at 8, 15 and 24 µm, respectively. Note that the uncertainty at 15 µm increases sharply around 1 mJy as it approximates the detection limit of the ELAIS survey (Fig. 2). The 8-µm fluxes from IRS data are in average 10 per cent lower than in the IRAC photometry, but we have preferred not to make any flux correction to the IRS spectra since the 8-µm band covers a somewhat noisy region of the Short-Low spectrum in the overlapping wings of the SL1 and SL2 transmission profiles.
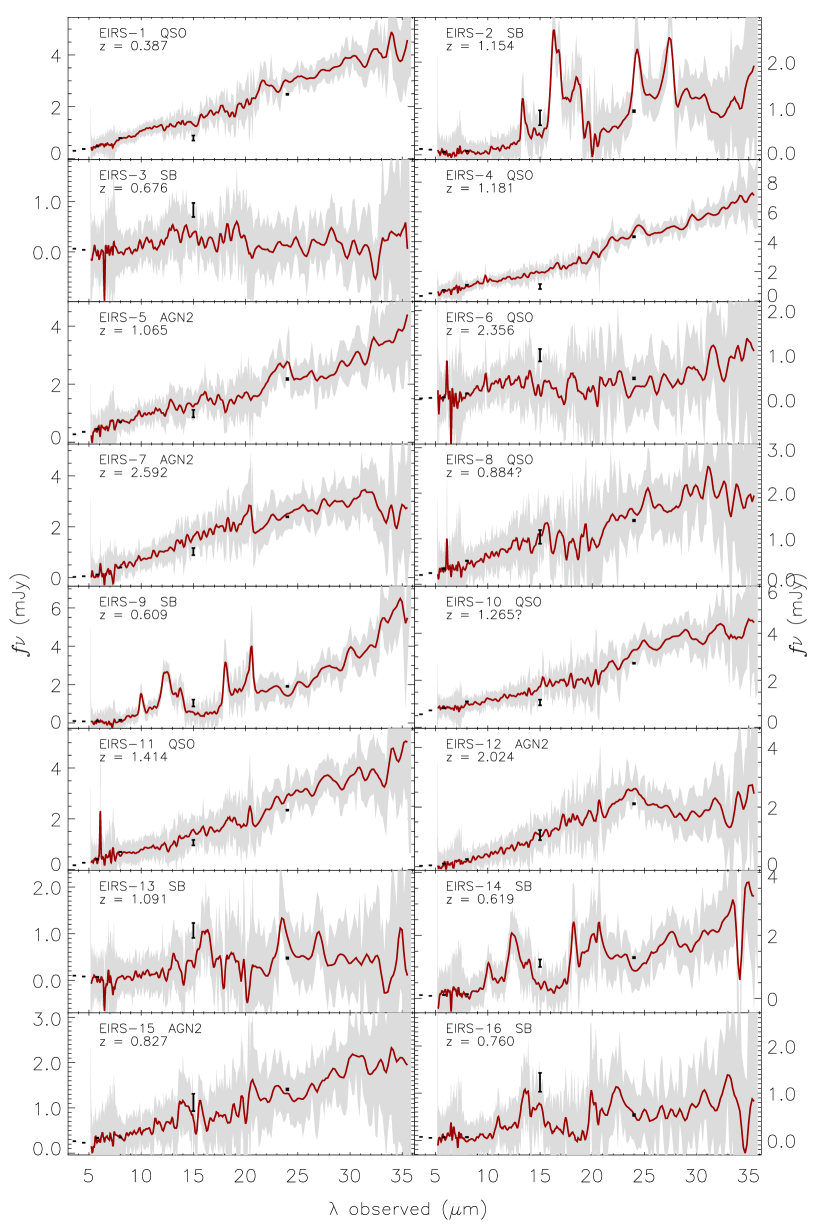
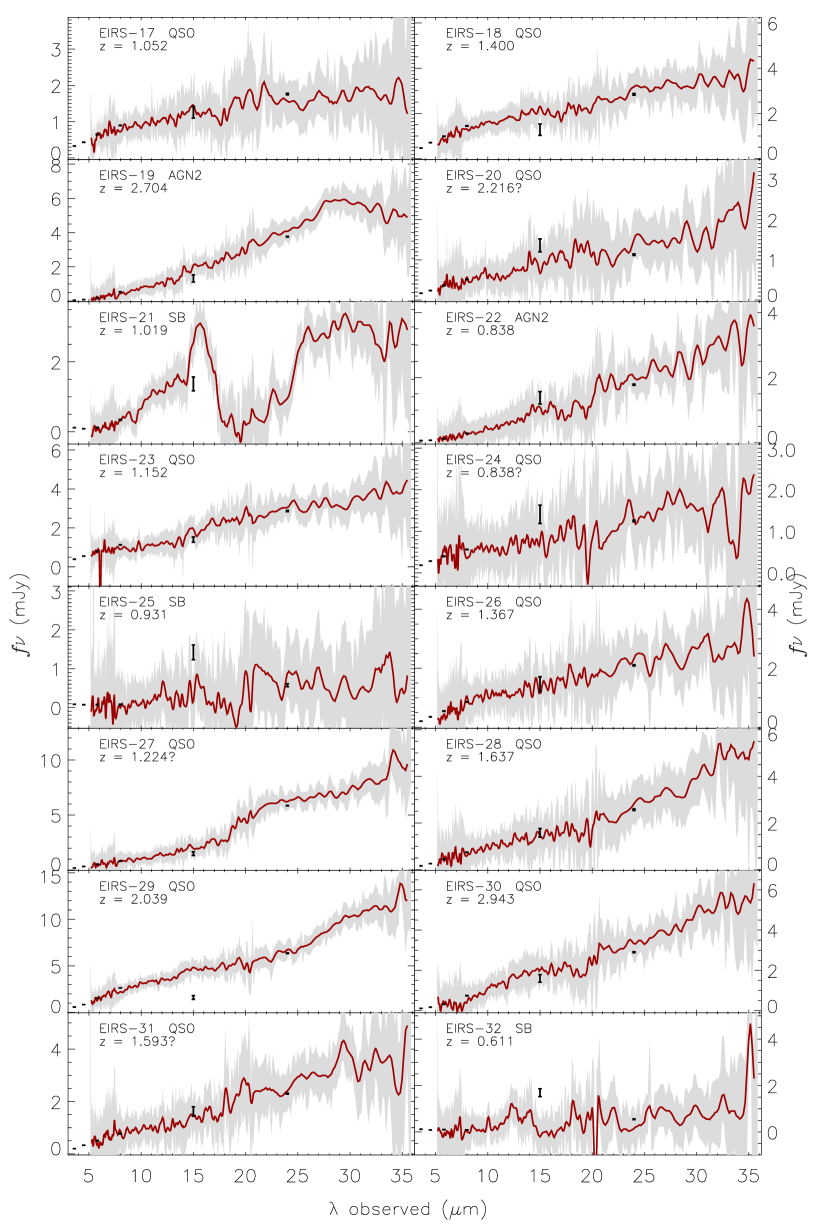
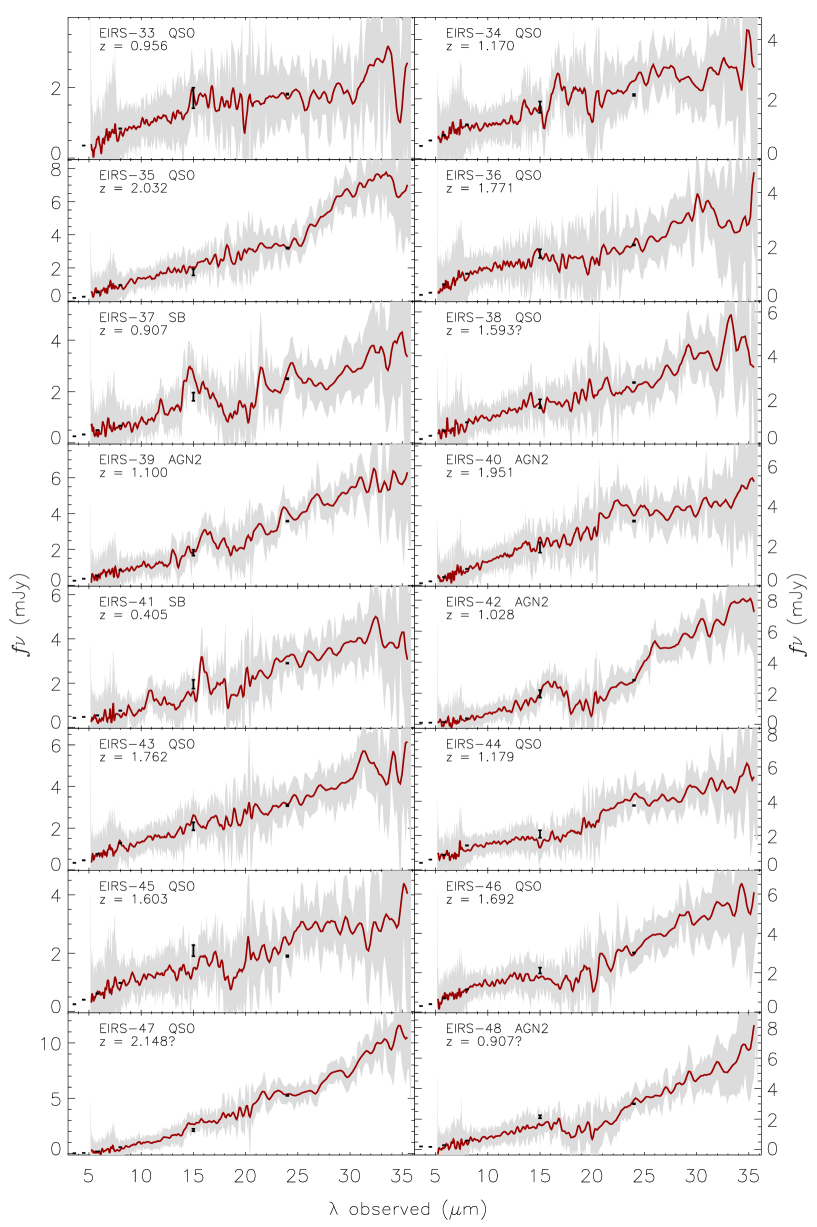
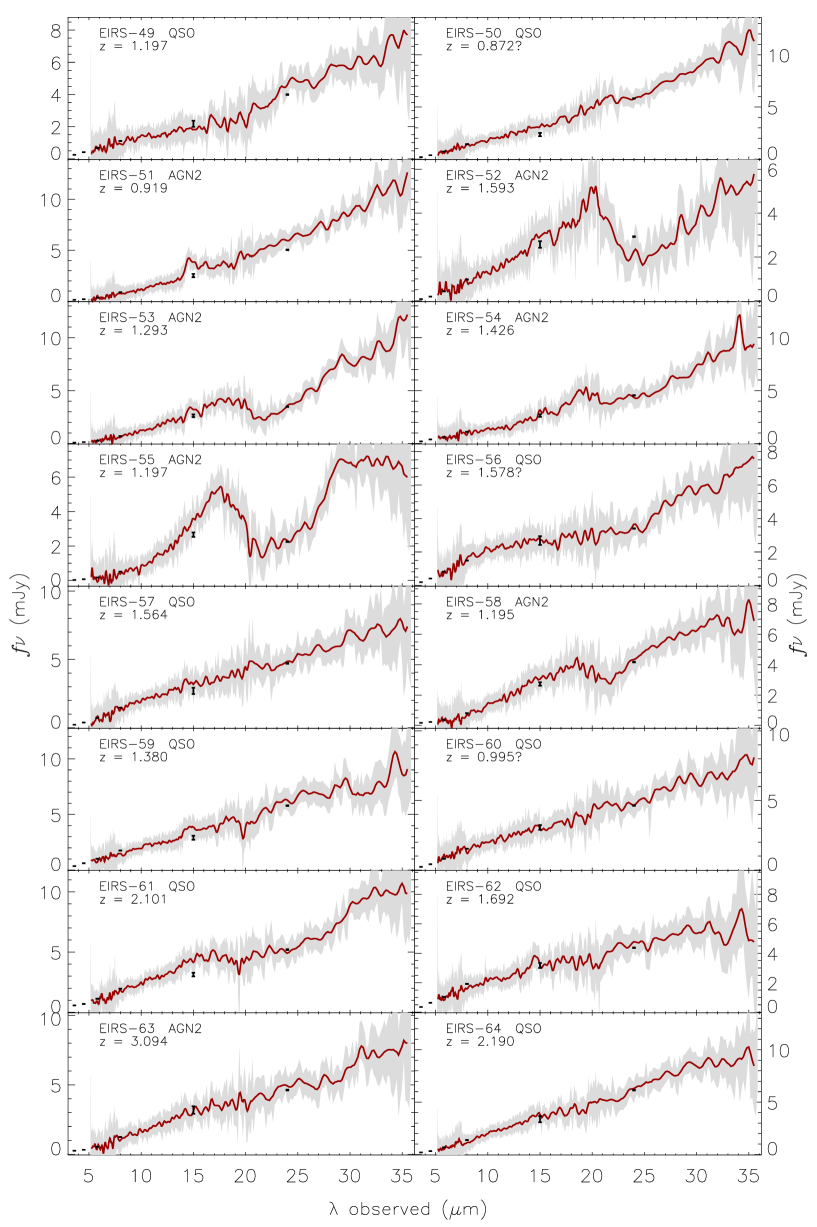
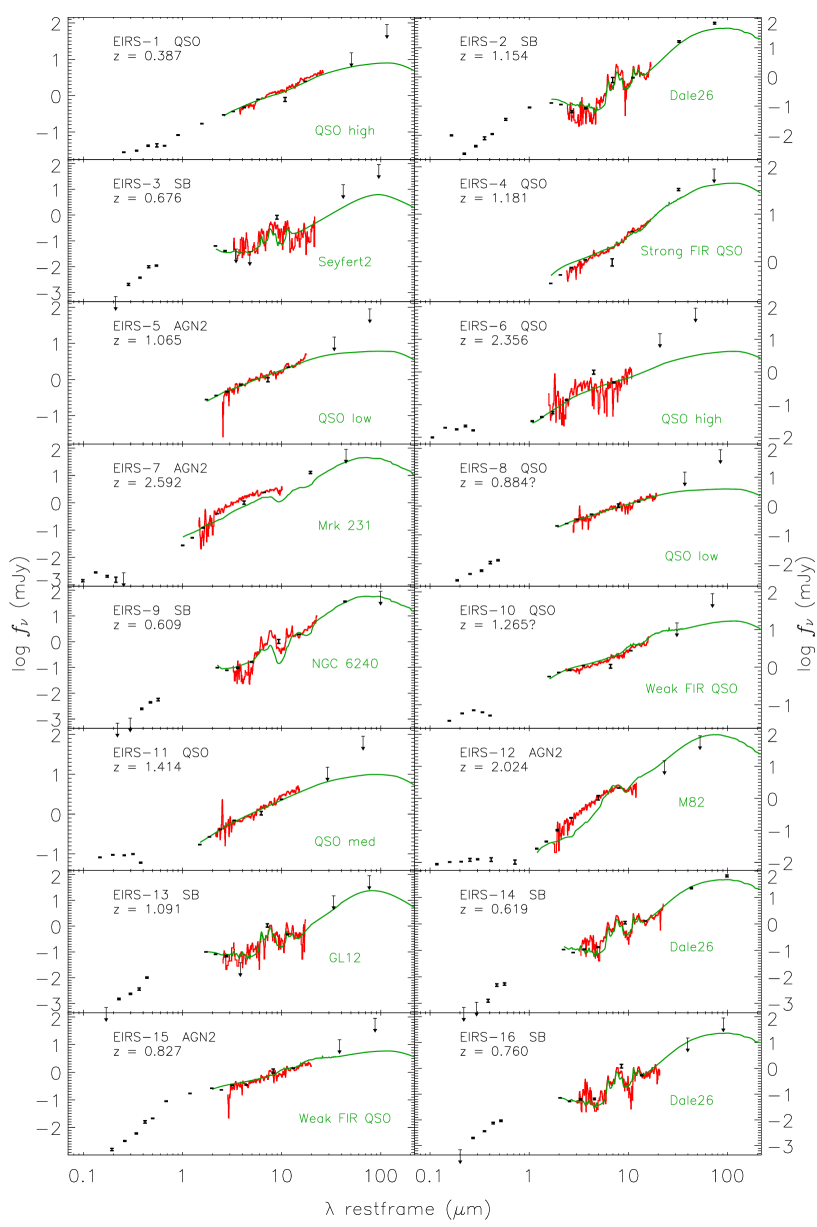
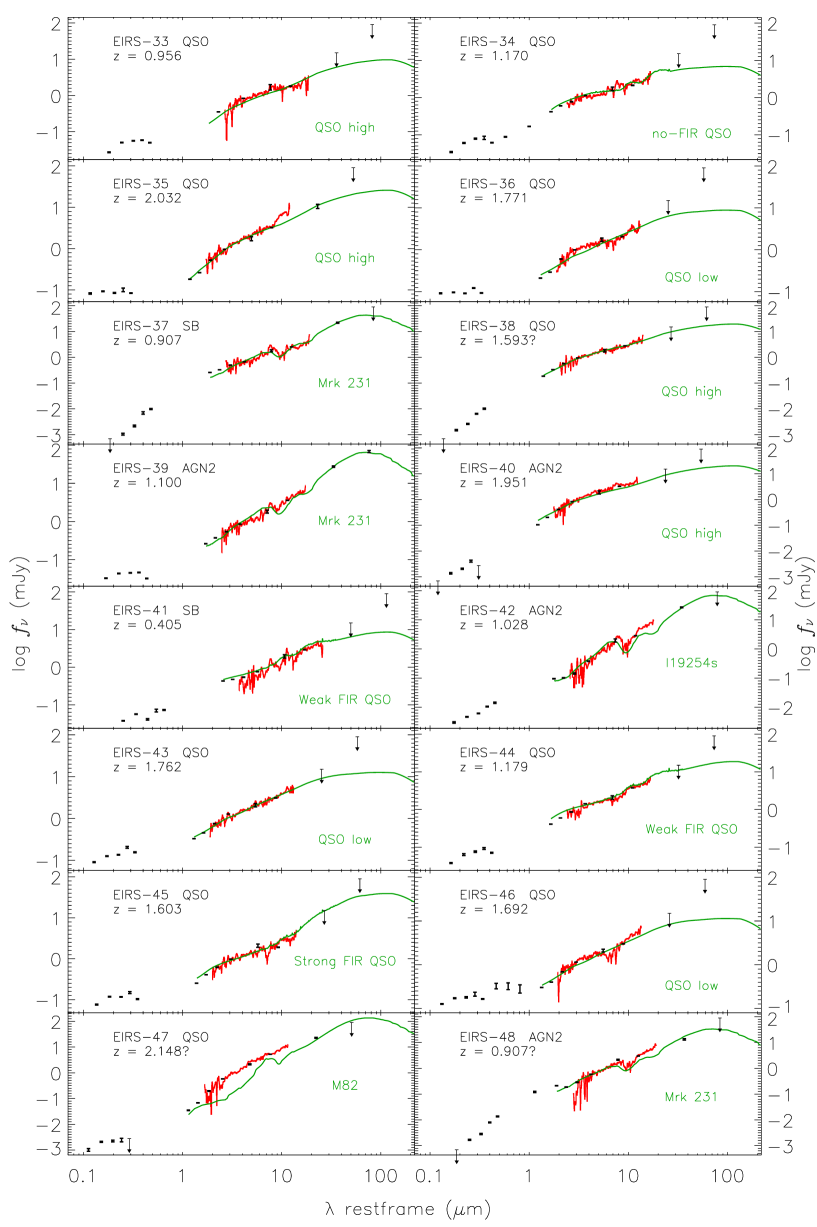
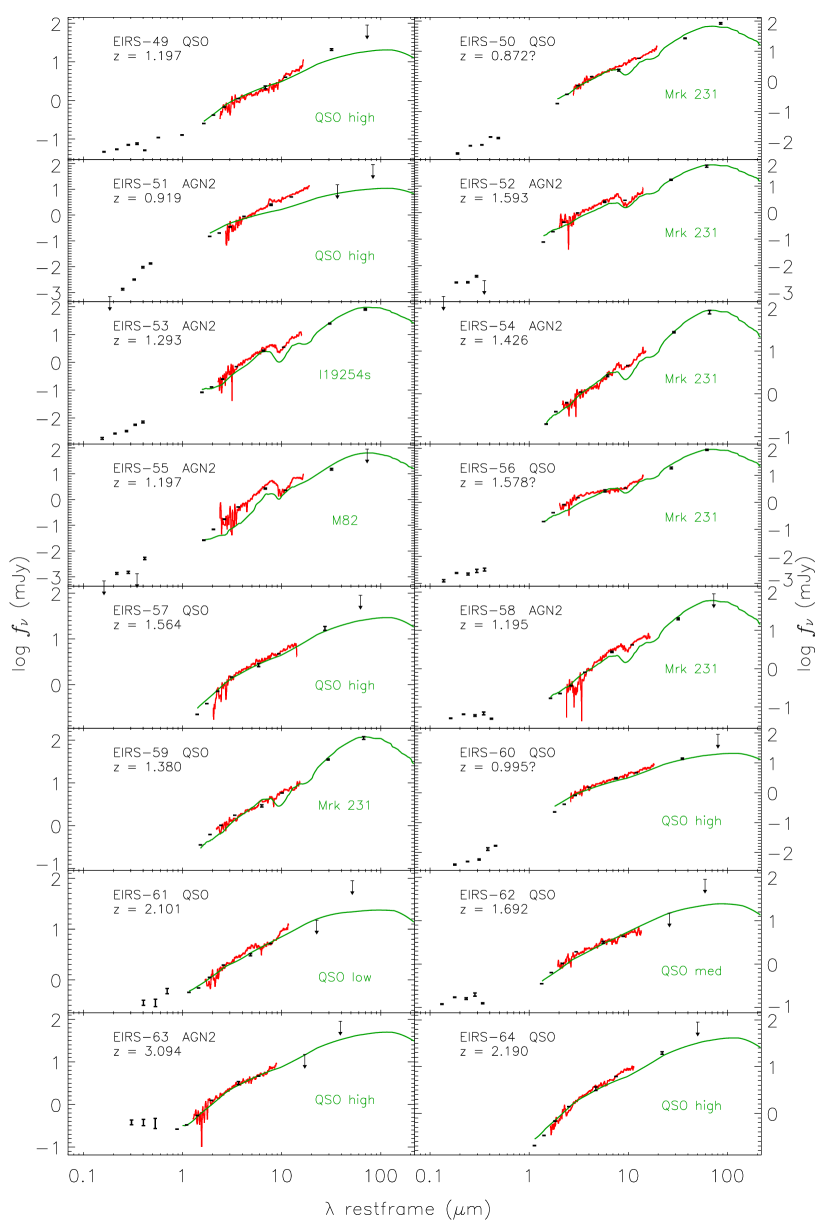
Wavelength calibration is performed by the IRS pipeline, and is accurate to 1/5 of the resolution element or / 0.001. Reduced and calibrated spectra for each of the 70 ELAIS-IRS sources are shown in Fig. 3.
4 Results
4.1 Redshifts from the IRS spectra
Spectroscopic redshifts () are available for roughly half of the sample, all of them optical QSOs except for one obscured AGN (EIRS-7). The rest of the sources were selected based on photometric redshifts () published in the ELAIS bandmerged catalog (Rowan-Robinson et al. 2004), which were later revised with the addition of IR photometry from SWIRE and UKIDSS after the ELAIS-IRS sample was selected (Rowan-Robinson et al. 2004, 2008), leading to revised 1 in some cases.
In many of the sources in the sample a redshift estimate can also be obtained from the IRS spectrum based on the PAH features, the silicate profile and the shape of the continuum SED (). To this aim, we have developed an algorithm that compares every spectrum with those in the Library and determines the best- estimate by a -minimization procedure (Hernán-Caballero et al. in prep.).
Reliable are obtained for 26 sources, while for another 28 a estimate is obtained, but it is uncertain due to poor SED fitting or multiple solutions. Most sources with reliable are galaxies, because their PAH-emission and/or silicate-absorption features produce a single sharp spike in (), while in QSOs a smoother spectrum allows for multiple, weaker solutions.
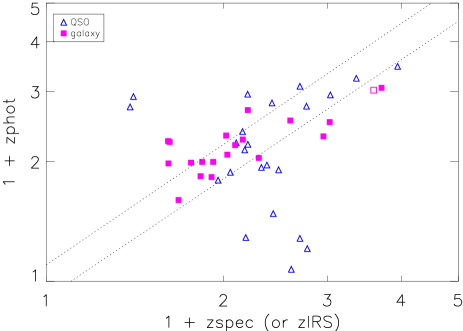
A comparison of optical- and MIR-spectroscopic versus photometric redshifts (Fig. 4) indicates that estimates have significant uncertainties, larger than those of the general ELAIS sample but similar to the uncertainty found in the subsample (Rowan-Robinson et al. 2008). Photometric redshifts are significantly less accurate in optical QSOs than in galaxies, due to aliasing problems, and may be also affected by variability issues, because the optical photometry from WFS was not obtained in the same epoch for all bands (Afonso-Luis et al. 2004).
Since estimates are stronger in galaxies and obscured AGN, while is more appropriate for QSOs, the combination of both techniques allows us to obtain reliable redshifts for 57 of 70 sources (Table 5). The remaining 13 rely on (EIRS-47, 60 and 65) or unreliable estimates (10 sources), and will be discarded in all redshift-sensitive analysis.
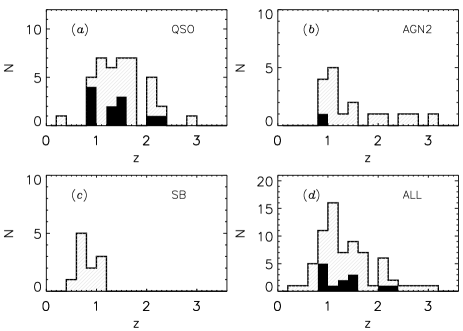
The redshift distribution of the ELAIS-IRS sample is shown in Fig. 5. Starburst galaxies concentrate around 1 because the selection at 15 µm favours sources with a strong 7.7-µm PAH feature at this redshift, while simultaneously prevents selection of higher-redshift sources since a typical starburst SED dwindles quickly for 6 µm. This behaviour is also observed in 24-µm selected starburst galaxies, which tend to concentrate around 1.7 (Yan et al. 2007; Farrah et al. 2008). The redshift distribution for QSOs is smoother, with most of them in the range, but the number of obscured AGN decreases sharply at 1.2 because of their red SED shortwards of 6 µm restframe.
4.2 Monochromatic fluxes and luminosities
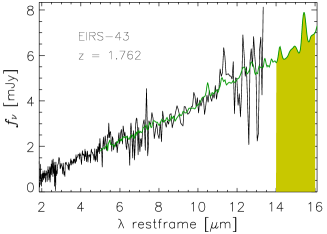
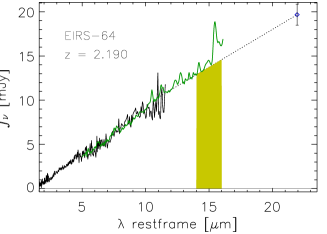
We calculate restframe monochromatic fluxes (fν) and luminosities Lν() at several wavelengths (2.2, 5.5, 7, 10 and 15 µm). The procedure used depends on the observed and restframe wavelength: for the 2.2 µm (restframe band) we interpolate the photometry in the IRAC bands (useful for sources at 0.6 2.65); for 5.5, 7 and 10 µm the spectrum is averaged over a narrow range (5.3–5.8, 6.6–7.4 and 9.5–10.5 µm respectively); while for the 15-µm luminosity the procedure is more complex: in sources it is obtained by averaging the 14–16 µm spectrum; in sources 15 µm restframe is outside the spectral range observed by IRS, but not too far, so the 15-µm luminosity is obtained by extrapolation of the model spectrum fitted in the spectral decomposition analysis (see §5.1). In sources the 15-µm luminosity is interpolated between the red end of the IRS spectrum and the MIPS70 photometric point (see Fig. 6 for an example of the 15-µm flux measurement in the last 2 cases). Table 6 summarizes the results obtained.
4.3 PAHs and Silicate features
In the literature we find two main methods for measuring the flux in the aromatic bands, which differ in the way the continuum and the PAH features are measured: a) the interpolation method, in which the continuum underlying the aromatic bands is estimated by linear (e.g. Rigopoulou et al. 1999) or spline (e.g. Vermeij et al. 2002; Spoon et al. 2007) interpolation between PAH-free regions of the spectrum, and the flux over the estimated continuum is attributed to the PAH feature; and b) the Lorentzian method, in which a Lorentzian or Drude profile is assumed for the PAH features (Laurent et al. 2000; Smith et al. 2007; Sajina et al. 2007).
We implemented the later method using a procedure in which a double power-law for the continuum and Lorentzian profiles for the PAH features are fitted simultaneously. The fitting algorithm is similar to that described in Smith et al. (2007) and Sajina et al. (2007) and is implemented as follows: the continuum emission is modeled by a linear combination of two power-laws with spectral indices , ranging from -5 to 5. The PAH features are modeled by Lorentzian profiles (,,) for the five main features (6.2, 7.7, 8.6, 11.3 and 12.7 µm), while the rest are ignored. The amplitude of the Lorentzian () must be non-negative, its width () is constrained between 0.5 and 2 times the typical value found in the literature222 = 0.2, 0.7, 0.4, 0.2 and 0.3 µm for the features centred at 6.2, 7.7, 8.6, 11.3 and 12.7 µm, respectively (Li & Draine 2001). and the central wavelength () can fluctuate up to 5 per cent from its expected value.
Extinction in the continuum is implemented assuming a screen model, with opacity () following the Galactic Centre extinction law (GC; Chiar & Tielens 2006), which has been widely used in other ULIRG samples with moderate or high silicate absorption (Förster Schreiber et al. 2003; Sajina et al. 2007; Polletta et al. 2008). Thus we fit the restframe spectra in the 5–15 µm range to the analytic expression:
| (1) |
We quantify the intensity of the silicate feature using the ‘silicate strength’, (e.g. Shi et al. 2006; Spoon et al. 2007; Maiolino et al. 2007), defined as:
| (2) |
where is the extinction-corrected continuum at 9.7 µm, and is the observed flux (averaged in a narrow interval to minimize the effects of the noise in the spectrum). is positive for sources with silicates in emission and negative in absorption.
In two high redshift sources (EIRS-30 and EIRS-63) could not be measured because 9.7 µm restframe is outside of the observed wavelength range, and in three starburst sources (EIRS-13, 25 and 32) the mean flux in the 9.5–9.9 µm range is negative in their noisy spectra. For these five sources we assume = -, where = (=9.7µm) is the estimated apparent optical depth at 9.7 µm from Eq. 1.
In most sources with silicates in emission, the silicate feature is wider and centred at longer wavelengths (10.5 µm) than it is found when the feature appears in absorption (see Siebenmorgen et al. 2005; Netzer et al. 2007 for tentative explanations), and the extra flux in the silicate feature tends to increase the continuum level in the fit. These effects lead to a systematical under estimation of the silicate strength in sources with silicates in emission. To compensate for this, we run a second fitting loop in sources with 0 and 0 in which the 9.5–11 µm range is excluded from the fit to avoid overestimation of the continuum, and is measured at 10.5 µm.
Table 7 summarizes the results obtained from the fitting. Fluxes of PAH features with S/N below are considered as non-detections and shown as upper limits.
4.4 Infrared Luminosity

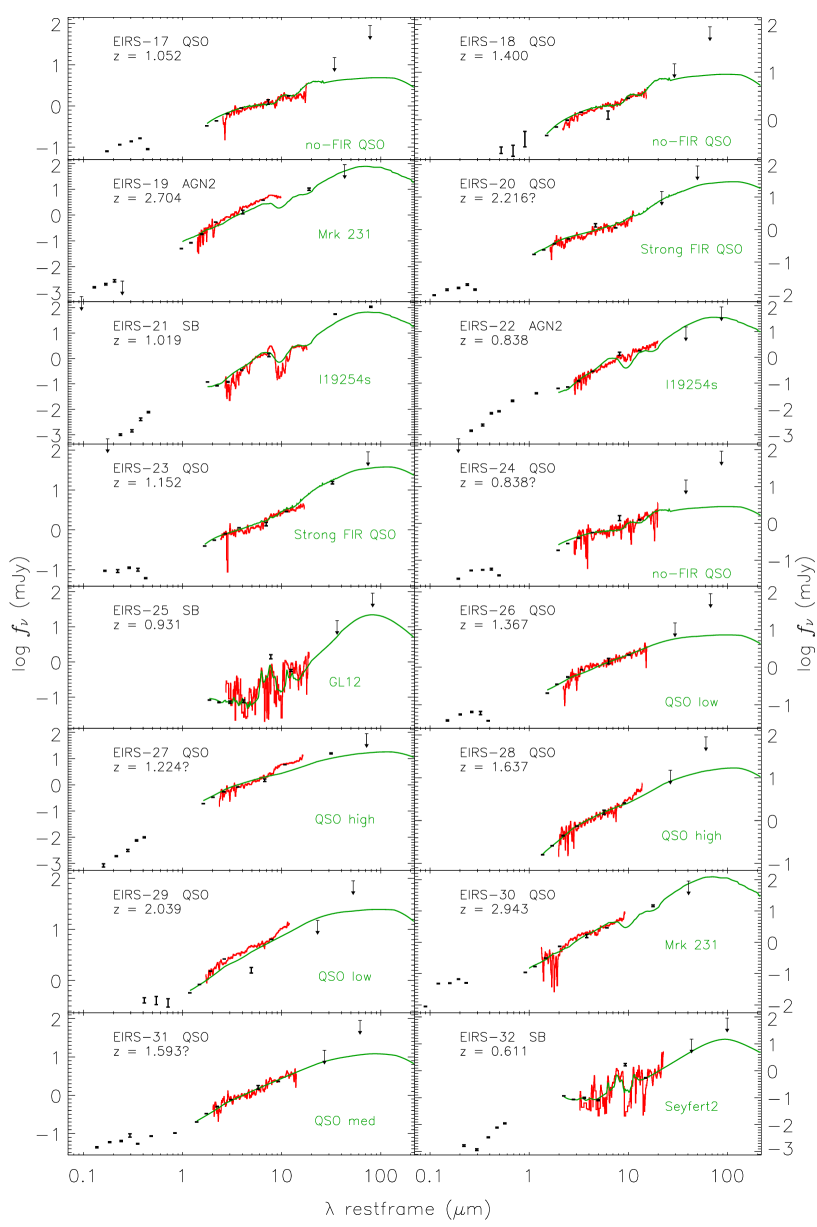
IR luminosity () is estimated by integrating in the 8–1000 µm range the template SED that best fits the MIR and far-infrared (FIR) photometry of each source. Template SEDs are selected from well-known theoretical and semi-empirical models in the literature, including four FIR models (torus, cirrus, M82 and Arp220) from Rowan-Robinson (2001); one early-type, seven late-types, three starbursts, six AGN and three SB+AGN composites from Polletta et al. (2007); a set of 64 theoretical galaxy SEDs (from quiescent to active) from Dale & Helou (2002); theoretical models of normal and starburst galaxies as a function of from Lagache et al. (2003, 2004); two empirical mean SEDs (radio-loud and radio-quiet) from a sample of 47 QSOs (Elvis et al. 1994); and three mean SEDs of optically-selected QSOs with strong, weak or no detection in the FIR (Netzer et al. 2007).
To reduce the number of template SEDs, the best-fitting template for each source in the Library was obtained by fitting its mid-to-far IR photometry (12–850 µm). Template SEDs that provided the best-fitting solution for less than two sources were discarded, and from very similar ones (e.g. Dale25 and Dale26 from Dale & Helou 2002) only one of them was selected. This reduced the sample of templates to 14 models (see Fig. 7): M82 and Arp220 from Rowan-Robinson (2001); GL12 from Lagache et al. (2003, 2004); Dale26 from Dale & Helou (2002); NGC6240, Mrk231, I19254s, Seyfert2, QSO-norm, QSO-high and QSO-low from Polletta et al. (2007); Strong FIR QSO, Weak FIR QSO and no-FIR QSO from (Netzer et al. 2007).
The best-fitting template for the ELAIS-IRS sources is determined by fitting the IRAC 3.6, 4.5, 5.8 and 8.0 µm, ISOCAM 15 µm, and MIPS 24, 70 and 160 µm photometry, as well as synthetic photometry in the 10–38 µm range obtained from the IRS spectrum. The synthetic filters have Gaussian transmission profiles centred at = 10.4, 12.4, 14.9, 17.9, 21.5, 25.8 and 30.9 µm, with FWHM = /6. The photometric bands shortwards of 3.6 µm are discarded because at 1 the flux in these bands is dominated by the stellar population in starbursts and obscured AGN, or by the accretion disc in QSOs, and is poorly correlated to the FIR emission from dust. Fitting results are shown in Fig. 8. The fits look reasonable for most sources, except for a significant under estimation of the MIR emission in some obscured AGN with a steep slope in the IRAC bands (e.g. EIRS-12, EIRS-47, EIRS-55). These sources fit an M82 template, probably because of the lack of a suitable obscured-AGN template.
If we assume that the FIR SED of the ELAIS-IRS sources is not very different to that
found in the sources in the Library, the uncertainties in for ELAIS-IRS can be estimated
using the following procedure:
1) calculate, for the sources in the Library, the best-fitting SED
and its associated IR luminosity (), using the IR photometry up to 15, 25 or 60 µm (which
roughly corresponds to 38, 70 and 160 µm for sources at 1.5, see Fig.
9).
2) compare to the ‘true’ IR luminosity () obtained by fitting all the FIR and sub-mm
photometry available.
The mean value of the logarithmic error in , log() = log() - log(), is around 0.05 when is estimated using all the available photometry up to 60 µm (equivalent to detection up to 160 µm in a ELAIS-IRS source), 0.15 when using the photometry up to 25 µm (equivalent to 70 µm detected ELAIS-IRS sources), and 0.23 if only photometry up to 15 µm is used (equivalent to ELAIS-IRS sources undetected at 70 and 160 µm).
In addition to these errors, uncertainty in the MIPS70 and MIPS160 photometry (up to 50 per cent in sources near the detection limit) and the bias introduced by the use of a discrete set of templates must also be taken into account. Considering these extra error sources, a factor 2–3 of uncertainty seems reasonable for most sources, significantly lower than the factor 5–10 estimated for extrapolations using only the MIPS24 photometry (Dale et al. 2005).
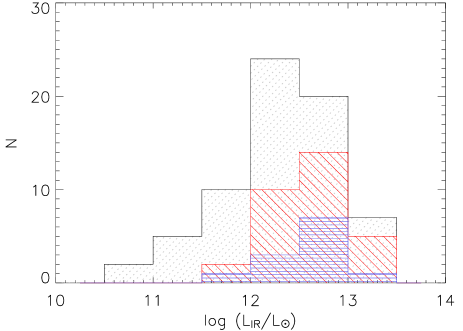
Most ELAIS-IRS sources have estimated IR luminosities in the ULIRG range, with some extreme cases in the Hyper-luminous range ( 1013 ) and 1/4 of the sample in that of LIRGs. Fig. 10 shows a histogram of the luminosity distribution of the sample. It is noteworthy that the sources detected at 70 and 160 µm concentrate in the higher luminosity tail of the distribution. This is an expected outcome given the relatively shallow depth of the MIPS70 and MIPS160 observations, and as a consequence, the most accurate estimations are obtained in the most luminous sources. Table 13 indicates the best-fitting SED and estimated IR luminosity for the ELAIS-IRS sources.
4.5 Star Formation Rates
For sources dominated by star formation, the most robust measurement of the star formation rate is obtained from the integrated 8–1000 µm IR luminosity (). For starburst galaxies, Kennicutt (1998) finds the relation:
| (3) |
Unfortunately, has big uncertainties for individual sources, and in sources with AGN activity there is not a straightforward method to isolate the starburst and AGN contributions to .
Many recent papers find a strong correlation between the luminosity of the PAH bands () and in starburst-dominated sources (e.g. Rigopoulou et al. 1999; Peeters et al. 2004; Brandl et al. 2006). The ratio / depends on the properties of the interstellar medium, and thus it varies with the luminosity of the sources: in normal spiral galaxies, with quiescent star formation, the mean ratio is highest (Smith et al. 2007), in starburst galaxies it is somewhat lower, and in local ULIRGs with massive star formation, it is lowest (Rigopoulou et al. 1999; Lu et al. 2003; Netzer et al. 2007). Nevertheless, the dependency of / with is small relative to the dispersion between sources of the same luminosity: Rigopoulou et al. (1999) find for the 7.7-µm PAH a mean value of 8.1 10-3 in starburst galaxies and 5.5 10-3 in starburst-dominated ULIRGs. Brandl et al. (2006) find that the 6.2-µm PAH luminosity relates to trough a power-law of index 1.13 in a sample spanning 2 orders of magnitude in .
Some authors use the 6.2-µm PAH because its measurement suffers little contamination from other MIR features (Peeters et al. 2004; Brandl et al. 2006) while others prefer the 7.7-µm PAH because it is the strongest PAH band (Rigopoulou et al. 1999; Lutz et al. 2003), or even use the combined flux of two or more features (e.g. Lu et al. 2003; Farrah et al. 2008).
The estimated luminosity in the PAH features depends strongly on the measurement procedure: Smith et al. (2007) find discrepancies of a factor 1.7 at 6.2 µm and 3.5 at 7.7 µm depending on whether the continuum is calculated by spectral decomposition into Lorentzian+continuum or it is interpolated between adjacent regions. This suggests that the discrepancies in the value of / found by different authors (see Table 12) are mainly due to systematics. In addition, the integrated infrared luminosity is not the same throughout the literature: some authors define in the range 1–1000 µm (e.g. Farrah et al. 2008), while others use only the FIR (42–122 µm, Lu et al. (2003); 40–500 µm, Peeters et al. (2004)).
Because of these issues, we obtain our own estimate of the average / in the starburst-dominated ELAIS-IRS sources before using the PAH luminosity to estimate SFR in the whole sample. The mean values of / found in the 7 starburst-dominated sources with no sign of significant AGN emission (EIRS-21, 25, 37 and 41 excluded) are: / = 0.012 0.007, /= 0.038 0.016 and /= 0.011 0.007.
The ratio found for the 7.7-µm PAH is similar to that obtained by Lutz et al. (2003) in a sample of starburst galaxies and Smith et al. (2007) in normal and starburst galaxies. It agrees with that found by Rigopoulou et al. (1999) in starburst galaxies and ULIRGs if we take into account the factor 3.5 decrement calculated by Smith et al. (2007) for fluxes measured by interpolation of the continuum using splines. For the 6.2-µm feature, our ratio is in agreement with those of Smith et al. (2007) and Farrah et al. (2008) but it is roughly double the ratio found by Spoon et al. (2004) in a sample of normal and starburst galaxies even after correction for the differences in the continuum estimation procedure.
By applying the calibration in Eq. 3, and assuming that the properties of the interstellar medium in which the PAH emission originates are not significantly altered by the AGN activity, the SFR in the whole sample can be calculated as:
| (4) | |||||
| (5) | |||||
| (6) |
For sources in which two or three PAH features are detected with S/N 2 we estimate SFR from their combined luminosity, while if only one or no PAH features are detected, we average estimates from individual upper limits.
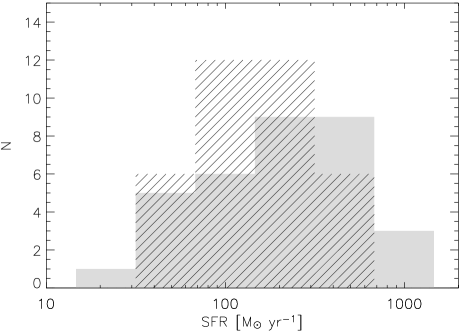
Table 13 shows the estimated SFR for ELAIS-IRS sources. They range from 10 to 1000 . The stated uncertainties account for the uncertainty in the PAH flux only; if we consider the uncertainty in the IR luminosity and the dispersion in / of the starburst-dominated sources, a more realistic estimate would be a factor 2 uncertainty in SFR.
Figure 11 shows de distribution of SFR in the ELAIS-IRS sample. Most estimates are in the range 150–600 , but if we consider upper limits for sources with undetected PAHs, which account for more than half of the AGN population, many of them have probably SFR 100 .
5 Source Classification
5.1 Spectral Decomposition
A powerful tool for diagnostics is decomposition into several spectral components, which can provide considerable insight to the physics of the sources (e.g. Tran et al. 2001).
MIR emission from active galaxies arises mostly from HII regions, Photodissociation Regions (PDRs) and AGN (Laurent et al. 2000), so we have used a simple model comprising the superposition of three spectral templates (AGN, PDR and HII) obscured by a screen of dust.
The spectral decomposition is performed by fitting the 5–15 µm restframe range of the spectrum to a parametrized of the form:
| (7) |
where the free parameters (, , , ) are calculated using a Levenberg–Marquardt -minimization algorithm, and must have non-negative values.
To keep the number of free parameters low, a single optical depth value is applied to the three spectral components, but for most sources the solution is almost identical when two optical depth values (one for the AGN and other for the PDR and HII components) are used, with an increased value due to the extra free parameter.
() is obtained from the GC extinction law, while is represented by the IRS spectrum of the Seyfert 1 galaxy NGC 3515 (Buchanan et al. 2006), by the ISOCAM spectrum of a PDR in the reflection nebula NGC 7023 (Cesarsky et al. 1996a) and by the ISOCAM spectrum of M17 in the vicinity of OB stars (Cesarsky et al. 1996b).
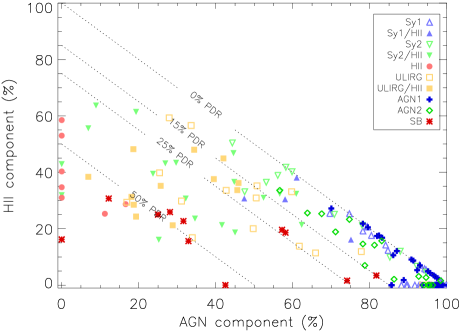
We quantify the contribution of each spectral component to the MIR spectrum as the ratio of its integrated luminosity to total luminosity in the 5–15 µm restframe range, , and for the AGN, HII and PDR components. Figure 12 shows the distribution of spectral components for the Library and the ELAIS-IRS sample.
5.2 Diagnostic Diagrams
A number of MIR diagnostic diagrams have been proposed to determine the nature of infrared galaxies (e.g. Genzel et al. 1998; Lutz et al. 1998; Rigopoulou et al. 1999; Laurent et al. 2000; Peeters et al. 2004; Spoon et al. 2007). They rely mainly on the strength of the PAH features to infer the dominant energy source (AGN or starburst), and on the slope of the continuum and sign of the silicate strength (emission or absorption) to distinguish obscured and unobscured sources.
There is a strong correlation between the optical and MIR spectrum of AGN: type 2 AGN usually show a red MIR spectrum, and the silicate feature in absorption, while most type 1 AGN show a bluer MIR spectrum, with stronger NIR emission, and the silicate feature absent or in emission. Nevertheless, the match between populations is not perfect, and many mismatches (most notably, type 1 AGN with silicates in absorption and type 2 with silicates in emission) have been reported (e.g. Buchanan et al. 2006; Brand et al. 2007; Hao et al. 2007).
A silicate emission feature in type 2 AGN can be reproduced by a low-Si, low-tau smooth torus model (Fritz et al. 2006), or by silicate emission being produced in an extended region, such as a dusty Narrow Line Region (Sturm et al. 2005). Silicate absorption in type 1 AGN can be observed if the Broad Line Region is partially obscured, maybe by dust in the galaxy. A very remarkable case is Mrk 231 (Lonsdale et al. 2003b; Weedman et al. 2005), which shows a broad emission-line spectrum reddened with 2 in the optical (Boksenberg et al. 1977; Lipari et al. 1994), and strong silicate absorption in the MIR (Spoon et al. 2002).
Since making assumptions on the Seyfert type of AGN based on their IR properties alone would be misleading, we will refrain from doing that and will instead classify the AGN as obscured or unobscured in the IR.
Using some well known diagnostics along with some others from our own we separate the MIR spectra of the ELAIS-IRS sources into three main categories: starburst-dominated (SB), unobscured AGN-dominated (AGN1) and obscured AGN-dominated (AGN2). Every diagnostic criterion is calibrated using the known nature of sources in the low-redshift Library, including Seyfert type for AGN, and a final MIR classification is obtained as the most repeated result among all criteria.
Measurements on the ELAIS-IRS and Library spectra were obtained using exactly the same procedures, to prevent distortions in the diagnostic diagrams due to systematics. Limits between populations in the diagnostic diagrams are determined based solely on the Library spectra, and are fine-tuned to minimize the number of misclassifications within the Library.
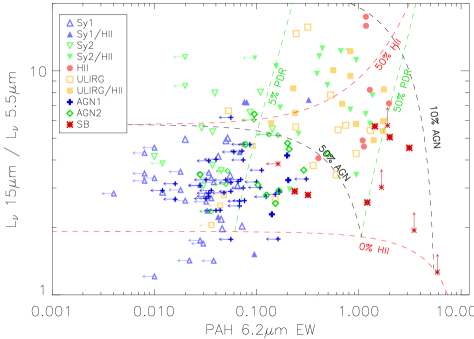
Figure 13 shows an adaptation of three well known diagnostic diagrams by Laurent et al. (2000), Peeters et al. (2004) and Spoon et al. (2007), as well as a new one that we propose.
In the diagnostic diagram of Laurent et al. (2000) the 6.2-µm PAH equivalent width () easily separates starburst-dominated sources from the AGN-dominated ones, while the ratio between 15 and 5.5 µm restframe spectral luminosities (/) distinguishes sources dominated by hot dust from an unobscured AGN (low /) or cold dust by an obscured AGN or starburst (high /). The value of that best separates starburst-dominated and AGN-dominated sources from the Library is 0.2, while in / we find too much overlap between populations and prefer to drop it as a diagnostics criterion.
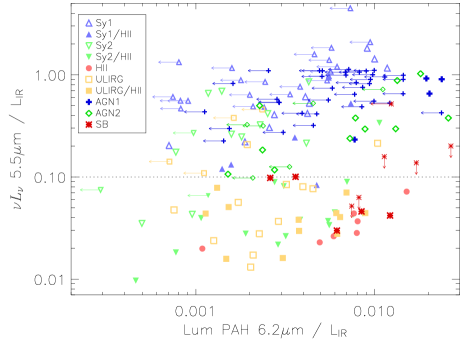
In the diagram from Peeters et al. (2004) the ratio between and is related to the relative amount of hot and cold dust in the galaxy, being higher for unobscured AGN and lower for starbursts and deeply embedded sources. The 6.2-µm PAH luminosity () to ratio depends on the relative contribution of unobscured star formation to the IR luminosity, and is higher for unobscured starbursts or AGN+SB composite sources, while lower for the dust enshrouded ones. Most ELAIS-IRS sources have too high upper limits on this ratio to be meaningful, so we also drop this parameter as diagnostic criterion.
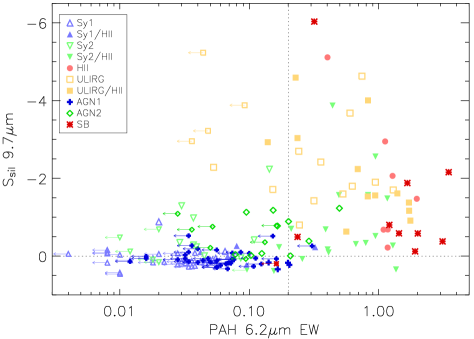
The diagram from Spoon et al. (2007) is based on and the strength of the silicate feature. Galaxies populate their diagram along two branches: one horizontal branch from AGN-dominated to starburst-dominated spectra, and one diagonal branch from highly obscured nuclei to starburst-dominated spectra. They hypothesize that the separation into two branches reflects two different configurations of the obscuring dust: clumpy in the horizontal and non-clumpy (homogeneous shell) in the diagonal. In our adaptation of the Spoon diagram (Fig. 13, bottom left) it is noteworthy the lack of ELAIS-IRS sources in the high-extinction, weak-PAH region of the diagram, where many local ULIRGs are located. The silicate strength is used to separate obscured and unobscured AGN, but most sources have a small absolute value of , and its uncertainty can lead to a wrong classification in some cases.
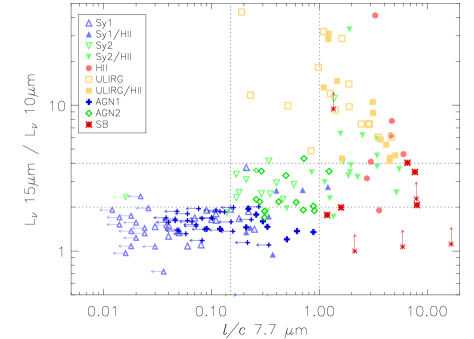
We propose a new diagnostic diagram, inspired by the one from Spoon but optimized for low S/N sources (Fig. 13, bottom right). In our modified Spoon diagram, is replaced by the line (peak) to continuum ratio of the 7.7-µm PAH feature (/). This parameter has been extensively used to distinguish starbursts from AGN (e.g. Lutz et al. 1998; Rigopoulou et al. 1999; Weedman et al. 2006), and works better in low S/N sources because the 7.7-µm feature is stronger than the one at 6.2 µm. The silicate strength is replaced by a more straight-forward and model-independent measurement: the ratio between and the spectral luminosity averaged in a narrow band centred at 10 µm restframe (). This ratio separates type 1 and 2 AGN from the Library more efficiently than does, because it combines the two main distinctive factors: absorption/emission in the silicate band and slope of the continuum. In addition, it is less sensitive than to noise in the spectrum. Its main drawback is that 15 µm restframe is unobservable by IRS for sources at 1.5, but it can be interpolated using the MIPS70 photometry as we showed in §4.2. Type 1 and 2 AGN from the Library are better separated in this diagram than in the original from Spoon in both axes, and only the type 1 AGN with a strong starburst contribution overlap significantly with the type 2 ones. This overlap is produced by a higher slope of the continuum and depleted silicate feature in type 1 AGN with a starburst component.
Finally, the spectral decomposition diagram in Fig. 12 can also be used for diagnostics, since starburst-dominated sources locate near the left border, because of strong PDR and/or HII component, while AGN-dominated sources concentrate in the lower-right corner.
From the five diagnostic diagrams described, we extract six criteria to classify infrared galaxies (Table 8).
Criteria C1 to C4 distinguish AGN from starbursts based on the strength of the PAH features and MIR-to-FIR luminosity ratios, while C5 and C6 rely on the silicate feature to separate obscured and unobscured AGN.
The final class assigned to each source is the most repeated one among the six criteria. This combination of multiple criteria allows for a more robust classification than that obtained using a single diagnostic diagram, since it is less likely to be altered by statistical uncertainties. This is most significant in the lower S/N spectra, and also in obscured AGN, which some criteria often classify as unobscured AGN or starbursts because typical values for obscured AGN lay in a narrow range between those of starbursts and unobscured AGN.
For sources in the Library, the IR classification is consistent with the optical class for more than 90 per cent of them (see Table 9). An analysis of the results from individual criteria shows that mismatches are caused by two main factors: a) strong star formation in type 1 AGN, which leads to classification as obscured AGN via high values of / and /. b) silicate emission in type 2 AGN, which confuses the two criteria based on the silicate feature.
In the ELAIS-IRS sample we expect a somewhat higher mismatch rate because the lower S/N of the spectra increases the likelyhood of incorrect classification by some of the individual criteria. In all diagnostic diagrams the ELAIS-IRS sources are plotted with symbols representing their final IR class, so that mismatches between individual criteria and the final classification can be easily recognized.
Based on the criteria presented above, 41 sources are classified as unobscured AGN (AGN1), and 17 are obscured AGN (AGN2). The remaining 11 sources are classified as starbursts (SB), including a few sources with strong continuum (EIRS-21, EIRS-25, EIRS-37), which could host an obscured AGN, and an AGN1+SB composite (EIRS-41). Table 10 shows the classification from individual criteria as well as the final IR class for the whole ELAIS-IRS sample.
A comparison of the optical versus IR classification for ELAIS-IRS sources (Table 11) shows 12 mismatches: seven are optical galaxies with unreliable redshifts classified in the IR as unobscured AGN because of weak or absent PAH features or presence of silicate emission. Some of them (EIRS-8, EIRS-38) present a rather flat slope in the IRAC bands, indicating low extinction, while others (EIRS-47, EIRS-50, EIRS-56, EIRS-60) show a steep slope and FIR emission, suggesting a high level of extinction. The other galaxy, EIRS-27, shows a very strong silicate emission feature, similar to that found in the Seyfert 2 galaxy IRAS F01475-0740 (Buchanan et al. 2006; Hao et al. 2007). The remaining five sources are optical QSOs with reliable spectroscopic redshifts, which are classified as obscured AGN in the IR due to intense PAH emission and a small but negative value of . In these sources, the dust in star-forming regions may have depleted the silicate emission feature in the AGN spectrum enough to make it appear in absorption. In three of these sources (EIRS-5, EIRS-39 and EIRS-54) the criterion in / predicts AGN1 while 0. A fourth source, EIRS-63, is at = 3.094 and the silicate feature moves out of the range observed by IRS, so the IR diagnostic is inconclusive. Finally, EIRS-58 has a deep silicate feature and is classified as AGN2 by both / and , but its optical SED is blue and shows a power-law spectrum in the optical and UV up to the Lyman break.
The best fitting IR SED and MIR classification are consistent with each other for most sources. All sources classified as unobscured AGN fit best to one of the seven QSO SEDs, except EIRS-47, which depends on a photometric redshift and is obscured in the optical. Obscured AGN also select mainly QSO templates (most significantly Mrk 231, a reddened type-1 QSO with strong silicate absorption), but 1/3 of them fit best M82 or I19254s (an obscured AGN + starburst composite). Starburst sources favour pure-starburst (GL12 and Dale26) or composite (Seyfert 2, I19254s and NGC 6240) templates, except for two sources with strong MIR continuum (EIRS-41 and EIRS-37) which fit best QSO templates.
5.3 Averaged spectra
We have used the spectral classification in §5.2 to calculate average spectra of each population, which have better S/N than the spectra of individual sources. In the average spectrum we only include sources with reliable redshift estimations, to prevent as much as possible the dilution of fine details by the dispersion in .
To calculate the averaged spectrum, individual spectra are shifted to the rest-frame, normalized at 7 µm and interpolated in a common array of wavelengths uniformly distributed in log(). For each value of we discard the highest and lowest value of and the remaining ones are combined using a weighted average.
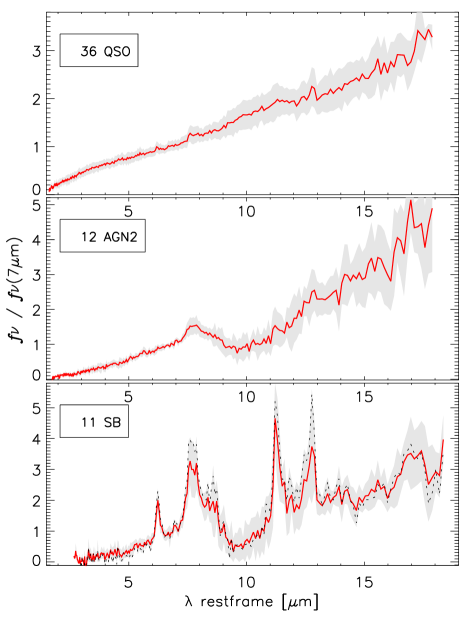
Figure 14 shows the averaged spectra for starbursts, optical QSOs and obscured AGN (optical galaxies classified as AGN in the IR) in the sample.
The quasar spectrum can be approximated by a power-law of index = -1 in the range 4–16 µm (Fig. 15), which is slightly steeper than the index found in the averaged spectrum of a sample of local QSOs (Netzer et al. 2007). In addition, the silicate feature appears in emission in the averaged spectrum, but with a very low profile. These findings suggest the ELAIS-IRS quasars could be more obscured than average, nearby optically selected QSOs. See §6.4 for a discussion on the connection between the silicate feature and the MIR spectral index.
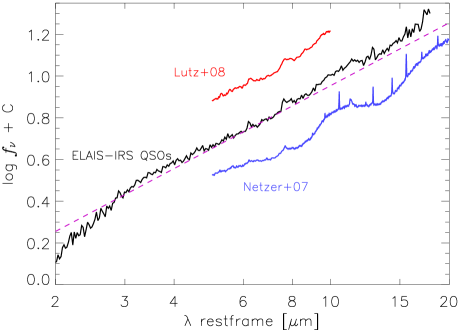
The slope of the spectrum increases shortwards of 3 µm towards the 1 µm minimum of the SED, as has also been observed in other optically selected quasar samples (e.g. Hatziminaoglou et al. 2005). This is interpreted within the torus model as thermal emission from graphite grains at temperatures up to 1500 K.
In the averaged spectrum there are tentative detections of some ionic lines of neon, [Ne ii] 12.81 µm and [Ne iii] 15.56 µm, but since they have low/medium excitation potentials, their emission can also be excited by star formation. The PAH features are weak but detected, with 0.015 and 0.05. In §6.3 we estimate mean PAH luminosities and star formation rates for these sources.
The averaged spectrum of the obscured AGN shows a steep slope at 8 µm ( = -2) but it flattens longwards of the silicate trough at 10 µm (Fig. 16). The depth of the silicate feature is relatively small ( 0.7), as has been observed in many Seyfert 2 and QSO2s (e.g. Sturm et al. 2005; Weedman et al. 2006; Deo et al. 2007; Hao et al. 2007). However, the requirement of optical spectroscopic or photometric redshift for selection may have reduced the average silicate absorption by biasing the sample against the most obscured sources.
Emission lines for ionic species are very weak or absent, with the significant exception of [Ne ii] 12.81 µm. The 7.7-µm PAH feature seems rather strong, but it could be magnified by a peak in the underlying continuum emission at 8 µm caused by the onset of the silicate absorption feature. The other PAH features are weak, with only the one at 11.3 µm clearly detected. The 6.2 µm feature is missing even if it is detected in many individual spectra. This may be caused by the cancellation effect produced by strong 6.0 µm absorption bands by water ice or hydrocarbons in some sources (Sajina et al. 2007).
In the averaged spectrum of the starburst-dominated galaxies we find, in addition to the usual PAH bands at 6.2, 7.7, 8.6, 11.3 and 12.7 µm, a few additional, fainter bands, centred at 5.2, 5.8, 14.2 and 17.0 µm, which are also common in higher S/N spectra of low redshift galaxies. The 3.3-µm band, relatively strong in ISO SWS spectra of many local ULIRGs, seems absent; but the IRS spectra of the ELAIS-IRS starbursts are very noisy in this range.
Some ionic lines frequently observed in local starbursts also appear in the average spectrum, most significantly [Ar ii] 6.99 µm, [Ar iii] 8.99 µm, [Ne ii] 12.81 µm (which overlaps with the 12.7-µm PAH) and [Ne iii] 15.56 µm. It is noteworthy the absence of rotational transitions of the H2 molecule, with the possible exception of S(3) 9.67 µm. The weak continuum shortwards of 6 µm indicates that the relative contribution of AGN or obscured star formation is small. If the four starburst-dominated sources with suspected or known AGN contribution are discarded, the average spectrum of the remaining starburst sources (EIRS-2, 3, 9, 13, 14, 16 and 32) has a lower continuum emission at 6 µm, but remains unchanged at longer wavelengths while the PAH features get significantly boosted.
6 Discussion
6.1 Comparison with other high- samples
Before Spitzer, the spectroscopic study of ULIRGs was restricted to a few local sources due to the low sensitivity of previous instruments; but in the last four years, thanks to the unprecedented sensitivity of IRS, it has been possible to obtain MIR spectra for several hundred ULIRGs up to 3.
Most of these sources were selected from wide-area MIR surveys, and are usually heavily obscured, because only sources with high MIR-to-optical flux ratios were selected for observation with IRS (e.g. Houck et al. 2005; Yan et al. 2007). In some cases, additional constraints were imposed to favour the selection of starburst or AGN-dominated sources (Weedman et al. 2006; Farrah et al. 2008; Polletta et al. 2008).
By contrast, the selection criteria for the ELAIS-IRS sample put no constraints on the MIR-to-optical flux ratio of the sources, but required optical spectroscopic or photometric redshifts. This introduced a bias that is not easy to quantify, but certainly favored sources with little or no obscuration at moderate redshifts. In addition, selection at 15 µm instead of 24 µm also favours lower-redshift sources, because the PAH features and the steep slope shortwards of 6 µm in obscured AGN enter the selection band at lower . In this sense, the ELAIS-IRS sample can be seen as complementary to other higher- spectroscopic samples.
The selection criteria leave their fingerprint in a colour-colour diagram like the one in Fig. 17. Indeed, the ratio between the flux density at 24 µm and an optical band, used as selection criterion for all samples except ELAIS-IRS, determines to a large extent the nature of the sources selected. The most extreme cases (/ 2000) dominate the samples from Houck and Polletta. These sources are strongly obscured in the optical and show steep IR spectra, with strong silicate absorption, and tend to be at high redshift ( 1.7).
Ratios of 300 / 2000 correspond to the obscured AGN in ELAIS-IRS, the starburst galaxies from Farrah and the composite sources from Yan. The distribution of goes down to 0.5 with a gap around 1.4 because of the silicate feature entering the MIPS24 band.
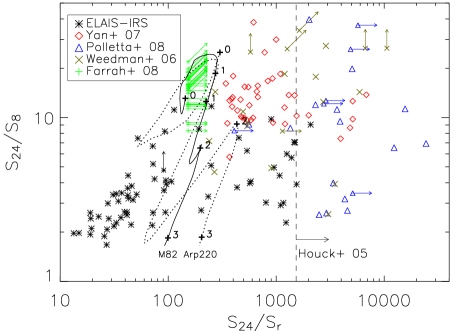
At / 100 we find the ELAIS-IRS starburst at 0.6 1, which are bluer in / and / than starburst sources from Farrah or Yan; and at / 100 we find most of the ELAIS-IRS quasars, which are slightly or not obscured, spanning a wide range in redshift up to 3.
Note that excluding the ELAIS-IRS sources, the rest are significantly redder in / than would be M82 or Arp220 at the same redshift, indicating that these sources are more obscured than many local ULIRGs, and probably represent only the most extreme cases of the ULIRG population at high redshift.
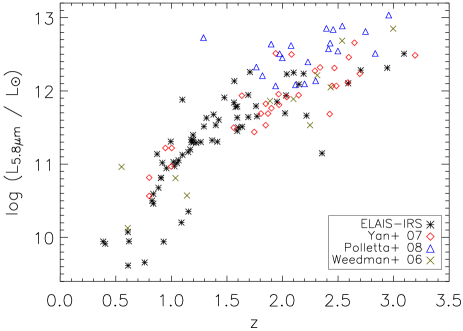
Since most of the sources in these samples have 1 mJy, their distribution in the – plane covers a very narrow strip (Fig. 18), indicating that, except for a few sources with ultra-deep IRS spectra down to 0.1 mJy (Teplitz et al. 2007), only the most luminous sources at each redshift have been probed so far. A deeper insight into the dominant population of LIRGs at 1 will be possible once the next generation of MIR spectrographs onboard JWST and SPICA become available.
6.2 Starburst ULIRGs at 1
We have classified 10 of the 27 optically-faint ELAIS-IRS sources as starburst-dominated galaxies, and there is also an optical quasar (EIRS-41) dominated by starburst features in the MIR.
The selection criteria required 1 for galaxies, but estimates are in the 0.6–1.2 range for all starburst galaxies, with = 0.8. This is caused by uncertainties in and by the selection at 15 µm, which favours sources with strong PAHs at 1, while at higher redshift requires a strong continuum at 6µm, favoring AGN.
In spite of this bias towards PAH-strong sources at 1, only 1/3 of the ELAIS-IRS sources are starbursts, while 2/3 are AGN. Most significantly, if we exclude the QSOs only half of the galaxies in this range are starbursts, the rest being obscured AGN. This indicates that the population of 15-µm sources at 1 is comprised mostly of AGN for 1 mJy. The starbursts could still dominate the highly obscured galaxy population, since they are excluded from the ELAIS-IRS sample because they are too faint in the optical; but this is probably not the case, because the AGN also dominate the 24-µm counts of sources brighter than 1 mJy at 1.7 (Weedman et al. 2005).
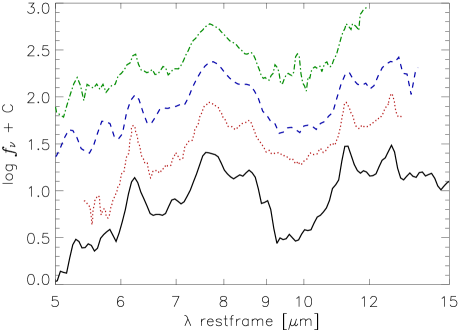
The averaged spectrum of the ELAIS-IRS starbursts is similar to that found in higher redshift samples selected at 24 µm (Fig. 19). Differences between them in the depth of the silicate feature and PAH equivalent width can be interpreted as a combination of a ‘pure starburst’ (HII+PDR) spectrum and an AGN spectrum in variable proportions. In this case, starburst galaxies from Farrah and ELAIS-IRS would be the less contaminated by AGN dust continuum, while in those of Yan the continuum would dominate de MIR spectrum.
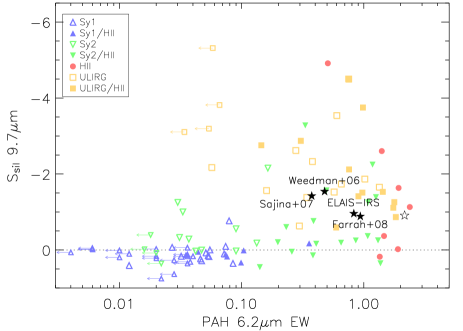
The Spoon diagram for averaged spectra (Fig. 20) indicates that the composite spectrum of the ELAIS-IRS starbursts is in the range of local starburst ULIRGs. If the starburst-dominated sources with strong continuum are removed from the composite, the resulting increases threefold and resembles that of lower luminosity local starbursts.
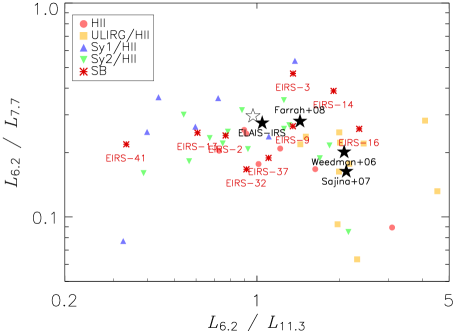
In the diagram of PAH luminosity ratios (Fig. 21) the composite spectrum of ELAIS-IRS starburst-dominated sources also situates among local starburst galaxies, with / substantially higher than in typical starburst-dominated ULIRGs. This ratio is related to the ionization state of the PAH molecules (Draine & Li 2001; Rapacioli et al. 2005; Brandl et al. 2006; Galliano et al. 2008), a high ratio indicating abundance of cationic species, while a low ratio indicates most PAH carriers are neutral.
/ shows anticorrelation with the extinction (Rigopoulou et al. 1999), and is usually lower in local ULIRGs than in less luminous starburst galaxies (Lutz et al. 1998). In the ELAIS-IRS average, it is somewhat higher than in most local ULIRGs, suggesting a lower extinction level.
Lower ionization an extinction values than in local ULIRGs have also been found in higher- starburst-dominated galaxies (Farrah et al. 2008), and could indicate that the star formation is extended over larger regions relative to their local counterparts, or, alternatively, that their gas-to-dust ratio is higher.
6.3 Star formation in the AGN
It has been stated that the SFR of Seyfert galaxies correlates with the luminosity of the AGN (e.g. Schweitzer et al. 2006; Shi et al. 2007; Maiolino et al. 2007) and that the SFR is systematically higher in type 2 Seyferts relative to type 1 (Maiolino et al. 1995; Buchanan et al. 2006).
For higher luminosity AGN there are contradictory results: most local QSOs are hosted by elliptical galaxies, with very little star formation (Dunlop et al. 2003), and only 30 per cent of them show signs of interaction with other galaxies (Guyon et al. 2006). Measurements in the [O ii] 3727- line indicate that the SFR is very low (a few ) in optically selected QSOs (Ho 2005; Kim et al. 2006). In the IR, Schweitzer et al. (2006) find in IRS spectra of Palomar-Green QSOs that more than 30 per cent of the IR luminosity is due to star formation, but a later work from Shi et al. (2007) reduces the starburst contribution to 25 per cent of the flux at 70 and 160 µm –which translates to 10 per cent of if we assume templates like Dale26 for the starburst and QSO-norm for the AGN component– for a larger sample of optically selected QSOs. Using MIR and FIR photometry from SWIRE, Hatziminaoglou et al. (2008) estimate relative AGN and SB contributions to in a sample of 70 SDSS QSOs with 70-µm detection, and find the AGN contribution varies from 100 to 20 per cent of .
Optically selected QSOs, however, represent less than half of the total QSO population (Martínez-Sansigre et al. 2005; Stern et al. 2005), the remaining being obscured quasars (QSO2s) that show up in the infrared (Cutri et al. 2001; Lacy et al. 2004) radio (White et al. 2003) or X-rays (Norman et al. 2002).
Conversely to what is found in local QSOs, HST images of a sample of QSO2s show signs of perturbations and intense star formation in the host galaxy (Lacy et al. 2007), and in the MIR there are signs of recent or ongoing star formation (Lacy et al. 2005; Yan et al. 2007).
At higher redshift there are samples of sub-mm selected QSOs with very high SFR (1000–3000 ; Bertoldi et al. 2003; Beelen et al. 2006; Lutz et al. 2007, 2008), but most of the high- QSOs are undetected in the sub-mm range (70 per cent; Omont et al. 2003), and the observed trend indicates that the starburst-to-AGN luminosity ratio decreases with increasing AGN luminosity (Haas et al. 2003; Maiolino et al. 2007), thus suggesting that the observed correlation betwen star formation and AGN luminosity saturates at higher luminosities.
The same pattern seems to apply to QSO2s: Sturm et al. (2006) find that IRS spectra of X-ray selected obscured AGN show very weak or no PAH bands, and Polletta et al. (2008) estimate that the star formation contributes 20 per cent to the bolometric luminosity of a sample of obscured AGN with 1012 .
The ELAIS-IRS AGN comprise a very heterogeneous population, since it covers a wide range of PAH equivalent width and SFR. In some of the sources, the estimated starburst-induced IR luminosity () calculated from the PAH luminosity is higher than the total IR luminosity () obtained from the SED fitting. Since it is unlikely that / be lower for these sources (indeed, PAH destruction by the AGN would lead to lower ratios) the most likely interpretation is that the SED of these AGN has a cold dust component which is not accounted for in the SED fitting –effectively underestimating – because of lack of deep enough photometry in the FIR. Incidentally, MIPS70 and MIPS160 upper limits for many ELAIS-IRS AGN cannot rule out a significant cold dust component in the FIR (see fits in Fig. 8).
The PAH features are comparatively very weak in most ELAIS-IRS AGN, and in many of them (35 sources, mostly unobscured AGN) only a loose upper limit of the (PAH-derived) is available. To get a tighter estimate of its typical value, we measure the strength of the PAH features in the averaged spectra of QSO and AGN2 sources. Assuming that the equivalent width of a PAH feature in the averaged spectrum () is similar to those of the individual sources, we can roughly estimate the typical PAH luminosity of the sources by multiplying times the luminosity of the continuum underlying the PAH feature. Since individual spectra are normalized at 7 µm before averaging them, the mean PAH luminosity may be overestimated because the lower luminosity sources tend to show higher PAH equivalent widths. To minimize this bias, we split the QSO and AGN2 populations in two subsamples of high and low luminosity sources, based on their restframe 5.5-µm luminosity. We place the limit between populations at = 4 1011 to include the same number of sources in both subsamples. In the lower luminosity population the 6.2, 7.7 and 11.3 µm PAH features are detected in both QSO and AGN2 averages, while in the higher luminosity ones they all but disappear (Fig. 22).
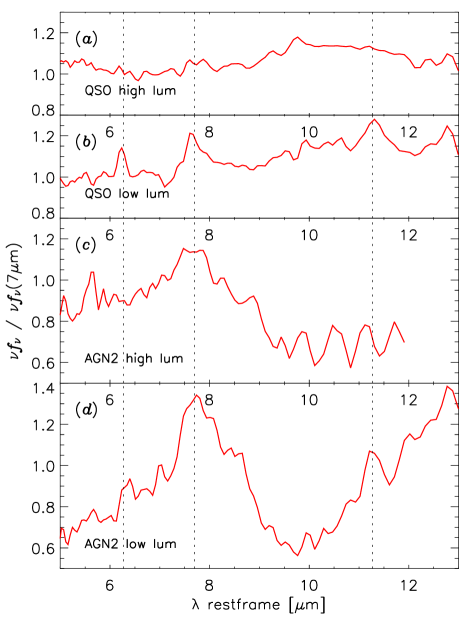
Table 15 shows the estimated average PAH luminosity and associated and SFR for the averaged spectra of the ELAIS-IRS AGN. In the lower luminosity QSOs the average PAH luminosity corresponds to an IR luminosity in the LIRG range, and accounts for 20–25 per cent of as estimated from SED fitting, similar to the mean value found by Shi et al. (2007) in a sample of PG, 2MASS and 3CR QSOs at lower redshift. The obscured AGN in the same luminosity range have PAH luminosities almost 3 times higher at 6.2 and 7.7µm (which suggests star formation is responsible for about half of in these sources), but they are similar to that of QSOs at 11.3 µm. Estimated SFR is 50 for the lower-luminosity QSOs and 100 for the obscured AGN.
In the higher-luminosity AGN the PAH features are too weak to meassure them even in the composite spectrum. Their equivalent width is at least 3 times lower in the high luminosity QSO composite than in the lower luminosity one, and the resulting upper limits in constraint the mean SFR to 100 . The implied IR luminosity from star formation accounts for 10 per cent of the estimated . The high-luminosity obscured-AGN composite contains only five sources and has lower S/N than the others. Upper limits for the 6.2 and 7.7 µm features suggest SFR 300 , and a starburst contribution to of 10–15 per cent at most.
To better constrain the amount of FIR emission in the QSOs, we have performed stacking analysis of the 70 and 160 µm photometry. Fluxes for individual sources are estimated from the counts in the pixel containing the coordinates of the source, and their uncertainties are obtained from a fit to the histogram of (finite-valued) pixel values in the image. A mean sky level is computed for the image and subtracted from the source flux in order to ensure that the mean value for random positions in the image is zero. The mean flux and dispersion for the population are estimated from the individual measurements (, ) as the maximum-likelihood solution for the distribution:
| (8) |
A detailed description of the whole stacking procedure can be found in Serjeant & Hatziminaoglou (2009). The mean fluxes obtained at 70 and 160 µm are shown in Table 14. If we assume the FIR SED is dominated by a starburst component with an M82-like SED, the average IR luminosity needed to reproduce the observed mean fluxes is 1012 for the sources, and 51012 for those at 1.5. Similar results are obtained if we assume an Arp220 SED instead of M82 for the starburst component.
The extrapolated from the observed PAH luminosity is a factor 3 lower in the QSOs (and a factor lower in the QSOs) than that obtained from the stacking analysis of 70 and 160 µm photometry, suggesting that the average PAH-to-FIR luminosity ratio is significantly lower than in starburst galaxies. A likely interpretation is reduced PAH emission in star-forming regions in the vicinity of an AGN due to destruction of the PAH carriers by X-ray and far-UV photons from the AGN (Voit 1992; Le Floc’h et al. 2001; Siebenmorgen et al. 2004).
Incidentally, the factor 3 reduction in and in the PAH-to-FIR luminosity ratio between low- and high-luminosity QSOs suggests higher depletion rates of the PAH carriers in the most luminous AGN. Alternatively, it could indicate a saturation of the correlation between the luminosities of the starburst and AGN, as found in other samples of QSOs (Shi et al. 2007) and higher-luminosity, high- QSOs (Maiolino et al. 2007; Lutz et al. 2008), but results from the stacking analysis suggest the FIR luminosity roughly scales with AGN luminosity.
Estimated average luminosity of the 6.2 and 7.7 µm PAH features in the low-luminosity composites are about 2–3 times higher in the obscured AGN than in the QSOs. This could indicate higher SFR in the obscured AGN, or, alternatively, higher abundance of PAH carriers due to absorption by the obscuring material of the energetic photons from the AGN. However, the statistical significance of this result is not strong due to the small number of sources contributing to the obscured AGN average, and requires validation in larger samples.
A selection bias favouring obscured sources with strong PAH emission could also be responsible for the increased PAH luminosity, but we have not found any likely bias able to increase PAH luminosity in obscured AGN but not in QSOs. In example, the PAH features increase the observed flux in the selection band at 1, where we find roughly half of the obscured AGN, but these sources are bright enough to be selected even without contribution from PAH emission to the 15-µm flux. Since the PAH features help to find a redshift estimate in many sources, this could play a role in the observed asymmetry, because most redshifts for AGN2 sources rely on the IRS spectrum, while most QSOs have optical spectroscopic redshifts. But in AGN2 sources a reliable redshift estimate can usually be obtained from the (absorption) silicate feature alone, and indeed all sources with unreliable redshifts are classified as AGN1. In addition, a lower accuracy in redshifts obtained from the silicate feature relative to those from optical spectroscopy imply that PAH features may be blurred in the AGN2 composite, leading to an underestimation of their real strength.
Another possible interpretation could be lower MIR luminosity in obscured AGN than in QSOs of the same intrinsic luminosity, as is expected if the putative torus is optically thick in the MIR; but this is not supported by measurements of the luminosity ratio between X-rays and MIR (Lutz et al. 2004; Sturm et al. 2006; Polletta et al. 2007; Horst et al. 2008).
6.4 Implications for the dust distribution
A strong difference in SFR between optical type 1 and type 2 AGN has been observed in a sample of QSOs and QSO2s from the SDSS (Kim et al. 2006). Using estimates from the [O ii] 3727 Å line, they find a SFR an order of magnitude higher in type 2 sources, and this is probably a lower limit, due to higher extinction in the optical.
Such a large difference between type 1 and 2 sources can hardly be explained within the AGN unification scheme, and might indicate instead that the AGN classification into type 1 or type 2 does not depend exclusively on the orientation of an AGN torus. Recent papers suggest that a fraction of the obscuration in type 2 AGN occurs in the host galaxy: Lacy et al. (2007) find a correlation between silicate extinction and orientation of the plane of the galaxy, while Polletta et al. (2008) suggest that foreground extinction by cold dust is required to reproduce both the silicate feature and NIR continuum for almost half of the sources in a sample of MIR selected obscured AGN.
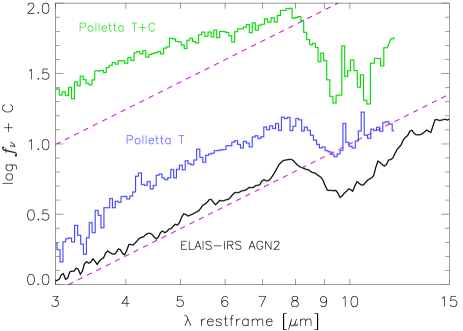
If we assume that the extinction law for dust in the torus is similar to that found in local ULIRGs and in the Galactic Centre, it reaches a minimum in opacity at 7 µm and increases towards shorter wavelengths; thus the optical depth is higher in the NIR than at 7 µm. If the silicate absorption feature originates in the torus, a decrease in the viewing angle of the torus should produce a deeper silicate feature and weaker and steeper NIR continuum peaking at longer wavelengths (e.g. Efstathiou & Rowan-Robinson 1995; Fritz et al. 2006). By contrast, if the silicate feature originates in the host galaxy, a deep silicate profile could be observed in conjunction with an intense and flat NIR spectrum (Polletta et al. 2008).
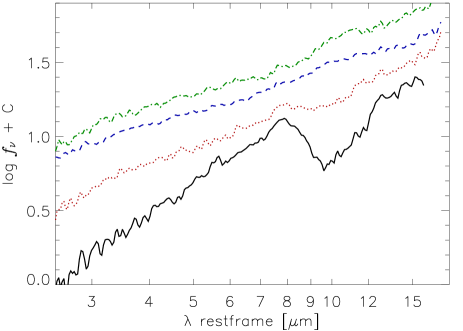
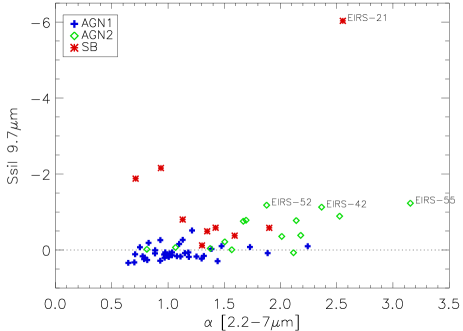
Fig. 16 compares the average spectrum of ELAIS-IRS AGN2 sources with the average of sources that fit the torus model (T) or torus+cold absorber (T+C) from Polletta et al. (2008). The NIR slope and strength of the silicate feature are better reproduced by the T model.
Figure 23 shows the averaged spectrum of the ELAIS-IRS AGN separated in four groups attending to their measure of . In sources with 0 (mostly QSOs) the NIR slope is small and independent of , but in sources with 0 the NIR slope is substantially higher, particularly for the subsample with strongest silicate absorption. This confirms the existence of a correlation between NIR slope and silicate absorption, as expected if the obscuration originates mainly in the AGN torus.
To search for sources that depart from this trend, we calculated the spectral index of the continuum between 2.2 and 7 µm restframe for individual spectra (Fig. 24). Most QSOs yield 1.5, while most AGN2 show 1.5. There is a clear trend, even if the dispersion is high, towards a simultaneous increase of and in AGN, but not in starbursts. Note that EIRS-21, which is suspected of harboring an obscured AGN due to its strong MIR continuum, departs strongly from the AGN population. This suggests that the observed extinction is better reproduced by a screen of cold dust instead of a thick AGN torus. Incidentally, it is undetected down to erg cm-1 s-1 in [2-10] keV band images from XMM (I. Valtchanov priv. comm.), so the presence of a dust enshrouded AGN is questionable.
The only AGN2 source that separates slightly from the general trend is EIRS-52, but its spectrum is still better described by the torus model; therefore, a dusty torus is favored as the source of the obscuration in the ELAIS-IRS AGN.
The lack of T+C sources in ELAIS-IRS is probably caused by the selection criteria, which prevent selection of highly obscured AGN as those from Polletta et al. (2008).
7 Conclusions
We have analyzed the IR properties of a sample of 70 MIR selected LIRGs and ULIRGs at 0.4 3.2. The MIR selection favours starburst-dominated sources in redshift intervals in which the strongest PAH bands overlap with the passband of the selection filter, namely, 1 at 15 µm and 1.8 at 24 µm. For the AGN-dominated sources, the redshift distribution is wider because their IR SED has smoother features. The relatively shallow depth of the optical data in the ELAIS-IRS sample and the requirement of optical photometric or spectroscopic redshifts for source candidates favours the selection of weakly obscured sources, contrarily to other MIR high- ULIRG samples where highly obscured sources are preferred, and thus turns the ELAIS-IRS sample into a valuable complement for the study of the high- ULIRG population.
Redshift estimates for the ELAIS-IRS sources from their MIR spectrum are reliable for obscured or star-forming sources, and unreliable in many unobscured AGN. This behaviour is the opposite to that obtained through optical spectroscopy, and thus guarantees that reliable redshift estimates can be obtained by one or other means for most IR sources.
A combination of MIR diagnostic criteria efficiently separates starbursts, obscured and unobscured AGN, with a good correlation to the optical classification. The selection criteria of the ELAIS-IRS sample favour the selection of starburst-dominated sources at 0.6 1.2, yet most galaxies selected in this range are AGN-dominated. This suggests that the population of 1 mJy sources at 1 is dominated by AGN.
The averaged spectrum of ELAIS-IRS starbursts is similar to that of local ULIRGs, but the observed depth of the silicate feature, strength of PAH features and PAH flux ratios are more alike to those found in lower-luminosity starburst galaxies. This behaviour has already been observed in higher-redshift starburst samples and could be related to star formation extending over larger regions or a higher gas-to-dust ratio in the galaxy.
The correlation between MIR and FIR SEDs allows the estimation of IR luminosities from the MIR spectrum with a factor 3 uncertainty. If MIPS70 and/or MIPS160 photometry is available the uncertainty reduces further and becomes dominated by uncertainties in the photometry and in the SED models.
The mean SFR in ELAIS-IRS QSOs estimated from PAH luminosity is 50-100 , but its implied FIR emission is 3–10 times lower than that obtained from stacking analysis in the 70 and 160 µm bands, thus suggesting the PAH emission in substantially depleted in most QSOs.
A lower PAH-to-continuum luminosity ratio is found in the most luminous QSOs relative to lower-luminosity ones, suggesting a saturation of the correlation between star formation and AGN activity found in other samples of lower-luminosity sources or, alternatively, higher depletion rates of the PAH carriers in the galaxies hosting the most powerful AGN.
In the obscured AGN, the mean SFR is 2–3 times higher than in QSOs of the same luminosity. If confirmed in larger samples, this could indicate a connection between dust obscuration and star formation in the host galaxy. However, the observed correlation between silicate absorption and the slope of the NIR-to-MIR continuum is consistent with the hypothesis of the obscuring dust being located in a dusty torus.
Acknowledgements
This work is based on observations made with the Spitzer Space Telescope, which is operated by the Jet Propulsion Laboratory, Caltech under NASA contract 1407.
This work was supported in part by the Spanish Plan Nacional del Espacio (Grant ESP2007-65812-C02-02) and the UK PPARC.
We wish to thank the anonymous referee for their very useful comments and suggestions.
References
- Afonso-Luis et al. (2004) Afonso-Luis A. et al., 2004, MNRAS, 354, 961
- Alexander et al. (2001) Alexander D. M. et al., 2001, ApJ, 554, 18
- Armus et al. (2007) Armus L. et al., 2007, ApJ, 656, 148
- Basilakos et al. (2002) Basilakos S. et al., 2002, MNRAS, 331, 417
- Beelen et al. (2006) Beelen A., Cox P., Benford D. J., Dowell C. D., Kovacs A., Bertoldi F., Omont A., Carilli C. L., 2006, ApJ, 642, 694
- Berta et al. (2006) Berta S. et al., 2006, A&A, 451, 881
- Berta et al. (2007) Berta S. et al., 2007, A&A, 467, 565
- Bertoldi et al. (2003) Bertoldi F., Carilli C. L., Cox P., Fan X., Strauss M. A., Beelen A., Omont A., Zylka R., 2003, A&A, 406, 55
- Boksenberg et al. (1977) Boksenberg A., Carswell R. F., Allen D., Fosbury R., Penston M., Sargent W., 1977, MNRAS, 178, 451.
- Borne et al. (1999) Borne K. D. et al., 1999, APSS, 266, 137
- Brand et al. (2007) Brand K. et al., 2007, ApJ, 663, 204
- Brandl et al. (2006) Brandl, B. R. et al., 2006, ApJ, 653, 1129
- Bridge et al. (2007) Bridge, C. R. et al., 2007, ApJ, 659, 931
- Buchanan et al. (2006) Buchanan C., Gallimore J., O’Dea C., Baum S., Axon D., Robinson A., Elitzur M., Elvis M., 2006, AJ, 132, 401
- Cesarsky et al. (1996a) Cesarsky D., Lequeux J., Abergel A.,Perault M., Palazzi E., Madden S., Tran D., 1996a, A&A, 315, 305
- Cesarsky et al. (1996b) Cesarsky D. et al., 1996b, A&A, 315, L309
- Chapman et al. (2003) Chapman S. C., Windhorst R., Odewahn S., Yan H., Conselice C., 2003b, ApJ, 599, 92
- Chiar & Tielens (2006) Chiar J. E., Tielens A. G. G. M., 2006, ApJ, 637, 774
- Clements et al. (1996) Clements D. L., Sutherland W. J., McMahon R. G., Saunders W., 1996, MNRAS, 279, 477
- Crampton et al. (1992) Crampton D., Cowley A. P., Hartwick F. D. A., Ko P. W., 1992, AJ, 104, 1706
- Cutri et al. (2001) Cutri R. M., Nelson B. O., Kirkpatrick J. D., Huchra J. D., Smith P. J. 2001, in ASP Conf. Ser. 232, The New Era of Wide Field Astronomy, ed. R. G. Clowes, A. J. Adamson and G. E. Bromage (San Francisco: ASP), 78
- Dale & Helou (2002) Dale D., Helou, G., 2002, ApJ, 576, 159
- Dale et al. (2005) Dale D. et al., 2005, ApJ, 633, 857
- Deo et al. (2007) Deo R. P., Crenshaw D. M., Kraemer S. B., Dietrich M., Elitzur M., Teplitz H., Turner T. J., 2007, ApJ, 617, 124
- Draine & Li (2001) Draine B. T., Li A., 2001, ApJ, 551, 807
- Dunlop et al. (2003) Dunlop J. S., McLure R. J., Kukula M. J., Baum S. A., O’Dea C. P., Hughes D. H., 2003, MNRAS, 340, 1095
- Elvis et al. (1994) Elvis M. et al., 1994, ApJS, 95, 1
- Efstathiou & Rowan-Robinson (1995) Efstathiou A., Rowan-Robinson M., 1995, MNRAS, 273, 649
- Farrah et al. (2001) Farrah D. et al., 2001, MNRAS, 326, 1333
- Farrah et al. (2002) Farrah D., Verma A., Oliver S., Rowan-Robinson M., McMahon R., 2002, MNRAS, 329, 605
- Farrah et al. (2003) Farrah D. et al., 2003, MNRAS, 343, 585
- Farrah et al. (2007) Farrah D. et al., 2007, ApJ, 667, 149
- Farrah et al. (2008) Farrah D. et al., 2008, ApJ, 677, 957
- Förster Schreiber et al. (2003) Förster Schreiber N. M., Sauvage M., Charmandaris V., Laurent O., Gallais P., Mirabel I. F., Vigroux L., 2003, A&A, 399, 833
- Fritz et al. (2006) Fritz J., Franceschini A., Hatziminaoglou E. 2006, MNRAS, 366, 767
- Galliano et al. (2008) Galliano F., Madden S. C., Tielens A. G. G. M., Peeters E., Jones A. P., 2008, ApJ, 679, 310
- Gallimore & Keel (1993) Gallimore J. F., Keel, W. C., 1993, AJ, 106, 1337
- Genzel et al. (1998) Genzel R. et al., 1998, ApJ, 498, 579
- González-Solares et al. (2005) González-Solares E. A. et al., 2005, MNRAS, 358, 333
- Guyon et al. (2006) Guyon O., Sanders D. B., Stockton A. N., 2006, ApJS, 166, 89
- Haas et al. (2003) Haas M. et al., 2003, A&A, 402, 87
- Hao et al. (2007) Hao L., Weedman D. W., Spoon H. W. W., Marshall J. A., Levenson N. A., Elitzur M., Houck J. R., 2007, ApJ, 655, L77
- Hatziminaoglou et al. (2005) Hatziminaoglou E. et al., 2005, AJ, 129, 1198
- Hatziminaoglou et al. (2008) Hatziminaoglou E. et al., 2008, MNRAS, 386, 1252
- Hernán-Caballero et al. (2008) Hernán-Caballero A. et al., 2008, ASPC, 381, 367
- Ho (2005) Ho L. C., 2005, ApJ, 629, 680
- Horst et al. (2008) Horst H., Gandhi P., Smette A., Duschl W. J., 2008, A&A, 479, 389
- Houck et al. (2004) Houck J. R. et al., 2004, ApJS, 154, 18
- Houck et al. (2005) Houck J. R. et al., 2005, ApJ, 622, 105L
- Imanishi et al. (2007) Imanishi M., Dudley C. C., Maiolino R., Maloney P. R., Nakagawa T., Risaliti G., 2007, ApJS, 171, 72
- Kennicutt (1998) Kennicutt R. C., 1998, ARA&A, 36, 189
- Kim et al. (2006) Kim M., Ho L. C., Im M., 2006, ApJ, 642, 702
- Kimura et al. (2002) Kimura H. et al., 2002, Icarus, 159, 529
- Lacy et al. (2004) Lacy M. et al., 2004, ApJS, 154, 166
- Lacy et al. (2005) Lacy M. et al., 2005, Mem. S. A. It., 76, 154
- Lacy et al. (2007) Lacy M. et al., 2007, ApJ, 669, 61
- La Franca et al. (2004) La Franca F. et al., 2004, AJ, 127, 3075
- Lagache et al. (2003) Lagache G., Dole H., Puget J. L., 2003, MNRAS, 338, 555
- Lagache et al. (2004) Lagache G., et al., 2004, ApJS, 154, 112
- Lagache et al. (2005) Lagache G., Puget J. L., Dole H., 2005, ARA&A, 43, 727
- Laurent et al. (2000) Laurent O., Mirabel I. F., Charmandaris V., Gallais P., Madden S. C., Sauvage M., Vigroux L., Cesarsky C., 2000, A&A, 359, 887
- Lawrence et al. (2007) Lawrence A. et al., 2007, MNRAS, 379, 15599
- Le Floc’h et al. (2001) Le Floc’h E., Mirabel I. F., Laurent O., Charmandaris V., Vigroux L., Cesarsky C., 2001, A&A, 367, 487
- Li & Draine (2001) Li A., Draine B. T., 2001, ApJ, 554, 778
- Lipari et al. (1994) Lipari S., Colina L., Macheto F., 1994, ApJ, 427, 174.
- Lonsdale et al. (2003a) Lonsdale C. J. et al., 2003a, PASP, 115, 897
- Lonsdale et al. (2003b) Lonsdale C. J., Lonsdale C. J., Smith H., Diamond P., 2003b, ApJ, 592, 804
- Lonsdale et al. (2004) Lonsdale C. J. et al., 2004, ApJS, 154, 54
- Lonsdale et al. (2006) Lonsdale C. J., Farrah D., Smith H. E., 2006, Astrophysics Update 2 - topical and timely reviews on astronomy and astrophysics. Ed. John W. Mason. Springer/Praxis books (astro-ph/0603031)
- Lu et al. (2003) Lu N. et al., 2003, ApJ, 588, 199
- Lutz et al. (1998) Lutz D. Spoon H. W. W., Rigopoulou D., Moorwood A. F. M., Genzel R., 1998, ApJ, 505, 103L
- Lutz et al. (2003) Lutz D., Sturm E., Genzel R., Spoon H. W. W., Morwood A. F. M., Netzer H., Sternberg A., 2003, A&A, 409, 867
- Lutz et al. (2004) Lutz D., Maiolino R., Spoon H. W. W., Moorwood A. F. M., 2004, A&A, 418, 465
- Lutz et al. (2005) Lutz D., Valiante E., Sturm E., Genzel R., Tacconi L. J., Lehnert M. D., Sternberg A., Baker A. J., 2005, ApJ, 625, 83
- Lutz et al. (2007) Lutz D. et al., 2007, ApJ, 661, 25L
- Lutz et al. (2008) Lutz D. et al., 2008, ApJ, 684, 853L
- Maiolino et al. (1995) Maiolino R., Ruiz M., Rieke G. H., Keller L. D., 1995, ApJ, 446, 561
- Maiolino et al. (2007) Maiolino R., Shemmer O., Imanishi M., Netzer H., Oliva E., Lutz D., Sturm E., 2007, A&A, 468, 979
- Martínez-Sansigre et al. (2005) Martínez-Sansigre A., Rawlings S., Lacy M., Fadda D., Marleau F. R., Simpson C., Willott C. J., Jarvis M. J., 2005, Nature, 436, 666
- Morel et al. (2001) Morel T. et al., 2001, MNRAS, 327, 1187
- Netzer et al. (2007) Netzer H. et al., 2007, ApJ, 666, 806
- Norman et al. (2002) Norman C. et al., 2002, ApJ, 571, 2188
- Oliver et al. (2000) Oliver S. et al., 2000, MNRAS, 316, 768
- Omont et al. (2003) Omont A., Beelen A., Bertoldi F., Cox P., Carilli C. L., Priddey R. S., McMahon R. G., Isaak K. G., 2003, A&A, 398, 857
- Peeters et al. (2004) Peeters E., Spoon H. W. W., Tielens A. G. G. M., 2004, ApJ, 613, 986
- Polletta et al. (2007) Polletta M. et al., 2007, ApJ, 663, 81
- Polletta et al. (2008) Polletta M., Weedman D., Hönig S., Lonsdale C. J., Smith H. E., Houck J., 2008, ApJ, 675, 960
- Rapacioli et al. (2005) Rapacioli M., Joblin C., Boissel P., 2005, A&A, 429, 193
- Rigopoulou et al. (1999) Rigopoulou D., Spoon H. W. W., Genzel R., Lutz D., Moorwood A. F. M., Tran Q. D., 1999, AJ, 118, 2625
- Rowan-Robinson (2001) Rowan-Robinson M., 2001, ApJ, 549, 745
- Rowan-Robinson (2003) Rowan-Robinson M., 2003, MNRAS, 345, 819
- Rowan-Robinson et al. (2004) Rowan-Robinson M. et al., 2004, MNRAS, 351, 1290
- Rowan-Robinson et al. (2005) Rowan-Robinson M. et al., 2005, AJ, 129, 1183
- Rowan-Robinson et al. (2008) Rowan-Robinson M. et al., 2008, MNRAS, 386, 697
- Sajina et al. (2007) Sajina A., Yan L., Armus L., Choi P., Fadda D., Helou G., Spoon H. W. W., 2007, ApJ, 664, 713
- Sanders & Mirabel (1996) Sanders D. B., Mirabel I. F., 1996, ARA&A, 34, 725
- Schweitzer et al. (2006) Schweitzer M. et al., 2006, ApJ, 649, 79
- Serjeant & Hatziminaoglou (2009) Serjeant S., Hatziminaoglou E., 2009, MNRAS, accepted (astro-ph/0901.0552)
- Shi et al. (2006) Shi Y. et al., 2006, ApJ, 653, 127
- Shi et al. (2007) Shi Y. et al., 2007, ApJ, 669, 841
- Siebenmorgen et al. (2004) Siebenmorgen R., Krügel E., Spoon H. W. W., 2004, A&A, 414, 123
- Siebenmorgen et al. (2005) Siebenmorgen R., Haas M., Krügel E., Schulz B., 2005, A&A, 436, 5L
- Skrutskie et al. (2006) Skrutskie M. F. et al., 2006, AJ, 131, 1163
- Smith et al. (2007) Smith J. D. T. et al., 2007, ApJ, 656, 770
- Soifer et al. (1984) Soifer, B. T. et al., 1984, ApJL, 278, L71
- Spoon et al. (2002) Spoon H., Keane J., Tielens A., Lutz D., Moorwood A., Laurent O., 2002, A&A, 385, 1022
- Spoon et al. (2004) Spoon H. W. W. et al., 2004, ApJS, 154, 184
- Spoon et al. (2007) Spoon H. W. W., Marshall J. A., Houck J. R., Elitzur M., Hao L., Armus L., Brandl B. R., Charmandaris V., 2007, ApJ, 654, 49
- Stern et al. (2005) Stern D. et al., 2005, ApJ, 631, 163
- Sturm et al. (2005) Sturm E. et al., 2005, ApJ, 629, 21
- Sturm et al. (2006) Sturm E., Hasinger G., Lehmann I., Mainieri V., Genzel R., Lehnert M. D., Lutz D., Tacconi L. J., 2006, ApJ, 642, 81
- Surace et al. (2005) Surace J. A. et al., 2005, AAS, 205, 6303
- Swinbank et al. (2004) Swinbank A. M., Smail I., Chapman S. C., Blain A. W., Ivison R., Keel W., 2004, ApJS, 617, 64
- Takata et al. (2006) Takata T., Sekiguchi K., Smail I., Chapman S. C., Geach J. E., Swinbank A. M., Blain A., Ivison R. J., 2006, ApJ, 651, 713
- Teplitz et al. (2007) Teplitz H. I. et al., 2007, ApJ, 659, 941
- Tran et al. (2001) Tran Q. D. et al., 2000, ApJ, 552, 527
- Vaccari et al. (2005) Vaccari M. et al., 2005, MNRAS, 358, 397
- Vermeij et al. (2002) Vermeij R., van der Hulst J. M., 2002, A&A, 391, 1081
- Voit (1992) Voit G. M., 1992, MNRAS, 258, 841
- Weedman et al. (2005) Weedman D. W. et al., 2005, ApJ, 633, 706
- Weedman et al. (2006) Weedman D. W. et al., 2006, ApJ, 653, 101
- White et al. (2003) White R. L., Helfand D. J., Becker R. H., Gregg M. D., Postman M., Lauer T. R., Oegerle W., 2003, AJ, 126, 706
- Yan et al. (2005) Yan L. et al., 2005, ApJ, 628, 604
- Yan et al. (2007) Yan L. et al., 2007, ApJ, 658, 778
- York et al. (2000) York D. G. et al., 2000, AJ, 120, 1579
| ID | ELAIS name | R.A.aacoordinates of the optical ID of the 15-µm ELAIS source (González-Solares et al. 2005). | Dec.a | P.A. | Obs. date | Exposure time (s) | ||||
|---|---|---|---|---|---|---|---|---|---|---|
| [h.m.s.] | [d.m.s] | [mJy] | [deg] | SL2 | SL1 | LL2 | LL1 | |||
| EIRS-1 | ELAISC15_J161401.0+544733 | 16h14m30.9s | +54d52m15s | 0.79 0.10 | 147.1 | 2005-01-08 | 967 | 967 | 1950 | 1950 |
| EIRS-2 | ELAISC15_J161350.0+542631 | 16h14m19.3s | +54d31m11s | 0.80 0.16 | 146.9 | 2005-01-08 | 1451 | 967 | 1950 | 1950 |
| EIRS-3 | ELAISC15_J163636.2+411049 | 16h36m42.9s | +41d17m04s | 0.83 0.14 | 116.2 | 2005-02-14 | 967 | 967 | 1950 | 1950 |
| EIRS-4 | ELAISC15_J003640-433925 | 00h36m11.8s | -43d35m46s | 0.98 0.17 | 50.0 | 2005-06-08 | 967 | 967 | 1950 | 1950 |
| EIRS-5 | ELAISC15_J003408-431011 | 00h34m41.4s | -43d12m31s | 0.99 0.13 | 216.2 | 2004-11-16 | 967 | 967 | 1950 | 1950 |
| EIRS-6 | ELAISC15_J163721.3+411503 | 16h37m29.2s | +41d21m13s | 1.00 0.14 | 118.4 | 2005-02-12 | 484 | 484 | 975 | 975 |
| EIRS-7 | ELAISC15_J163655.8+405909 | 16h37m03.2s | +41d05m23s | 1.02 0.14 | 117.4 | 2005-02-13 | 484 | 484 | 975 | 975 |
| EIRS-8 | ELAISC15_J163455.0+412211 | 16h35m04.3s | +41d28m16s | 1.04 0.15 | 120.9 | 2005-02-08 | 484 | 484 | 975 | 975 |
| EIRS-9 | ELAISC15_J160733.7+534749 | 16h08m01.6s | +53d52m41s | 1.04 0.18 | 144.5 | 2005-01-09 | 484 | 484 | 975 | 975 |
| EIRS-10 | ELAISC15_J161511.2+550627 | 16h15m41.3s | +55d11m06s | 1.06 0.12 | 147.5 | 2005-01-08 | 484 | 484 | 975 | 975 |
| EIRS-11 | ELAISC15_J163739.3+414348 | 16h37m47.5s | +41d49m59s | 1.06 0.11 | 118.4 | 2005-02-12 | 484 | 484 | 975 | 975 |
| EIRS-12 | ELAISC15_J161229.0+542832 | 16h12m57.7s | +54d33m19s | 1.06 0.17 | 145.8 | 2005-01-09 | 484 | 484 | 975 | 975 |
| EIRS-13 | ELAISC15_J163954.5+411109 | 16h40m02.3s | +41d17m20s | 1.07 0.16 | 118.1 | 2005-02-13 | 484 | 484 | 975 | 975 |
| EIRS-14 | ELAISC15_J163536.6+404754 | 16h35m44.4s | +40d54m05s | 1.12 0.12 | 118.1 | 2005-02-12 | 484 | 484 | 975 | 975 |
| EIRS-15 | ELAISC15_J161332.4+544830 | 16h14m02.5s | +54d53m13s | 1.12 0.19 | 146.9 | 2005-01-08 | 484 | 484 | 975 | 975 |
| ID | ||||||||
|---|---|---|---|---|---|---|---|---|
| EIRS-1 | 19.39 0.02 | 20.28 0.03 | 19.64 0.04 | 19.41 0.11 | 18.95 0.02 | 18.17 0.02 | 16.42 0.01 | |
| EIRS-2 | 20.51 0.04 | 23.08 0.05 | 22.14 0.06 | 21.25 0.12 | 20.40 0.04 | 19.10 0.07 | 17.11 0.03 | |
| EIRS-3 | 23.22 0.10 | 22.27 0.05 | 21.01 0.10 | 20.40 0.05 | ||||
| EIRS-4 | ||||||||
| EIRS-5 | ||||||||
| EIRS-6 | 20.51 0.03 | 20.77 0.02 | 20.59 0.04 | 20.14 0.06 | 19.97 0.04 | |||
| EIRS-7 | 22.63 0.10 | 22.87 0.04 | 22.92 0.08 | 23.02 0.23 | ||||
| EIRS-8 | 21.94 0.05 | 22.39 0.03 | 21.80 0.06 | 20.90 0.10 | 20.20 0.05 | |||
| EIRS-9 | 22.71 0.07 | 21.88 0.06 | 21.11 0.12 | |||||
| EIRS-10 | 19.07 0.02 | 19.58 0.02 | 19.07 0.02 | 19.00 0.02 | 18.72 0.02 | |||
| EIRS-11 | 18.22 0.02 | 19.06 0.02 | 18.79 0.02 | 18.51 0.02 | 18.55 0.03 | |||
| EIRS-12 | 20.63 0.05 | 21.47 0.02 | 21.14 0.02 | 20.79 0.11 | 20.25 0.04 | 20.23 0.13 | 19.46 0.15 | |
| EIRS-13 | 23.57 0.07 | 22.76 0.06 | 22.10 0.11 | 20.49 0.06 | ||||
| EIRS-14 | 23.46 0.14 | 21.78 0.12 | 21.18 0.11 | |||||
| EIRS-15 | 22.49 0.10 | 22.72 0.04 | 21.74 0.05 | 20.49 0.11 | 19.68 0.02 | 18.08 0.02 | 16.41 0.01 |
| ID | ||||||||
|---|---|---|---|---|---|---|---|---|
| [µJy] | [µJy] | [µJy] | [µJy] | [mJy] | [mJy] | [mJy] | [mJy] | |
| EIRS-1 | 297.0 1.9 | 366.0 2.4 | 471 6 | 789 5 | 0.79 0.10 | 2.48 0.02 | ||
| EIRS-2 | 128.0 1.6 | 113.0 1.4 | 64 5 | 84 4 | 0.80 0.16 | 0.94 0.02 | 16.4 1.0 | 70.2 5.1 |
| EIRS-3 | 63.4 1.1 | 40.7 1.2 | 0.83 0.14 | |||||
| EIRS-4 | 347.0 2.0 | 524.0 2.6 | 745 7 | 1090 7 | 0.98 0.17 | 4.33 0.04 | 33.1 1.7 | |
| EIRS-5 | 276.0 2.2 | 359.0 2.7 | 458 8 | 707 8 | 0.99 0.13 | 2.18 0.03 | ||
| EIRS-6 | 31.2 0.9 | 41.6 1.2 | 56 4 | 140 4 | 1.00 0.14 | 0.48 0.02 | ||
| EIRS-7 | 27.6 0.5 | 52.6 1.0 | 121 3 | 399 4 | 1.02 0.14 | 2.39 0.02 | 13.0 1.2 | |
| EIRS-8 | 205.0 1.8 | 247.0 1.6 | 345 6 | 516 4 | 1.04 0.15 | 1.40 0.02 | ||
| EIRS-9 | 98.6 1.3 | 77.7 1.5 | 96 5 | 163 5 | 1.04 0.18 | 1.91 0.02 | 36.1 1.3 | |
| EIRS-10 | 560.0 2.9 | 722.0 3.6 | 823 7 | 1100 6 | 1.06 0.12 | 2.73 0.02 | ||
| EIRS-11 | 171.0 1.4 | 267.0 1.7 | 412 5 | 693 4 | 1.06 0.11 | 2.34 0.02 | ||
| EIRS-12 | 27.1 0.7 | 45.0 1.1 | 102 4 | 248 4 | 1.06 0.17 | 2.11 0.02 | ||
| EIRS-13 | 99.4 1.2 | 81.2 1.2 | 68 4 | 1.07 0.16 | 0.48 0.02 | |||
| EIRS-14 | 107.0 1.0 | 82.8 1.0 | 109 3 | 133 3 | 1.12 0.12 | 1.30 0.02 | 22.7 1.4 | 66.1 5.5 |
| EIRS-15 | 264.0 1.8 | 230.0 1.7 | 336 6 | 347 4 | 1.12 0.19 | 1.41 0.02 | 47.3 5.9 |
| ID | ID | ID | |||||
|---|---|---|---|---|---|---|---|
| ULIRGs; Armus et al. 2007 | |||||||
| IRAS 05189-2524 | 0.043 | IRAS 08572+3915 | 0.058 | IRAS 12112+0305 | 0.073 | ||
| IRAS 14348-1445 | 0.083 | IRAS 15250+3609 | 0.055 | IRAS 22491-1808 | 0.078 | ||
| Arp 220 | 0.018 | Mrk 231 | 0.042 | Mrk 273 | 0.038 | ||
| UGC 5101 | 0.039 | ||||||
| Starbursts; Brandl et al. 2006 | |||||||
| Mrk 52 | 0.007 | NGC 1222 | 0.008 | NGC 2146 | 0.003 | ||
| NGC 3628 | 0.003 | NGC 520 | 0.008 | NGC 7252 | 0.016 | ||
| NGC 7714 | 0.009 | ||||||
| ID | opt. classaaClassification of the source based on its optical SED or spectrum | type | bbReliability of the redshift estimation. A = reliable, B = unreliable | Reference | |
|---|---|---|---|---|---|
| EIRS-1 | 0.387 | QSO | zspec | A | Pérez-Fournon (priv. comm.) |
| EIRS-2 | 1.154 | galaxy | zIRS | A | |
| EIRS-3 | 0.676 | galaxy | zIRS | A | |
| EIRS-4 | 1.181 | QSO | zspec | A | La Franca et al. (2004) |
| EIRS-5 | 1.065 | QSO | zspec | A | La Franca et al. (2004) |
| EIRS-6 | 2.356 | QSO | zspec | A | Pérez-Fournon (priv. comm.) |
| EIRS-7 | 2.592 | galaxy | zspec | A | Swinbank et al. (2004) |
| EIRS-8 | 0.884 | galaxy | zIRS | B | |
| EIRS-9 | 0.609 | galaxy | zIRS | A | |
| EIRS-10 | 1.265 | QSO | zIRS | B | |
| EIRS-11 | 1.414 | QSO | zspec | A | SDSS |
| EIRS-12 | 2.024 | galaxy | zIRS | A | |
| EIRS-13 | 1.091 | galaxy | zIRS | A | |
| EIRS-14 | 0.619 | galaxy | zIRS | A | |
| EIRS-15 | 0.827 | galaxy | zIRS | A |
| ID | 2.2 µm | 5.5 µm | 7 µm | 10 µm | 15 µm | 2.2 µm | 5.5 µm | 7 µm | 10 µm | 15 µm | ||||||||||
|---|---|---|---|---|---|---|---|---|---|---|---|---|---|---|---|---|---|---|---|---|
| [mJy] | [mJy] | [mJy] | [mJy] | [mJy] | [1010 ] | [1010 ] | [1010 ] | [1010 ] | [1010 ] | |||||||||||
| EIRS-1 | — | 0.67 | 0.10 | 1.0 | 0.1 | 1.4 | 0.1 | 2.4 | 0.1 | — | 3 | 0 | 4 | 0 | 3 | 0 | 4 | 0 | ||
| EIRS-2 | 0.104 | 0.004 | 0.18 | 0.07 | 0.5 | 0.1 | 0.5 | 0.2 | 1.0 | 0.2 | 13.0 | 0.5 | 9 | 3 | 21 | 3 | 13 | 4 | 19 | 3 |
| EIRS-3 | 0.061 | 0.002 | 0.20 | 0.2 | 0.2 | 0.2 | 2.6 | 0.1 | 3 | 2 | 1 | 1 | ||||||||
| EIRS-4 | 0.575 | 0.008 | 1.56 | 0.10 | 2.0 | 0.1 | 3.9 | 0.2 | 6.3 | 0.2 | 75.0 | 1.0 | 81 | 5 | 82 | 4 | 111 | 5 | 120 | 3 |
| EIRS-5 | 0.362 | 0.006 | 1.08 | 0.09 | 1.2 | 0.1 | 1.6 | 0.2 | 3.0 | 0.2 | 38.5 | 0.6 | 45 | 3 | 41 | 3 | 37 | 4 | 47 | 2 |
| EIRS-6 | 0.117 | 0.009 | 0.40 | 0.3 | 0.2 | 0.9 | 0.4 | 1.0 | 0.2 | 55.1 | 4.2 | 75 | 50 | 24 | 94 | 38 | 69 | 10 | ||
| EIRS-7 | 0.387 | 0.009 | 2.33 | 0.25 | 2.7 | 0.2 | — | 8.3 | 1.3 | 215.2 | 5.0 | 518 | 54 | 466 | 26 | — | 680 | 102 | ||
| EIRS-8 | 0.230 | 0.003 | 0.66 | 0.10 | 0.9 | 0.1 | 0.9 | 0.2 | 1.8 | 0.2 | 16.9 | 0.2 | 19 | 2 | 21 | 2 | 14 | 3 | 19 | 1 |
| EIRS-9 | 0.099 | 0.001 | 0.35 | 0.10 | 0.9 | 0.1 | 0.4 | 0.1 | 1.8 | 0.1 | 3.4 | 0.0 | 4 | 1 | 9 | 0 | 3 | 1 | 8 | 0 |
| EIRS-10 | 0.760 | 0.010 | 1.37 | 0.11 | 1.9 | 0.1 | 2.8 | 0.2 | 4.4 | 0.4 | 113.4 | 1.5 | 81 | 6 | 89 | 5 | 90 | 6 | 96 | 7 |
| EIRS-11 | 0.357 | 0.009 | 1.12 | 0.17 | 1.5 | 0.1 | 2.9 | 0.2 | 4.7 | 0.7 | 66.0 | 1.7 | 82 | 12 | 88 | 8 | 119 | 6 | 126 | 19 |
| EIRS-12 | 0.159 | 0.009 | 1.40 | 0.16 | 1.9 | 0.2 | 1.8 | 0.2 | 4.1 | 0.6 | 57.2 | 3.2 | 202 | 22 | 214 | 23 | 143 | 14 | 216 | 32 |
| EIRS-13 | 0.080 | 0.003 | 0.21 | 0.3 | 0.1 | 0.5 | 0.4 | 8.9 | 0.3 | 9 | 10 | 4 | 11 | 6 | ||||||
| EIRS-14 | 0.107 | 0.001 | 0.29 | 0.7 | 0.1 | 0.3 | 0.1 | 1.1 | 0.1 | 3.8 | 0.0 | 4 | 7 | 1 | 2 | 1 | 5 | 0 | ||
| EIRS-15 | 0.248 | 0.004 | 0.51 | 0.10 | 0.6 | 0.1 | 0.8 | 0.2 | 1.6 | 0.1 | 15.9 | 0.3 | 12 | 2 | 12 | 2 | 11 | 2 | 14 | 1 |
| ID | 1015 | 1015 | |||||||||||||
|---|---|---|---|---|---|---|---|---|---|---|---|---|---|---|---|
| [erg cm-2 s-1] | [µm] | [1010 ] | [erg cm-2 s-1] | [µm] | [1010 ] | ||||||||||
| EIRS-1 | 4.6 | 0.11 | 0.06 | 14.0 | 2.0 | 0.38 | 0.06 | 0.19 | 0.03 | 0.00 | 0.11 | 0.05 | |||
| EIRS-2 | 9.6 | 0.9 | 1.43 | 0.14 | 1.89 | 0.18 | 40.0 | 1.5 | 5.70 | 0.21 | 7.88 | 0.29 | 0.61 | 0.61 | -0.58 |
| EIRS-3 | 6.7 | 2.2 | 5.86 | 2.00 | 0.35 | 0.12 | 14.3 | 2.6 | 13.61 | 2.60 | 0.74 | 0.14 | -1.82 | 2.09 | 1.93 |
| EIRS-4 | 2.5 | 0.04 | 0.52 | 2.5 | 0.05 | 0.52 | -0.23 | 0.08 | 0.17 | ||||||
| EIRS-5 | 5.1 | 1.5 | 0.12 | 0.04 | 0.81 | 0.24 | 5.1 | 1.5 | 0.16 | 0.05 | 0.83 | 0.25 | 0.08 | 0.15 | -0.07 |
| EIRS-6 | 2.8 | 0.31 | 3.20 | 2.4 | 0.34 | 2.76 | -0.22 | 0.50 | 0.28 | ||||||
| EIRS-7 | 2.7 | 0.05 | 3.90 | 2.2 | 0.05 | 3.20 | 0.95 | 0.25 | -0.76 | ||||||
| EIRS-8 | 4.4 | 0.15 | 0.45 | 6.9 | 0.27 | 0.70 | 0.48 | 0.25 | -0.51 | ||||||
| EIRS-9 | 22.0 | 1.7 | 2.00 | 0.15 | 0.89 | 0.07 | 82.9 | 2.7 | 7.32 | 0.24 | 3.34 | 0.11 | 0.77 | 0.38 | -0.58 |
| EIRS-10 | 3.5 | 0.07 | 0.86 | 3.0 | 0.07 | 0.73 | -0.05 | 0.11 | 0.13 | ||||||
| EIRS-11 | 7.8 | 2.6 | 0.20 | 0.07 | 2.56 | 0.87 | 6.7 | 2.3 | 0.19 | 0.07 | 2.20 | 0.76 | -0.31 | 0.19 | 0.29 |
| EIRS-12 | 5.9 | 2.4 | 0.17 | 0.07 | 4.74 | 1.88 | 13.4 | 3.1 | 0.42 | 0.10 | 10.70 | 2.48 | 0.95 | 0.21 | -0.77 |
| EIRS-13 | 5.3 | 1.6 | 1.21 | 0.38 | 0.90 | 0.28 | 21.2 | 2.4 | 5.49 | 0.63 | 3.64 | 0.42 | 0.80 | 1.98 | - |
| EIRS-14 | 25.0 | 2.9 | 3.11 | 0.37 | 1.05 | 0.12 | 64.5 | 3.5 | 8.47 | 0.47 | 2.71 | 0.15 | 0.84 | 0.60 | -0.38 |
| EIRS-15 | 2.3 | 1.1 | 0.10 | 0.05 | 0.20 | 0.09 | 10.6 | 2.2 | 0.59 | 0.12 | 0.91 | 0.19 | 0.13 | 0.28 | -0.02 |
| Criterion | Expression | AGN1 | AGN2 | SB |
|---|---|---|---|---|
| C1 | 0.2 | 0.2 | 0.2 | |
| C2 | L55/ | 0.1 | 0.1 | 0.1 |
| C3 | 15% | 15% | 15% | |
| C4 | 0.15 | 0.15–1.0 | 1.0 | |
| C5 | 0 | 0 | 0 | |
| C6 | L15/L10 | 2 | 2–4 | 4 |
| Optical class | N AGN1 | N AGN2 | N SB |
|---|---|---|---|
| Sy1 | 31 | 2 | 0 |
| Sy1/HII | 3 | 3 | 1 |
| Sy2 | 2 | 11 | 1 |
| Sy2/HII | 1 | 1 | 15 |
| HII | 0 | 0 | 7 |
| ULIRG/LINER | 0 | 3 | 12 |
| ULIRG/HII | 0 | 0 | 12 |
| ID | z | [µm] | C1 | / | C2 | [%] | C3 | C4 | C5 | / | C6 | Cfinal | ||
|---|---|---|---|---|---|---|---|---|---|---|---|---|---|---|
| EIRS-1 | 0.387 | 0.112 | 1,2 | 0.486 | 1,2 | 3.9 | 1,2 | 0.260 | 2 | 0.05 | 1 | 1.777 | 1 | 1 |
| EIRS-2 | 1.154 | 1.434 | S | 0.030 | S | 57.1 | S | 8.010 | S | -0.58 | 2,S | 2.068 | 2 | S |
| EIRS-3 | 0.676 | 5.861 | S | 0.268 | S | 57.5 | S | 13.880 | S | 1.28 | 1 | 0.721 | 1 | S |
| EIRS-4 | 1.181 | 0.040 | 1,2 | 0.225 | 1,2 | 0.8 | 1,2 | 0.046 | 1 | 0.16 | 1 | 1.614 | 1 | 1 |
| EIRS-5 | 1.065 | 0.125 | 1,2 | 1.024 | 1,2 | 3.7 | 1,2 | 0.310 | 2 | -0.07 | 2,S | 1.875 | 1 | 2 |
| EIRS-6 | 2.356 | 0.306 | 1,2 | 0.558 | S | 0.0 | 1,2 | 0.340 | 1 | -0.26 | 2,S | 1.101 | 1 | 1 |
| EIRS-7 | 2.592 | 0.052 | 1,2 | 0.316 | 1,2 | 0.0 | 1,2 | 0.052 | 1 | -0.76 | 2,S | – | - | 2∗ |
| EIRS-8 | 0.884 | 0.152 | 1,2 | 0.528 | 1,2 | 1.1 | 1,2 | 0.274 | 1 | -0.51 | 2,S | 2.011 | 2 | 1 |
| EIRS-9 | 0.609 | 2.004 | S | 0.046 | S | 46.0 | S | 6.560 | S | -0.58 | 2,S | 4.036 | S | S |
| EIRS-10 | 1.265 | 0.066 | 1,2 | 0.899 | 1,2 | 0.0 | 1,2 | 0.066 | 1 | 0.20 | 1 | 1.588 | 1 | 1 |
| EIRS-11 | 1.414 | 0.199 | 1,2 | 0.654 | 1,2 | 3.3 | 1,2 | 0.300 | 2 | 0.17 | 1 | 1.599 | 1 | 1 |
| EIRS-12 | 2.024 | 0.165 | 1,2 | 0.117 | 1,2 | 4.9 | 1,2 | 0.260 | 2 | -0.77 | 2,S | 2.264 | 2 | 2 |
| EIRS-13 | 1.091 | 1.208 | S | 0.084 | S | 51.5 | S | 5.920 | S | -0.80 | 2,S | 1.069 | S | S |
| EIRS-14 | 0.619 | 3.113 | S | 0.048 | S | 45.7 | S | 7.690 | S | -0.38 | 2,S | 3.486 | 2 | S |
| EIRS-15 | 0.827 | 0.103 | 1,2 | 0.878 | 1,2 | 11.6 | 1,2 | 0.900 | 2 | -0.02 | 2,S | 1.893 | 1 | 2 |
| Optical class | N AGN1 | N AGN2 | N SB |
|---|---|---|---|
| QSOs | 33 | 5 | 1 |
| Galaxy | 7 | 12 | 10 |
| Reference | Galaxy type | PAH feature(s) | Result |
|---|---|---|---|
| Rigopoulou et al. (1999)aaEstimates underlying continuum by interpolation in PAH-free intervals. | starburst | 7.7 µm | / = 0.0081 |
| ” | ULIRG starburst | 7.7 µm | L77/ = 0.0055 |
| Lutz et al. (2003)bbUses in the peak of the feature. Converted to luminosity by Shi et al. (2007) assuming a Drude profile with FWHM = 0.6 µm. | starburst | 7.7 µm | L77/ = 0.033 |
| Spoon et al. (2004)aaEstimates underlying continuum by interpolation in PAH-free intervals. | normal and starburst | 6.2 µm | L62/ = 0.0034 |
| Smith et al. (2007)ccEstimates continuum by simultaneous fitting of the spectrum to a Lorentzians+continuum model. | normal and starburst | 6.2 µm | L62/ = 0.011 |
| ” | normal and starburst | 7.7 µm | L77/ = 0.041 |
| Farrah et al. (2008)aaEstimates underlying continuum by interpolation in PAH-free intervals. | starburst | 6.2+11.3 µm | L62+113/ = 0.038 |
| This work | ULIRG starburst | 6.2 µm | L62/ = 0.012 |
| ” | ULIRG starburst | 7.7 µm | L77/ = 0.038 |
| ” | ULIRG starburst | 11.3 µm | L113/ = 0.011 |
| ID | log / | SEDaatemplate SED that best fits the MIR and FIR photometry. | PAHbbPAH feature(s) used for star formation rate estimation. | /ccratio of star formation induced IR luminosity to total IR luminosity. | SFRddstar formation rate as estimated from PAH luminosity | |||||||
|---|---|---|---|---|---|---|---|---|---|---|---|---|
| [mJy] | [mJy] | [] | ||||||||||
| EIRS-1 | 10.8 | 0.3 | QSO high | 6.2 11.3 | 0.44 | 5 | ||||||
| EIRS-2 | 16.4 | 1.0 | 70.2 | 5.1 | 12.4 | 0.1 | Dale26 | 6.2 7.7 11.3 | 0.69 | 0.03 | 332 | 12 |
| EIRS-3 | 11.0 | 0.3 | Seyfert 2 | 6.2 7.7 11.3 | 2.03 | 0.34 | 40 | 6 | ||||
| EIRS-4 | 33.1 | 1.7 | 12.5 | 0.5 | Strong FIR QSO | 6.2 7.7 | 0.08 | 47 | ||||
| EIRS-5 | 11.6 | 0.3 | QSO low | 6.2 7.7 11.3 | 1.47 | 0.19 | 115 | 15 | ||||
| EIRS-6 | 12.1 | 0.3 | QSO high | 6.2 7.7 | 1.20 | 287 | ||||||
| EIRS-7 | 13.0 | 1.2 | 13.0 | 0.5 | Mrk 231 | 6.2 7.7 | 0.20 | 346 | ||||
| EIRS-8 | 11.3 | 0.3 | QSO low | 6.2 7.7 11.3 | 1.25 | 43 | ||||||
| EIRS-9 | 36.1 | 1.3 | 11.9 | 0.2 | NGC 6240 | 6.2 7.7 11.3 | 0.88 | 0.03 | 124 | 4 | ||
| EIRS-10 | 12.1 | 0.3 | Weak FIR QSO | 6.2 7.7 | 0.31 | 77 | ||||||
| EIRS-11 | 12.0 | 0.3 | QSO norm | 6.2 7.7 11.3 | 1.06 | 0.22 | 223 | 45 | ||||
| EIRS-12 | 13.1 | 0.3 | M82 | 6.2 7.7 | 0.25 | 0.06 | 576 | 143 | ||||
| EIRS-13 | 12.0 | 0.3 | GL12 | 6.2 7.7 11.3 | 0.99 | 0.10 | 173 | 17 | ||||
| EIRS-14 | 22.7 | 1.4 | 66.1 | 5.5 | 11.9 | 0.1 | Dale26 | 6.2 7.7 11.3 | 0.86 | 0.05 | 119 | 6 |
| EIRS-15 | 47.3 | 5.9 | 11.3 | 0.3 | Weak FIR QSO | 6.2 7.7 11.3 | 1.12 | 0.26 | 42 | 9 | ||
| redshift | filter | mean flux | M82aaInfrared luminosity of the starburst component required to reproduce observed FIR flux, assuming M82 or Arp220 SED. | Arp220aaInfrared luminosity of the starburst component required to reproduce observed FIR flux, assuming M82 or Arp220 SED. |
|---|---|---|---|---|
| [mJy] | [] | [] | ||
| z 1.5 | 70 µm | 11 2 | 8.51011 | 8.41011 |
| (22 sources) | 160 µm | 27 9 | 1.31012 | 8.91011 |
| z 1.5 | 70 µm | 5.3 1.1 | 4.41012 | 8.31012 |
| (18 sources) | 160 µm | 28 7 | 6.31012 | 5.31012 |
| Group | PAH band | ||||
|---|---|---|---|---|---|
| [µm] | [] | [] | [] | ||
| QSOs | 6.2 µm | 0.01 | 7.1 109 | 5.9 1011 | 100 |
| high lum. | 7.7 µm | 0.03 | 1.7 1010 | 4.5 1011 | 80 |
| (18 sources) | 11.3 µm | 0.01 | 3.5 109 | 3.1 1011 | 53 |
| QSOs | 6.2 µm | 0.03 | 3.3 109 | 2.7 1011 | 46 |
| low lum. | 7.7 µm | 0.09 | 8.1 109 | 2.1 1011 | 37 |
| (18 sources) | 11.3 µm | 0.05 | 3.4 109 | 3.0 1011 | 52 |
| Obsc. AGN | 6.2 µm | 0.04 | 2.5 1010 | 2.1 1012 | 352 |
| high lum. | 7.7 µm | 0.10 | 5.6 1010 | 1.5 1012 | 257 |
| (5 sources) | 11.3 µm | 0.20 | 3.8 1010 | 3.5 1012 | 589 |
| Obsc. AGN | 6.2 µm | 0.10 | 8.1 109 | 6.7 1011 | 114 |
| low lum. | 7.7 µm | 0.34 | 2.6 1010 | 6.8 1011 | 121 |
| (6 sources) | 11.3 µm | 0.07 | 3.6 109 | 3.3 1011 | 54 |