Quantum oscillations in the anomalous phase in Sr3Ru2O7
Abstract
We report measurements of quantum oscillations detected in the putative nematic phase of Sr3Ru2O7. Significant improvements in sample purity enabled the resolution of small amplitude dHvA oscillations between two first order metamagnetic transitions delimiting the phase. Two distinct frequencies were observed, and their amplitudes follow the normal Lifshitz-Kosevich profile. The Fermi surface sheets seem to correspond to a subset of those detected outside the phase. Variations of the dHvA frequencies are explained in terms of a chemical potential shift produced by reaching a peak in the density of states, and an anomalous field dependence of the oscillatory amplitude provides information on domains.
In recent years, the possibility that electronic liquid crystalline states might exist Kivelson et al. (1998) has generated considerable interest. In such systems, the electron fluid is thought to develop textures leading to anisotropies which are not compatible with the space group symmetry of the host crystal. Experimentally, nematic-like transport properties have been observed in high-purity two dimensional electron gases Lilly et al. (1999a, b); Pan et al. (1999); Cooper et al. (2002), and signatures of electronic anisotropy have also been reported in YBa2Cu3O7-δ Ando et al. (2002); Hinkov et al. (2008). Combined with observations on the subject of this letter, Sr3Ru2O7, these experiments have stimulated a body of further theoretical work on the issue Dell’Anna and Metzner (2006); Oganesyan et al. (2001); Fradkin et al. (2007); Yamase (2007); Kee et al. (2003); Kee and Kim (2005); Green et al. (2005); Quintanilla et al. (2008); Berridge et al. (2009); Yamase (2009); Raghu et al. (2009); Lee and Wu (2009).
Sr3Ru2O7 offers an excellent opportunity for experimental study of this novel behaviour. In the cleanest single crystals, with mean free paths of several thousand angstroms, a well-defined phase displaying nematic-like transport anisotropies exists below 1.2 K for magnetic fields between approximately 7.9 and 8.1 T Perry et al. (2004); Grigera et al. (2004); Borzi et al. (2007). The combination of long mean free paths and the existence of large single crystals means that it is possible to obtain thermodynamic as well as transport information about this phase and its formation Rost et al. (2009).
In this letter, we present a study of the nematic phase in Sr3Ru2O7 using one of the best-established microscopic probes of metals, the de Haas - van Alphen (dHvA) effect. Performing the project required the growth of a new generation of high purity single crystals, screened in a series of dHvA measurements to provide the largest oscillatory signals. This enabled the observation of oscillations both within the nematic phase itself and in its immediate vicinity.
The crystals were grown using methods published previously Perry and Maeno (2004). Measurements with a noise floor of around 30 pV/ were performed in Cambridge using a dilution refrigerator. An improvement in signal due to crystal purity of a factor of approximately 25 was obtained compared to the previous dHvA study Borzi et al. (2004); Not (????a); Mercure et al. (2009).
In Fig. 1 we present plots of the dHvA oscillations, inside and outside the nematic phase, with the field oriented along the -axis. Second harmonic detection was used, in order to reduce the large non-oscillatory component of the susceptibility near the metamagnetic transition. Consequently, metamagnetic jumps in the magnetisation appear as sharp asymmetric peaks. The top panel of Fig. 1 shows the dHvA signal in the region neighbouring the metamagnetic transition, where three such peaks can be observed, denoted , and . The broad peak located at 7.5 T corresponds to a metamagnetic cross-over previously observed in several properties Perry et al. (2004), while the sharp features and correspond to metamagnetic phase transitions at 7.9 and 8.1 T, bounding the nematic phase.
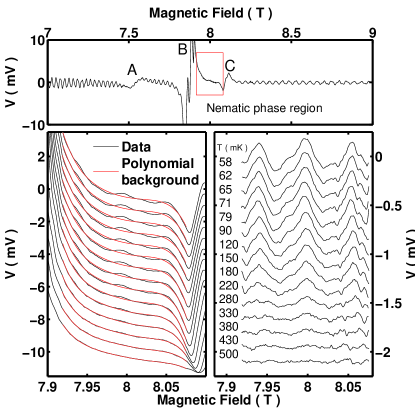
In the bottom left panel of Fig. 1, we present a blow-up of the second harmonic susceptibility signal between 7.9 and 8.1 T at 15 different temperatures between 58 and 500 mK, offset for clarity. Small amplitude oscillations are observed on top of a smooth magnetic background, which was modelled by fitting a fifth order polynomial (red line) to the data between 7.915 and 8.080 T. Polynomials of lower order did not reproduce the magnetic background well, while higher orders removed a component of the oscillations. In Fig. 1, right, we show the oscillations remaining after the background removal. These are suppressed as the temperature increases to 500 mK, due to the Lifshitz-Kosevich (LK) amplitude reduction factor Shoenberg (1984). The quality of the LK fits suggests that both orbits result from Landau quasiparticles. The oscillations were reproduced on three samples over four different dHvA runs. They were moreover found to be suppressed by rotating the field as little as 5∘ from -axis.
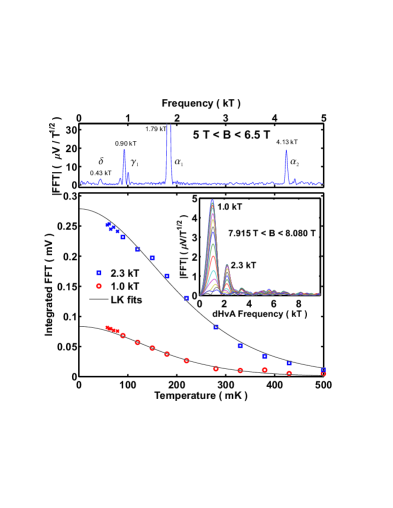
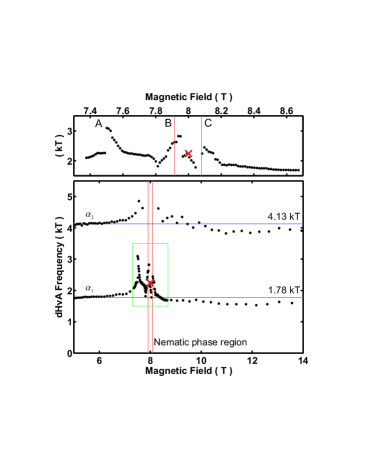
The oscillatory data taken in the nematic phase revealed two distinct frequencies of 1.0 and 2.3 kT (inset to Fig. 2), with masses of 6.10.3 and 7.40.2 respectively Not (????b). For reference, we show, in the top panel of Fig. 2, a spectrum obtained outside the nematic phase, between 5 and 6.5 T. Peaks are observed at 0.43, 0.90, 1.78 and 4.13 kT termed , , and respectively Tamai et al. (2008); higher resolution studies of the low frequency region reveal further frequencies, termed and , at 0.15 kT and 0.11 kT. The associated quasiparticle masses rule out the possibility that any of these frequencies is a harmonic of any other (see Tamai et al. (2008); Borzi et al. (2004); Mercure et al. (2009) for details). The resolution with which we can determine the frequency of the 1.0 kT peak in the nematic region is limited by the number of oscillations present in the narrow field range, and it seems reasonable to associate it with the 0.9 kT peak seen on the low field side. At first sight, it is difficult to relate the 2.3 kT peak with those seen at low fields, but, as shown in Fig. 3, the and frequencies show a strong field dependence in the metamagnetic region, and the 2.3 kT frequency is compatible with an interpolation into the nematic phase of the field dependence of the frequency. This identification is also compatible with mass analysis (presented in detail in ref. [Mercure et al., 2009]) which shows that the masses associated with the frequencies in the nematic phase are similar to those for the and frequencies (6.61 and 7.00.5 respectively) outside it.
The dependence of the frequency of dHvA oscillations in the vicinity of metamagnetism encodes information about the mechanism of the transition. As pointed out by Julian and co-workers Julian et al. (1992), the measured dHvA frequency , where is the Fermi surface cross-sectional area as a function of magnetic field . The situation most usually considered, sketched in Fig. 4, is that where the coupling between field and magnetisation is field dependent (e.g. the effective factor is field dependent), and leads to symmetrical changes in the cross-sectional area of the Fermi surface for both spins around the zero field value. This produces peaks in the measured frequency of opposite sign.
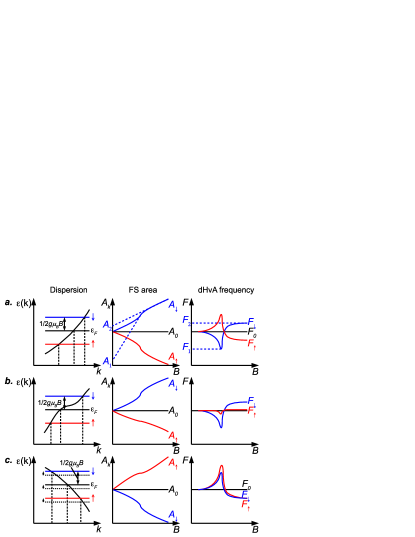
The situation in Fig. 4 originates from a pronounced change of gradient in the dispersion of the band being studied, which may appear either below or above the Fermi level. Such a dispersion leads to changes in mainly one of the spin split cross-sectional areas, and produces a peak in one of the measured frequencies, leaving the other almost constant. Large frequency splitting is therefore expected through the transition region and at fields above it.
Finally, the third scenario depicted in Fig. 4 is that in which a change in chemical potential occurs at a certain field value. This would correspond to a sudden dispersion change in one of the other bands in a multi-band material like Sr3Ru2O7, leading to a redistribution of carriers. This chemical potential shift leads to an acceleration of the splitting of the cross-sectional area for one spin, and to a slowdown for the other. Consequently, peaks of the same sign for both spins are observed in the measured frequencies, and both saturate at high-field values reduced from those on the low-field side Not (????c).
Only the third scenario is compatible with our observations. We see peaking of both the and frequencies through the metamagnetic region, followed by saturation at constant values of approximately 1.6 and 3.9 kT respectively, but do not resolve any frequency splitting through the transition (see Figs. 3 and 4c).
This finding is consistent with the results of Tamai Tamai et al. (2008), who showed that a saddle point in the dispersion of is present below the Fermi level (). This feature of the band structure leads to a peak in the density of states which is situated at around 3 meV below . Conservation of the number of electrons requires that when approaching this saddle point with Zeeman splitting, the hole filling of the peak in the density of states by one of the spin species leads to an increase of the chemical potential compared to its zero field value. This corresponds to an exchange of holes from existing bands towards the region of the Brillouin zone with a large and expanding density of states, and produces the observed increase in magnetisation. Both and correspond to hole sheets of the Fermi surface, so this is consistent both with the reduction of their dHvA frequencies at high fields (above 8.1 T) and with the positive sign of the peaks in the frequencies through the metamagnetic region.
This observation has interesting implications for understanding both the metamagnetism and the effects that metamagnetic fluctuations have on different bands near . The and sheets are based on the and orbitals of Ru and hence have a more 1-D character than the other Fermi surface sheets. It appears that these bands contribute only weakly to the magnetic moment change, but still couple to the metamagnetism via the charge transfer that changes the chemical potential. This in turn implies a sensitivity of the and sheets to the fluctuations that occur as one or more other bands (most likely ) approach metamagnetic criticality.
Having observed well defined orbits in the nematic region we can analyze changes in the amplitude of each frequency to investigate microscopic scattering on different Fermi surface sheets. We first consider the normal region; in the top panel of Fig. 2, the relative amplitude of the to the and signals is 1 : 12 : 1.3. The mean free path determined from a Dingle analysis that describes damping of quantum oscillations by a homogeneous distribution of impurities is 270 nm, fully consistent with that deduced from the resistivity using the Fermi surface from ref. Tamai et al. (2008). Going into the nematic region, a naïve analysis of the resistivity would suggest that the mean free path halves Perry et al. (2004). Using the Dingle factor and taking into account the Bessel function factor associated with the field modulation technique Not (????d) we can calculate relative amplitudes for a reduced mean free path of 135 nm by extrapolating the amplitudes from just outside this region. This gives an amplitude ratio 1 : 8 : 0.5. The observed ratio (inset Fig. 2 main panel) is very different: 1 : 0.4 : 0. This strongly indicates that the assumption of uniform impurity scattering is no longer valid in the nematic region.
To explain this discrepancy we consider the existence of domains as discussed in refs. Grigera et al. (2004) and Borzi et al. (2007). In those studies we commented that the rise in resistivity in the nematic region for fields applied parallel to the -axis and the transport anisotropy seen in slightly tilted fields were both consistent with strong scattering at domain walls. For quantum oscillations this hypothesis implies that only frequencies due to orbits entirely within a single domain survive; therefore, the observed orbits can be used as real space callipers of the domain’s smallest linear dimension. The cyclotron diameters of the , and orbits are 270 nm, 385 nm and 580 nm respectively Not (????e), so the strong frequency dependence of the signal suppression suggests that the sample contains a distribution of domains with an average wall separation of order 500 nm. Estimating their linear dimension is an important step forward, and should motivate studies with probes capable of imaging them directly in real space.
The above analysis gives clues about the microscopic nature and mechanism of formation of the novel phase in Sr3Ru2O7, but the most important finding presented here is the discovery that quantum oscillations can be observed within it. Combined with the observation that the frequencies change across the metamagnetic region (Fig. 3) and recent Hall effect measurements showing that the Hall number does not drop on entry to the phase Borzi et al. (2009), our work provides strong evidence that the phase diagram of Sr3Ru2O7 is characterised by a series of fluid-fluid transitions. Further, the fluid in the nematic phase contains Landau Fermi liquid quasiparticles (Fig. 2) whose quantum oscillatory amplitude conforms to the prediction of the Lifshitz-Kosevich theory. Since dHvA is sensitive to Fermi surface areas and not to shape, this set of observations is compatible with any microscopic model postulating that the root of the nematic transport properties lies in a Pomeranchuk-like Fermi surface distortion.
In conclusion, we have succeeded in detecting quantum oscillations in the nematic phase of Sr3Ru2O7. Our results establish that at least some of the mobile charges in the phase are Landau quasiparticles, and also reveal the importance of a chemical potential shift and domain physics in understanding the phase’s formation and properties.
We thank A. M. Berridge, C. A. Hooley and G. G. Lonzarich for informative discussions, and A. S. Gibbs for providing crystals used to determine the conditions for sample equilibrium Not (????b). This work was supported by the Engineering and Physical Sciences Research Council.
References
- Kivelson et al. (1998) S. A. Kivelson, E. Fradkin, and V. J. Emery, Nature 393, 550 (1998).
- Lilly et al. (1999a) M. P. Lilly, et al., Phys. Rev. Lett. 82, 394 (1999a).
- Lilly et al. (1999b) M. P. Lilly, et al., Phys. Rev. Lett. 83, 824 (1999b).
- Pan et al. (1999) W. Pan, et al., Phys. Rev. Lett. 83, 820 (1999).
- Cooper et al. (2002) K. B. Cooper, et al., Phys. Rev. B 65, 241313(R) (2002).
- Ando et al. (2002) Y. Ando, et al., Phys. Rev. Lett. 88, 137005 (2002).
- Hinkov et al. (2008) V. Hinkov, et al., Science 319, 597 (2008).
- Dell’Anna and Metzner (2006) L. Dell’Anna and W. Metzner, Phys. Rev. B 73, 045127 (2006).
- Oganesyan et al. (2001) V. Oganesyan, S. A. Kivelson, and E. Fradkin, Phys. Rev. B 64, 195109 (2001).
- Fradkin et al. (2007) E. Fradkin, S. A. Kivelson, and V. Oganesyan, Science 315, 196 (2007).
- Yamase (2007) H. Yamase, Phys. Rev. B 76, 155117 (2007).
- Kee et al. (2003) H.-Y. Kee, E. H. Kim, and C.-H. Chung, Phys. Rev. B 68, 245109 (2003).
- Kee and Kim (2005) H.-Y. Kee and Y. B. Kim, Phys. Rev. B 71, 184402 (2005).
- Green et al. (2005) A. G. Green, et al., Phys. Rev. Lett. 95, 086402 (2005).
- Quintanilla et al. (2008) J. Quintanilla, M. Haque, and A. J. Schofield, Phys. Rev. B 78, 035131 (2008).
- Berridge et al. (2009) A. M. Berridge, et al., Phys. Rev. Lett. 102, 136404 (2009).
- Yamase (2009) H. Yamase, Phys. Rev. Lett. 102, 116404 (2009).
- Raghu et al. (2009) S. Raghu, et al., Phys. Rev. B 79, 214402 (2009).
- Lee and Wu (2009) W.-C. Lee and C. Wu, arXiv:0902.1337v2 (2009).
- Perry et al. (2004) R. S. Perry, et al., Phys. Rev. Lett. 92, 166602 (2004).
- Grigera et al. (2004) S. A. Grigera, et al., Science 306, 1154 (2004).
- Borzi et al. (2007) R. A. Borzi, et al., Science 315, 214 (2007).
- Rost et al. (2009) A. W. Rost, et al., Science Express p. 1176627 (2009), URL http://dx.doi.org/10.1126/science.1176627.
- Perry and Maeno (2004) R. S. Perry and Y. Maeno, J. Cryst. Growth 271, 134 (2004).
- Borzi et al. (2004) R. A. Borzi, et al., Phys. Rev. Lett. 92, 216403 (2004).
- Not (????a) To achieve this improvement, characterisation dHvA measurements were performed in St Andrews on 23 new crystals, studied between 6 and 7 T. Three of these gave an order of magnitude higher signal per gram than any of the crystals used in previous studies.
- Mercure et al. (2009) J.-F. Mercure, et al., arXiv:0909.1215v1 (2009).
- Shoenberg (1984) D. Shoenberg, Magnetic oscillations in metals (Cambridge University Press, Cambridge, 1984).
- Not (????b) The data below 90 mK in the Lifshitz-Kosevich fits were taken from a second set of runs, which used improved thermalization and longer wait times.
- Tamai et al. (2008) A. Tamai, et al., Phys. Rev. Lett. 101, 026407 (2008).
- Julian et al. (1992) S. R. Julian, P. A. A. Teunissen, and S. A. J. Wiegers, Phys. Rev. B 46, 9821 (1992).
- Not (????c) The frequencies may show either a peak or a dip depending on the details of the band structure, but the high field saturation will always be of the opposite sign, i.e. lower (higher) than .
- Not (????d) The Dingle factor reduction is calculated using the equation , where is the mean free path and the average Fermi wave vector, equal to , with the dHvA frequency. The Bessel function factor is , where is a Bessel function of the first kind of order 2, is the modulation field and is the dHvA frequency.
- Not (????e) The real space cyclotron orbit diameter values are found using , with T and defined as in Not (????d).
- Borzi et al. (2009) R. A. Borzi, et al., unpublished (2009).