Evidence for Induced Magnetization in Superconductor-Ferromagnet Hetero-structures: a Scanning Tunnelling Spectroscopy Study
Abstract
We performed scanning tunneling spectroscopy of c-axis oriented films on top of which ferromagnetic islands were grown epitaxially in-situ. When measured on the ferromagnetic islands, the density of states exhibits small gap-like features consistent with the expected short range penetration of the order parameter into the ferromagnet. However, anomalous split-gap structures are measured on the superconductor in the vicinity of ferromagnetic islands. This observation may provide evidence for the recently predicted induced magnetization in the superconductor side of a superconductor/ ferromagnet junction. The length scale of the effect inside the superconductor was found to be an order of magnitude larger than the superconducting coherence length. This is inconsistent with the theoretical prediction of a penetration depth of only a few superconducting coherence lengths. We discuss a possible origin for this discrepancy.
pacs:
74.25.Fy, 74.45.+c, 74.72.-h, 74.72.Bk, 74.78.Fk, 75.70.Cn, 68.37.EfI Introduction
Singlet pairing superconductivity and itinerant ferromagnetism are two competing orders. The interplay between these orders has been the focus of extensive experimental and theoretical works over the past years. In the vicinity of a high quality interface between a superconductor (S) and a ferromagnet (F) these two rival orders are forced to coexist and thus allow the direct investigation of their mutual influence. It is well established that in such proximity systems, superconducting correlations can penetrate into the ferromagnet and give rise to a rapid (nm scale) oscillatory decay of the induced order parameter (OP) in F as a function of the distance from the S/F interface. Buzdin review A much less studied aspect of the S-F proximity effect is the so called ”inverse proximity” effect. Here, fundamental questions arise: can ferromagnetic order penetrate the S and how will such a penetration affect superconductivity in the vicinity of the interface? This subject has been the focal point of recent theoretical works. Bergeret EPL66 ; Bergeret PRB70 ; Bergeret PRB69 ; Bergeret PRB72 ; Krivoruchko ; Kharitonov ; Halterman ; Cottet Although different approaches were used in these studies, all share the basic conclusion that a sizable magnetic moment should penetrate into the S side over the length scale of the superconducting coherence length (). The sign of this moment, its spatial behavior and the actual mechanism underlying this effect are still controversial. In general, according to the quasiclassical approach that was employed in references, Bergeret EPL66 ; Bergeret PRB70 ; Bergeret PRB69 ; Bergeret PRB72 ; Krivoruchko ; Kharitonov ; Halterman there are two possible profiles for the induced magnetic moment inside the S. We will refer to these as ”screening” and ”anti-screening” following the terminology that was used in references Bergeret EPL66 ; Bergeret PRB70 . In the screening profile, the direction of the induced magnetic moment inside the S is anti-parallel to the magnetization of F whereas in the anti-screening scenario it is parallel. For a specific S/F bilayer, the sign of the induced magnetic moment inside the S is influenced by several parameters: the strength of the exchange field in F, the interface transparency, the thickness of the F layer, the sign of the spin polarization in F (the relative spin-polarization at the Fermi surface with respect to the overall magnetization) and whether the system is in the clean or diffusive limit. A change in one of these parameters will lead to a change in the amplitude and even the sign of the induced magnetic moment inside the S. In both scenarios, the induced magnetic moment in S is predicted to decay monotonically as a function of distance from the interface over the length-scale of . A different picture is presented in Ref. Krivoruchko in which the magnitude and sign of the induced magnetization in S exhibits a damped oscillatory behavior versus distance from the S/F interface on a scale of . According to Refs. Bergeret EPL66 ; Bergeret PRB70 ; Bergeret PRB69 ; Bergeret PRB72 ; Halterman , the induction of a magnetic moment inside the S in such proximity systems is related to the existence of an induced triplet pairing component at the S/F interface. The possible formation of such a triplet pairing component at the interface, its nature and its experimental identification are one of the open issues in the field. A different approach to the proximity effect in diffusive S/F hybrids was employed by Cottet, where the spin dependence of the phase shifts (SDIPS) acquired by electrons upon scattering on the boundaries of the F layer are taken into account. Cottet These SDIPS generate an effective magnetic field in a diffusive S in contact with a diffusive F, leading to the appearance of double gap structures in the density of states (DOS) of both the S and F. Within the terminology used above, this mechanism leads to the anti-screening profile.
In general, in an S-F proximity system, the superconducting gap is suppressed in the vicinity of the interface and recovers its original value at a distance of a few from the interface. Krivoruchko ; Buzdin review An induced magnetic moment inside the S should further modify the DOS. Specifically, the DOS is predicted to spin-split at a distance of a few away from the interface. Cottet ; Krivoruchko ; Halterman ; Bergeret PRB72 In the anti-screening profile (and assuming a positively spin-polarized F layer), the majority spins will be shifted to lower energies and the minority spins will shift to higher energies. The opposite process will occur in the screening scenario, i.e., the majority spins will shift to higher energies and the minority to lower energies. The magnitude of this energy shift should be proportional to the induced moment or the effective exchange field developed inside the S. Therefore, split-gap structures or split bound states, measured in the DOS of the S side near the interface, may provide evidence for an induced magnetic moment. Moreover, the nature of this splitting holds important information regarding the sign of the induced magnetic moment inside the S. Bergeret PRB72
All of the above theoretical works deal with conventional s-wave superconductors. To the best of our knowledge, there are no theoretical predictions regarding the nature of this effect in the high- cuprate superconductors. Specifically, it is still unclear how the d-wave symmetry, the short coherence length and the comparable scale of the superconducting gap and the exchange energy in such hetero-structures, will influence the induced magnetization phenomena.
So far, only a few experimental works have identified possible evidence for the induced magnetization effect. Stahn et. al. Stahn studied multilayers of and using neutron reflectometry and provided evidence for the screening profile. On the other hand, the magnetization data of Stamopoulos et. al. Stamopoulos measured on Nb-manganites hybrids suggest anti-screening. A very recent paper reports measurements of the polar Kerr effect in Pb/Ni and Al/(Co-Pd) proximity systems and provides evidence for the screening scenario. Palevski Actually, one cannot argue that these experiments contradict each other since one can not compare all the system parameters that influence the sign of the induced magnetic moment that were mentioned above. To the best of our knowledge, the effect of induced magnetization on the DOS of the S was not observed so far, and this is the main focus of this paper.
Previously, we performed tunneling spectroscopy measurements on (SRO) ferromagnetic islands that were deposited on nodal (110) (YBCO) surfaces. Asulin We found that the zero bias conductance peak (ZBCP), the typical spectral feature measured on the nodal YBCO surface, undergoes an anomalous splitting when measured on the F islands. We attributed this effect to an induced magnetic moment in the S layer. However, this is not yet a direct demonstration of the effects of the induced magnetization on the DOS of S. In the present work we focus on identifying signatures of induced magnetic moment directly in the DOS of the S. We have performed scanning tunneling spectroscopy of c-axis oriented YBCO films on top of which SRO islands were deposited in-situ. We have detected an anomalous splitting of the superconducting gap feature in the DOS of S when measured in the vicinity of an F island. The maximal observed energy split, of about 5 meV, cannot be accounted for by an effect of stray field emanating from the SRO crystallites, but rather fits the scale of the SRO exchange energy. Surprisingly, we found that the spatial extent of this effect inside the S layer exceeds the YBCO coherence length by an order of magnitude.
II Experiment
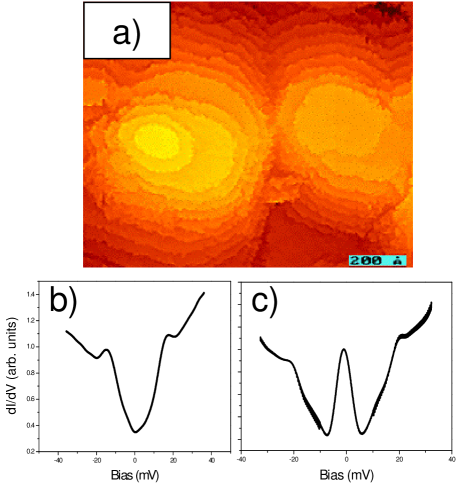
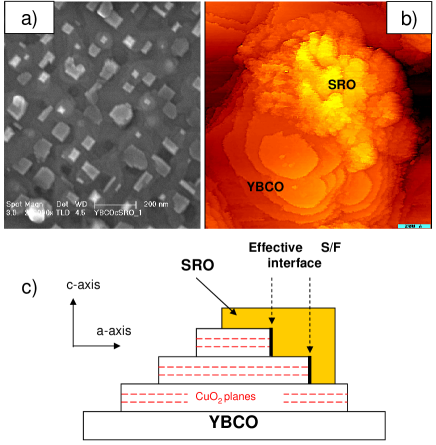
Optimally-doped epitaxial c-axis oriented YBCO films were grown by laser ablation deposition on (100) substrates. In order to achieve a c-axis orientation of the films, the YBCO was grown at a substrate temperature of C and a 100 mT oxygen flow ambient. The films were cooled down in 0.5 atm of oxygen pressure, with a dwell of 1 hour at C. Figure 1a presents a scanning tunneling microscope (STM) image of a bare c-axis oriented film. The morphology of these films features stacks of single c-axis unit-cell YBCO layers that form terrace-shaped structures. These structures may emanate from a screw dislocations growth mode. Wiesendanger The bare c-axis films showed a superconducting transition at K, implying slightly under-doped films, which is apparently due to some oxygen loss from the surface. SRO islands were grown epitaxially in-situ on top of these c-axis surfaces and under the same deposition conditions as for the bare YBCO films. SRO is an itinerant ferromagnet with a Curie temperature of about 150 K for thin films. The similar lattice parameters of SRO and YBCO Zakharov facilitates epitaxial growth of hetero-structures with a relatively high interface transparency. Figure 2a presents a scanning electron microscope (SEM) image of a 0.5 nm thick (nominal) SRO layer over-coating a bare c-axis YBCO film, illustrating the typical size and distribution of the SRO islands (the bright rectangular crystallites). Their typical size ranges between 50 and 100 nm and so is the spacing between them. The thickness of the islands ranged between 2 and 4 SRO unit cells. The STM image in Fig. 2b (obtained on the same sample) reveals how the SRO islands are located on top of the bare c-axis YBCO terraces, each contacting several terraces beneath it. This is also illustrated in a 2-dimentional model of the system sketched in Fig. 2c. The STM data presented here were all acquired at 4.2 K, much lower than both the superconducting and ferromagnetic transition temperatures, using a (normal metal) Pt-Ir tip. The samples were transferred from the growth chamber in a dry atmosphere and introduced into our cryogenic STM after being exposed to ambient atmosphere for less than 2 minutes.
III RESULTS AND DISCUSSION
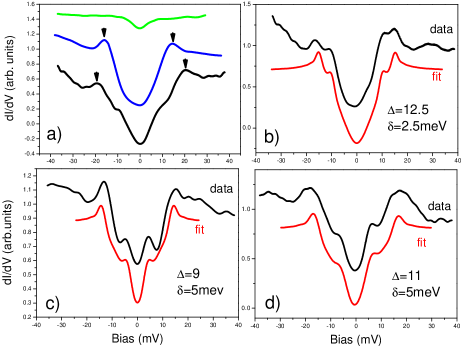
The DOS of the bare c-axis YBCO films featured mainly V-shaped gaps with a maximum value of , as seen in Fig. 1b. Less frequently, a ZBCP inside a gap structure was observed, as depicted in Fig. 1c, reflecting a contribution of a nodal (110) facet. These spectral features follow the known dependence of the tunneling spectra on the local relative orientation of the d-wave OP and the normal to the surface. Kashiwaya ; Amos EPL In a bilayer consisting of a high cuprate S and a normal metal, the anisotropy of the d-wave OP is manifested also in the proximity effect. It is well established that in such proximity systems, the penetration of the OP into the normal metal is enabled primarily along the planes and not along the c-axis direction [see Ref. Amos PRL and references therein]. Therefore, the proximity coupling between the S and the F islands in our samples takes place mainly at the edges of the YBCO terraces where the planes are exposed. These edges constitute the most effective S/F interfaces in our system and are marked by the bold black lines in the scheme of Fig. 2c. The superconductor OP is expected to penetrate into the F islands predominantly across these interfaces. Indeed, small gap-like features with a very high zero-bias conductance were typically measured in the DOS of the F islands as apparent in the upper green curve of Fig. 3a. This is consistent with the conventional picture of a short-range penetration of the OP into the F side in S/F bilayers. Buzdin review We have also measured the DOS on the YBCO surface next to the SRO islands. This is equivalent to measuring the S side of an S/F interface, where the most relevant length-scale here is the distance from the above effective S/F interfaces and the point of measurement. Far enough from the interface, for example at a distance of 30 nm, V-shaped gaps resembling those found on the bare YBCO films were measured (middle curve in Fig. 3a).
Interestingly, however, the DOS in close vicinity to the SRO islands featured a split-gap structure as depicted by the black curves in Figs. 3a-d. The amplitude of the split, , taken as half the distance between the measured outer and inner peaks (and also extracted from the fits discussed below), reaches a maximum of 5 meV. Such a large split cannot be explained by an effect of stray field emanating from the SRO crystallites. The maximal stray field in the vicinity of an SRO crystallite cannot exceed 0.2 Tesla. Klein APL1 ; Klein APL2 In order to achieve energy shifts of a few meV, as observed here, a magnetic field that is at least an order of magnitude larger is required. On the other hand, the above energy scale of a few meV is of the order of the exchange energy in SRO that is estimated to be . This value thus sets the upper limit for the magnitude of the split at meV. We would like to emphasize that the observed splitting is clearly an effect related to the existence of the nearby F islands and is absent in the bare c-axis films. Following the above considerations, we attribute these split-gap structures to the effect of an induced magnetic moment inside the S, consistent with the above theoretical prediction of the splitting of the DOS. Cottet ; Krivoruchko ; Halterman ; Bergeret PRB72 The red lower curves in Figs. 3b,c,d are fits to a phenomenological model that takes into account the basic important physical ingredients of the problem. Here, the total tunneling conductance is given by
| (1) |
where are given by the extended BTK formalism Kashiwaya for tunneling into a d-wave S, is an exchange-field induced splitting parameter and P is a spin-polarization factor for the electrons population. The latter parameter was found to be significantly smaller compare to the values inside the SRO islands (see below). Clearly, the main features of these split-gap structures are nicely reproduced. The unsplit gap values, , (specified in Figs. 3b,c,d) are smaller than the pristine gap value measured on the bare c-axis films. This corresponds to the reduction of the OP at the S side near the S/F interface mentioned above. Nevertheless, for specific combinations of and , the energy position of outer coherence peaks of the split gaps can exceed that of the pristine gaps () as depicted in the black curve in Fig. 3a. This point will be further discussed below.
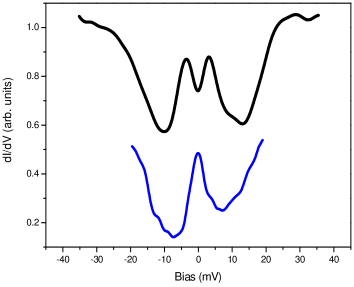
The effect of the induced magnetization also manifested in the splitting of the less-abundantly observed ZBCP (black curve of Fig. 4) measured in the vicinity of SRO islands. The maximum split amplitude for the ZBCP was also about 5 meV. This value coincides with the largest split amplitude that we observed in our previous work on SRO islands deposited on (110) YBCO films. Asulin However, the two peaks of the split ZBCPs that were observed here were almost of the same height, in contrast to the large asymmetry observed in our previous work. Asulin This is due to the much larger polarization of the SRO islands compared to the small polarization originating from the induced magnetization inside the YBCO. Indeed, a small polarization factor of is required in the fits we made for the measured split-gaps in Figs. 3b,c,d.
We note that based on our data, we cannot determine the sign of the induced magnetic moment. To that end, a spin polarized STM is required in order to detect whether the majority (or minority) of spins were shifted to higher or lower energies. In addition, further experiments are needed in order to resolve the open question regarding the existence of triplet superconductivity near the interface.
Surprisingly, the distance from the SRO islands over which the split-gap and ZBCP features are observed, is an order of magnitude larger than in YBCO, which is estimated to be 2-3 nm along the planes. Segawa Only at a distance of about 30 nm away from any identifiable SRO island, the gap seems to recover its full value and does not appear to be split (middle blue curve in Fig. 3a taken at a distance of 30 nm away from the nearest SRO island). The same holds for the ZBCP where the split vanishes over a comparable length scale (the blue curve in Fig. 4 was obtained at a distance of 25 nm away from an SRO island). This is inconsistent with the theoretically predicted penetration length of the induced magnetic moment in S, of only a few away from the S/F interface. One possible explanation for this discrepancy is the existence of another relevant length scale, that of the spin diffusion length. If a spin imbalanced population of electrons is formed inside S in close vicinity to the S/F interface, it is expected to loose its polarization at a distance comparable to the spin diffusion length. In a conventional S, this length scale is much shorter than the coherence length (e.g. a few 100 nm in Al). Therefore, the physical size of the Cooper pairs, , will determine the effective penetration length of the induced magnetic moment and spin diffusion will not play a role in this problem. Bergeret PRB69 However, if the spin diffusion length is larger than the coherence length, one would expect that the imbalance in the spin population would be ’felt’ by the S up to distances that are larger than . This is indeed the case in YBCO for which the spin diffusion length was estimated to range between 10 and 15 nm along the c-axis Soltan ; Pena , much larger than in YBCO that is estimated to be 2-3 nm. One can expect that along the planes the spin diffusion length will be even larger and account for the penetration length of the effect that is observed in our experiment.
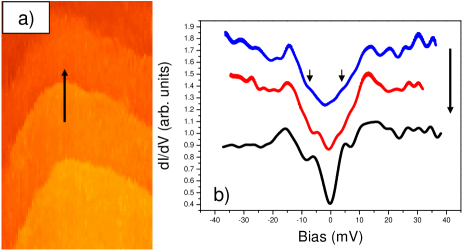
The splits were most pronounced in the vicinity of the YBCO terrace edges that expose the planes. Figure 5a presents an STM image that zooms in on an YBCO surface in between SRO islands and features these terraces. The spectra presented in Fig. 5b were acquired along the black arrow marked in Fig 5a. When the DOS was measured on top of the terrace (upper curve in Fig. 5b), only a weak signature of the split is observed inside the gap (marked by arrows). When measured closer to the terrace edge, the split becomes more pronounced, as evident from the lower two curves. This is because in that case the STM tip coupling to the planes, along which spin diffusion takes place, is more effective. Moreover, the coupling to the nodal gapless excitations is smaller on a terrace edge, thus the smearing of in-gap structures (the inner peaks in our case) is reduced. Sharoni PRB65 ; SharoniEPL62
One can argue that the split gaps that we observed result from the existence of a sub-dominant OP in our system. Indeed, double gap structures were previously observed on Ca-doped YBCO surfaces and were considered to originate from a sub-dominant OP. Sharoni PRB65 However, this sub-dominant OP starts to emerge at the optimal doping level of YBCO and is prominent only in the over-doped regime Sharoni PRB65 ; Dagan achieved effectively by Ca-doping. Our bare c-axis samples were slightly under-doped and do not show these double-gap features as mentioned above. Moreover, a sub-dominant OP should only manifest itself as a sub-gap structure and is not expected to shift the original coherence peaks to larger values. In our measurements, in contrast, the outer coherence peaks achieved values of up to 20 meV, which is higher than the maximal value observed on the bare YBCO films (17 meV), as shown in Fig. 3a. In addition, if interpreted by a sub-dominant OP, the position of the inner peaks in our data correspond to an anomalously large sub-dominant OP (more than 50 of the YBCO gap), which is highly unlikely.
IV summary
In conclusion, our scanning tunneling spectroscopy measurements show an anomalous splitting of the gap and ZBCP features when measured on the YBCO high superconductor near the interface with the itinerant ferromagnet SRO. The large split magnitude, of up to 5 meV, can not be explained by an effect of stray magnetic fields emanating from the SRO islands but is rather in accord with the energy scale of the exchange field in SRO. These findings are consistent with the recently predicted induced magnetization effect in superconductor ferromagnet junctions and constitute, to the best of our knowledge, the first observation of its manifestation in the DOS of the superconductor.
V Acknowledgments
We thank G. Deutscher, D. Orgad and L. Klein for helpful discussions. This work was supported by the Israel Science Foundation, Center of Excellence program, (grant # 481/07) and by the German-Israeli Project Cooperation (DIP). O. M. acknowledges the Harry deJur chair of applied sciences at the Hebrew University and G. K. acknowledges the Karl Stoll chair in advanced materials at the Technion.
References
- (1) A. I. Buzdin, Rev. Mod. Phys. Phys. 77, 935 (2005).
- (2) F. S. Bergeret, A. F. Volkov and K. B. Efetov, Europhys. Lett. 66, 111 (2004).
- (3) F. S. Bergeret and N. García, Phys. Rev. B. 70, 052507 (2004).
- (4) F. S. Bergeret, A. F. Volkov and K. B. Efetov, Phys. Rev. B. 69, 174504 (2004).
- (5) F. S. Bergeret, A. Levy Yeyati and A. Martín-Rodero, Phys. Rev. B. 72, 064524 (2005).
- (6) V. N. Krivoruchko and E. A. Koshina Phys. Rev. B. 66, 014521 (2002).
- (7) M. Yu. Kharitonov, A. F. Volkov and K. B. Efetov, Phys. Rev. B. 73, 054511 (2006).
- (8) Klaus Halterman, Oriol T. Valls and Paul H. Barsic, Phys. Rev. B. 77, 174511 (2008).
- (9) Audrey Cottet, Phys. Rev. B. 76, 224505 (2007).
- (10) J. Stahn, J. Chakhalian, Ch. Niedermayer, J. Hoppler, T. Gutberlet, J. Voigt, F. Treubel, H-U. Habermeier, G. Cristiani, B. Keimer and C. Bernhard, Phys. Rev. B. 71, 140509(R) (2005).
- (11) D. Stamopoulos, N. Moutis, M. Pissas and D. Niarchos, Phys. Rev. B. 72, 212514 (2005).
- (12) Jing Xia, V. Shelukhin, M. Karpovski, A. Kapitulnik and A. Palevski, cond. mat. 0810.2605v1 (2008), to be published in Phys. Rev. Lett.
- (13) Itay Asulin, Ofer Yuli, Israel Felner, Gad Koren and Oded Millo, Phys. Rev. B. 76, 064507 (2007).
- (14) R. Wiesendanger, Scanning Probe Microscopy and Spectroscopy pp. 404 (Cambridge University Prss, 1994).
- (15) N. D. Zakharov, K. M. Satyalakshmia, G. Koren and D. Hesse, J. Mater. Res. 14, 4385 (1999).
- (16) Satoshi Kashiwaya, Yukio Tanaka, Masao Koyanagi and Koji Kajimura, Phys. Rev. B. 53, 2667 (1996).
- (17) A. Sharoni, G. Koren and O. Millo, Europhys. Lett., 54, 675 (2001).
- (18) A. Sharoni, I. Asulin, G. Koren and O. Millo, Phys. Rev. Lett. 92, 017003 (2004).
- (19) L. Klein, J. S. Dodge, T. H. Geballe, A. Kapitulnik, A. F. Marshall, L. Antognazza and K. Char, Appl. Phys. Lett. 66, 2427 (1995).
- (20) M. Feigenson, L. Klein, M. Karpovski, J. W. Reiner and M. R. Beasley, Appl. Phys. Lett. 97, 10J120 (2005).
- (21) Yoichi Ando and Kouji Segawa, Phys. Rev. Lett. 88, 167005 (2002).
- (22) S. Soltan, J. Albrecht, and H.-U. Habermeier, Phys. Rev. B. 70, 144517 (2004).
- (23) V. Peña, C. Visani, J. Garcia-Barriocanal, D. Arias, Z. Sefrioui, C. Leon, J. Santamaria and Carmen A. Almasan, Phys. Rev. B. 73, 104513 (2006).
- (24) A. Sharoni and O. Millo A. Kohen, Y. Dagan, R. Beck, G. Deutscher and G. Koren, Phys. Rev. B. 65, 134526 (2002).
- (25) A. Sharoni, G. Leibovitch, A. Kohen, R. Beck, G. Deutscher, G. Koren and O. Millo, Europhys. Lett. 62,883 (2003).
- (26) Y. Dagan and G. Deutscher, Phys. Rev. Lett. 87, 177004 (2001).