L-Band Spectra of 13 Outbursting Be Stars
Abstract
We present new L-band spectra of 13 outbursting Be stars obtained with ISAAC at the ESO Paranal observatory. These stars can be classified in three groups depending on the presence/absence of emission lines and the strength of Br and Pf emission lines relative to those of Humphreys lines from transitions 6–14 to the end of the series. These groups are representative of circumstellar envelopes with different optical depths. For the group showing Br and Pf lines stronger than Humphreys lines, the Humphreys decrement roughly follow the Menzel case-B for optically thin conditions. For the group showing comparable Br, Pf and Humphreys emission line strengths, the Humphreys decrements moves from an optically thin to an optically thick regime at a transition wavelength which is characteristic for each star, but typically is located around 3.65–3.75 m (transitions 6–19 and 6–17). Higher order Humphreys lines probe optically thin inner regions even in the optically thicker envelopes. We find evidence of larger broadening in the infrared emission lines compared with optical lines, probably reflecting larger vertical velocity fields near the star. The existence of the aforementioned groups is in principle consistent with the proposed description by de Wit et al. (2006) for Be star outbursts in terms of the ejection of an optically thick disk that expands and becomes optically thin before dissipation into the interstellar medium. Time resolved L-band spectroscopy sampling the outburst cycle promises to be an unique tool for testing Be star disk evolution.
1 Introduction
Be stars are rapidly rotating dwarf or giant B type objects that show or have once shown emissions in the H line (Jaschek & Jaschek, 1987). Classical Be stars have moderate infrared excesses that originate in the free-free and free-bound emission from ionized circumstellar gas (Gehrz, Hackwell & Jones, 1974; Waters, 1986). Interferometric studies have shown that this gas is concentrated towards the equatorial plane forming a dense disk-like envelope extending extending up to 10 stellar radii from the stellar surface (Grundstrom & Gies 2006, Quirrenbach et al. 1994, Stee et al. 1995). The IR region is dominated by broad and bright emission lines arising from high levels of hydrogen atoms (Briot, 1981; Andrillat, Jaschek, & Jaschek, 1988; Lenorzer et al., 2002a). He I, Mg II and Na I emission lines in the K-band have also been reported (Clark and Steele 2000). The IR line optical depths and line flux ratios display a large variation from star to star (Persson & McGregor, 1985) and do not correlate with the spectral type (Lenorzer et al., 2002a). Be stars are also intrinsically variable, some of them show mild periodic or irregular photometric variability (Mennickent, Vogt & Sterken 1994, Sterken, Vogt & Mennickent 1996), whereas others show sudden brightenings usually attributed to mass ejections from the surface of the stars, which can occur discretely over a range of timescales (Hubert, Floquet & Zorec 2000, Mennickent et al. 2002, de Wit et al. 2006). These outbursts probably induce variability in the opacity, the size and the geometry of the circumstellar envelope. Thus our aim is to explore the physical properties of envelopes of outbursting Be stars. To our purpose, we selected for an infrared spectroscopic study 6 Galactic Be stars showing long-lived outbursts (duration several hundred days) and 7 showing short-lived outbursts (duration days or tens of days) from the list of Hubert, Floquet & Zorec (2000). The stars were selected spanning a wide range of projected rotational velocities and most of them have been rarely studied spectroscopically. We hope contributing to the knowledge of the L-band spectral region in Be stars and its relation with the circumstellar envelope, which have been hitherto scarcely studied.
2 Observations and data reduction
| Object | N | slit | exptime | airmass | seeing | MJD | Q | |
|---|---|---|---|---|---|---|---|---|
| [″] | [s] | [″] | ||||||
| V1448 Aql | 20 | 0.3 | 1.85 | 1.3 | 0.6 | 52789.3411-52789.3726 | G | |
| V1448 Aql | 6 | 2.0 | 0.28 | 1.2 | 0.7 | 52789.2966-52789.3046 | N | |
| V518 Car | 4 | 0.3 | 1.85 | 1.5 | 0.7 | 52789.0671-52789.0914 | G | |
| V518 Car | 2 | 2.0 | 0.28 | 1.7 | 0.8 | 52789.1062-52789.1078 | N | |
| V767 Cen | 2 | 2.0 | 0.28 | 1.7 | 0.7 | 52860.0731-52860.0746 | G | |
| V817 Cen | 2 | 0.3 | 1.85 | 1.7 | 0.8 | 52847.0313-52847.0329 | G | |
| V817 Cen | 2 | 2.0 | 0.28 | 2.0 | 0.9 | 52847.0525-52847.0540 | G | |
| Cen | 2 | 2.0 | 0.28 | 1.7 | 1.0 | 52859.0684-52859.0700 | G | |
| Cen | 2 | 0.3 | 0.28 | 1.6 | 0.9 | 52859.0622-52859.0639 | G | |
| CP Cir | 4 | 0.3 | 1.85 | 1.6 | 0.7 | 52788.2476-52788.2526 | G | |
| CP Cir | 2 | 2.0 | 0.28 | 1.4 | 0.8 | 52788.2127-52788.2303 | N | |
| CP Cir | 2 | 2.0 | 0.28 | 1.6 | 0.6 | 52788.2643-52788.2659 | N | |
| KV Mus | 20 | 0.3 | 1.85 | 1.9 | 0.7-1.0 | 52858.9951-52859.0246 | N | |
| OZ Nor | 2 | 2.0 | 0.28 | 1.1 | 0.9 | 52789.2050-52789.2066 | G | |
| OZ Nor | 2 | 0.3 | 1.85 | 1.8 | 0.9 | 52790.3767-52790.3784 | G | |
| V457 Sct | 20 | 0.3 | 1.85 | 1.1 | 0.7 | 52788.3288-52788.3603 | G | |
| V457 Sct | 8 | 2.0 | 1.85 | 1.2 | 1.1 | 52789.2186-52789.2297 | N | |
| V341 Sge | 4 | 0.3 | 1.85 | 1.5 | 0.4 | 52789.3885-52789.3918 | G | |
| V341 Sge | 2 | 2.0 | 0.28 | 1.4 | 0.7 | 52789.3138-52789.3155 | G | |
| V4024 Sgr | 2 | 2.0 | 0.28 | 1.0 | 0.7 | 52789.2791-52789.2806 | G | |
| V4024 Sgr | 2 | 0.3 | 1.85 | 1.8 | 0.8 | 52790.3921-52790.3937 | G | |
| V1150 Tau | 16 | 0.3 | 1.85 | 1.2 | 1.0-1.4 | 52886.4000-52886.4232 | G | |
| V1150 Tau | 6 | 2.0 | 0.28 | 1.5 | 0.8 | 52887.3249-52887.3324 | G | |
| V395 Vul | 2 | 2.0 | 0.28 | 1.5 | 0.7 | 52789.3258-52789.3274 | G | |
| V395 Vul | 2 | 0.3 | 1.85 | 1.7 | 0.8 | 52790.4069-52790.4086 | G |
L-band spectra were obtained with the VLT Infrared Spectrometer and Array Camera (ISAAC, Moorwood et al. 1998) at the ESO Cerro Paranal Observatory in service mode during the nights of may 28–30, july 26, august 7–8 and september 3–4, 2003. The mode long slit low resolution spectroscopy was selected along with a central wavelength of 3.5 m. The pixel scale was 0.146 ″/pixel. Two different setups were used, a narrow slit of 0.3″ and other of 2″, providing resolving power of 1200 and 180, respectively. As our targets are bright, we had to use very short exposure times (0.3–2s) so that the detector does not become saturate; this had no effect on the total number of counts recorded, since the exposure time is controlled by the detector and no shutter geometrical bias is involved during the photon acquisition. Images were reduced with the ISAAC pipeline. The spectra were telluric corrected with the aid of early G-type telluric standards observed during the run at similar airmasses that science objects using the procedure described in Maiolino, Rieke & Rieke (1996). We built our telluric templates by dividing the telluric spectra by a synthetic solar-type spectrum interpolated at the same resolution and wavelength range. Then, we used the IRAF111IRAF is distributed by the National Optical Astronomy Observatories, which are operated by the Association of Universities for Research in Astronomy, Inc., under cooperative agreement with the National Science Foundation. telluric task to remove telluric absorption lines from the science objects. The telluric bands were successfully removed from our spectra, except in some cases in the wavelengths short-ward of 3.4 m, characterized by heavy and variable atmospheric absorption. Nevertheless, it has minor importance since the spectral lines used in this work are mostly located out of this region. The spectra taken with the wide slit were flux calibrated with the aid of the standard star BS5471 (spectral type B3V), whose L magnitude is known. Those spectra taken with the narrow slit were continuum normalized. The observing log given in Table 1 indicates the number of spectra per object, single spectra exposure times and some additional observational parameters.
3 Results
The L-band IR spectral region, between 3.0 m and 4.1 m, displays Br, Pf, Pf, Pf and most of Humphreys’ lines from transition 614 to the end of the series. Weak He I 4.038-4.041 m emission is observed in Cen, OZ Nor, V 4024 Sgr and V 1150 Tau. Although the blue region was discarted by not providing a confident telluric substraction, we do observe Pf and Pf emission in OZ Car, V 817 Cen and V 1150 Tau. The emission line spectra look similar to those of Be stars with irregular photometric variability, like Cas (Hony et al. 2000). According to the intensity of the emission lines, the sample of 13 Be stars can be classified in three groups: those with Br and Pf emissions equally intense as Humphreys’ lines (Group I, gathered in Fig. 1); those with Br and Pf emissions more intense than Humphreys’ lines (Group II, see Fig. 2), and those where no line emission is detected (Group III, Fig. 3). In this scheme, V 1150 Tau could be a transition object between Group I and II. All stars show blue continua, and Cen is notable for showing a break in the continuum slope around = 3.9 m, which we attribute to an instrumental effect that should not affect our measurements of line intensity relative to the continuum and emission line widths.


L magnitudes were computed by convolution of the spectra obtained with the slit of 2″ with the transmission curve of the L filter given by Bessell & Brett (1988). As part of the spectrum of Cen was corrupted and for KV Mus we had only one spectrum taken with the narrow slit (0.3″) which shows no emission lines, no magnitude determinations were possible for these stars. In Table 2 we list the L magnitudes, the fundamental parameters of the program stars and their classification in the aforementioned groups. The values were taken from Hubert, Floquet & Zorec (2000), Glebocki & Stawikowski (2000), Yudin (2001) and Frémat et al. (2006).
Some of our stars were too bright to determine the outburst stage (outburst/quiescence) from reliable ASAS-3 V-band light curves (Pojmański, 2001) at the epoch of our L-band spectroscopy. Others were not included in such a catalog. The exception was OZ Nor, that was observed near maximum at the time of the L band spectroscopy. The H spectrum of V 395 Vul taken in may 23, 2003 and of V 4024 Sgr taken in may 29, 2003, suggest that our IR observations for these stars were obtained during minimum and maximum H emission, respectively (http://astrosurf.com/buil/becat/).
Line fluxes, full width at half maximum () and equivalent widths, measured in the narrow slit spectra using the splot IRAF task, vary strongly from star to star. In Table 3 we list these parameters for the stars showing emission lines (groups I and II).
| object | L | TK | S.T. | Note | Ref. | ||||
| V1448 Aql | 7.66 | 20 000 | 3.80 | B2 IVe | 243 | 0.124 | III/s | a | |
| V518 Car | 5.31 | 18 700 | – | B3-5 Ve | 130 | 0.043 | III/l | c | |
| Cen | – | 23 130 | 4.04 | B2 IV-Ve | 155 | – | II/s | d | |
| V767 Cen | 5.66 | 23 320 | 3.95 | B3 IIIe | 70 | 0.224 | I/s | d | |
| V817 Cen | 5.25 | 17 490 | 3.12 | B3 IVe | 130 | 0.178 | I/s | b | |
| CP Cir | 8.00 | 15 000 | – | B5 IVe | – | 0.005 | III/l | c | |
| KV Mus | – | 18 700 | – | B3 Ve | – | 0.057 | III/l | c | |
| OZ Nor | 5.64 | 20 300 | – | B2 Ve | 86 | 0.259 | I/l | c | |
| V457 Sct | 7.82 | 23 000 | 3.80 | B1.5 IVe | 202 | 0.306 | III/s | a | |
| V341 Sge | 7.58 | 22 000 | – | B2.5 Ve | 115 | 0.105 | II/s | c | |
| V4024 Sgr | 4.85 | 18 940 | 3.49 | B2 Ve | 120 | 0.113 | I/l | d | |
| V1150 Tau | 7.25 | 22 000 | – | B2.5 Ve | 340 | 0.323 | I/l | c | |
| V395 Vul | 5.36 | 17 790 | 3.93 | B2.5 Ve | 230 | 0.134 | II/s | d | |
| (a) and (b) from Frémat et al. (2005,2006) | |||||||||
| (c) from Wright et al. (2003);(d) from Zorec et al. (2005) | |||||||||
| object | ||||||||||
|---|---|---|---|---|---|---|---|---|---|---|
| Cen | 5.46E-11 | 2.32E-11 | 1.03E-11 | 82.8 | 25.8 | 16.0 | 512 | 370 | 447 | |
| V767 Cen | 9.73E-12 | 1.17E-11 | 9.25E-12 | 28.3 | 21.5 | 24.7 | – | - - | – | 3.65 |
| V817 Cen | 1.62E-11 | 1.26E-11 | 1.23E-11 | 24.9 | 17.2 | 22.7 | 277 | 399 | 357 | 3.65 |
| OZ Nor | 1.28E-11 | 9.50E-12 | 9.38E-12 | 35.0 | 16.5 | 23.3 | 238 | 288 | 267 | 3.75 |
| V341 Sge | 3.41E-12 | 1.47E-12 | 6.80E-13 | 57.0 | 17.7 | 11.6 | 136 | 145 | 128 | |
| V4024 Sgr | 1.99E-11 | 2.23E-11 | 1.84E-11 | 23.3 | 15.9 | 19.8 | 356 | 327 | 325 | 3.75 |
| V1150 Tau | 5.91E-12 | 5.28E-12 | 4.04E-12 | 72.6 | 44.2 | 40.0 | 350 | 556 | 567 | 3.75 |
| V395 Vul | 1.06E-11 | 7.88E-12 | 5.58E-12 | 24.3 | 14.3 | 9.9 | 538 | 554 | 484 |
| Line | A (km/s) | B | R | (km/s) | N | rejected | source |
| Pf | 1.120.25 | 21849 | 0.83 | 52 | 6 | 1 | a |
| Hu14 | 1.120.20 | 20939 | 0.89 | 41 | 6 | 1 | a |
| Hu15 | 1.620.55 | 163103 | 0.63 | 120 | 7 | 0 | a |
| Hu16 | 2.040.33 | 4861 | 0.89 | 71 | 7 | 0 | a |
| Hu21 | 0.680.09 | 36318 | 0.95 | 19 | 5 | 0 | a |
| H | 1.23 | 70 | - | - | 115 | 0 | b |
| H+Fe II | 1.2 | 30 | - | - | 90 | 0 | b |
| Br | 0.759 | 149 | - | - | 39 | 0 | c |
| He I 2.058 | 0.643 | 247 | - | - | 19 | 0 | c |
| (a) this paper, (b) Hanuschik 1989, (c) Clarke & Steele 1999 | |||||||

4 Discussion
4.1 Kinematical issues
Our line width accuracy is limited by the instrumental resolution, the signal to noise ratio of the spectra and the determination of the continuum level.
We estimate the error
of the full width at half maximum ()
of the emission lines (corrected by the instrumental resolution and measured in the narrow slit spectra)
to be 40 km/s. On the other hand, the values given in the literature are usually accurate
to less than 10%, although for fast rotators the values could be underestimated by larger amounts (Townsend, Owocki & Howarth 2004). Keeping in mind these caveats, we observe
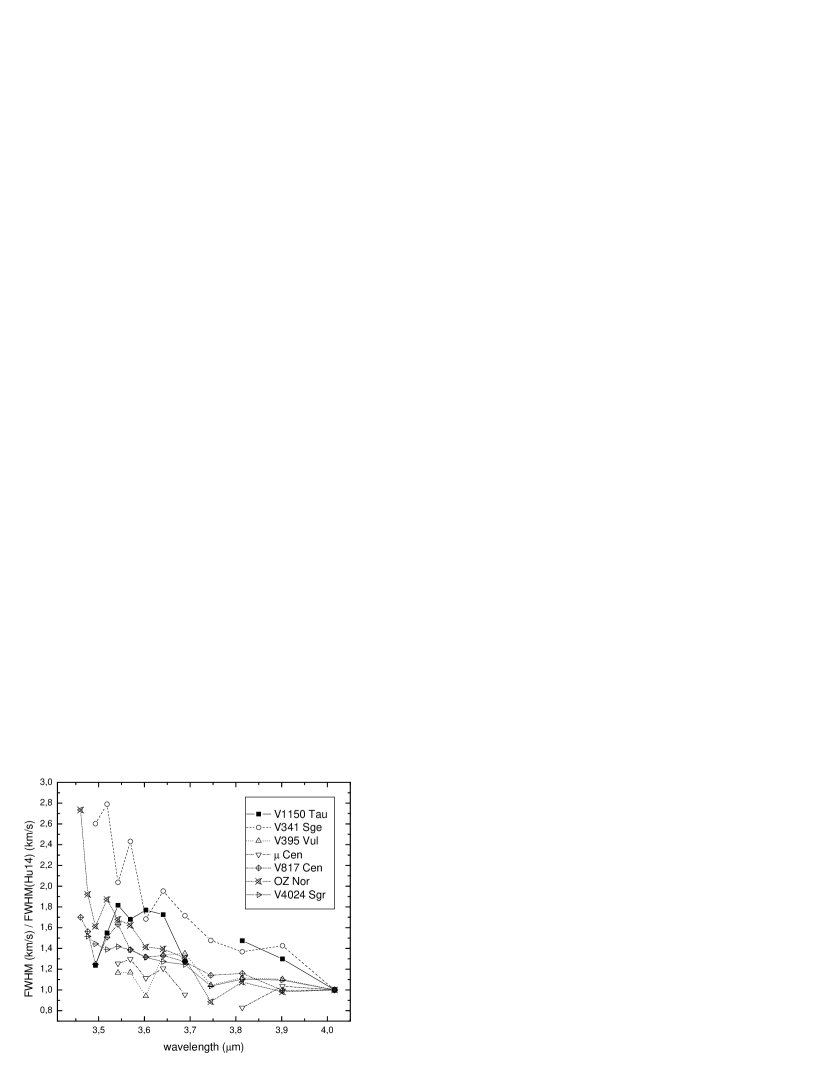
that roughly correlates with and also is larger for higher order transitions in the Humphreys series (Figs. 4 and 5).
We found correlations of the form (Table 4):
(1)
We considered only correlations with and at most one rejected point. These correlations suggest that rotational broadening is the main line broadening mechanism for these lines and point to a rotationally supported, probably disk-like envelope as the source of infrared line emission. Similar kinematical insights have been derived from other infrared and optical spectroscopic studies of Be stars and they have been interpreted in terms of a disk-like geometry for Be star envelopes (e.g. Sellgren & Smith 1992, Hanuschik 1996, Clark & Steele 2000, Hony et al. 2000). In this view, higher order lines probe inner disk regions, with larger rotational velocities. The fact that the is larger than 2 could indicate additional sources of broadening like turbulence, macroscopic velocity fields or electron scattering (although we do not observe prominent electron scattering wings in the lines). We note that the coefficient defined in equation (1) is the expected line broadening for a star seen pole-on ( = 0 km/s). If planar Keplerian motions dominate the disk kinematics, then we should expect this number to be similar to the thermal broadening in the disk ( 13 km/s for 10.000 hydrogen gas). However, we observe all lines in Table 4 with . Since IR lines, especially those of the Humphreys series, probe the inner disk region, it is possible that larger turbulent motions and eventually departures of the disk geometry in the inner disk explain why the coefficients of infrared lines are larger than those of Balmer and Fe II lines (Table 4). As we don’t observe Stark broadened emission wings, we discard pressure effects as the cause for the large observed . We failed to estimate the electron density of the envelope (and so an estimate of the pressure effect) using the Inglis-Teller formula since the quality of the data did not allow us to detect the wavelength of confluence of the Humphreys series with the continuum. The broadening effect mentioned, plus our rather small spectral resolution ( 1200), probably explains why the typical hallmarks for rotationally supported disks, viz. doubly peaked emission lines, are not observed in our spectra.
In the disk model of Be stars the peak separation of the nth emission line measures the velocity near the outer disk (Hirata & Kogure 1984):
(2)
In the following we assume a disk rotational law given by:
(3)
where is the equatorial stellar velocity and is equal to 0.5 for a Keplerian disk and 1.0
for continuum mass loss with conservation of the angular momentum. The extension of the disk which
corresponds to the nth emission line is:
(4)
and the extension relative to the Hu14 forming region is:
(5)
Where we have assumed a linear relation between and (Hanuschik 1996 and references therein).
The fact that the ratio reaches values up to 2.7 around Hu24 (Fig. 5), implies
that the relative disk extension for OZ Nor and V 341 Sge equals 3 (=1) or 7 (=0.5).
4.2 Diagnostics for the envelope optical depth
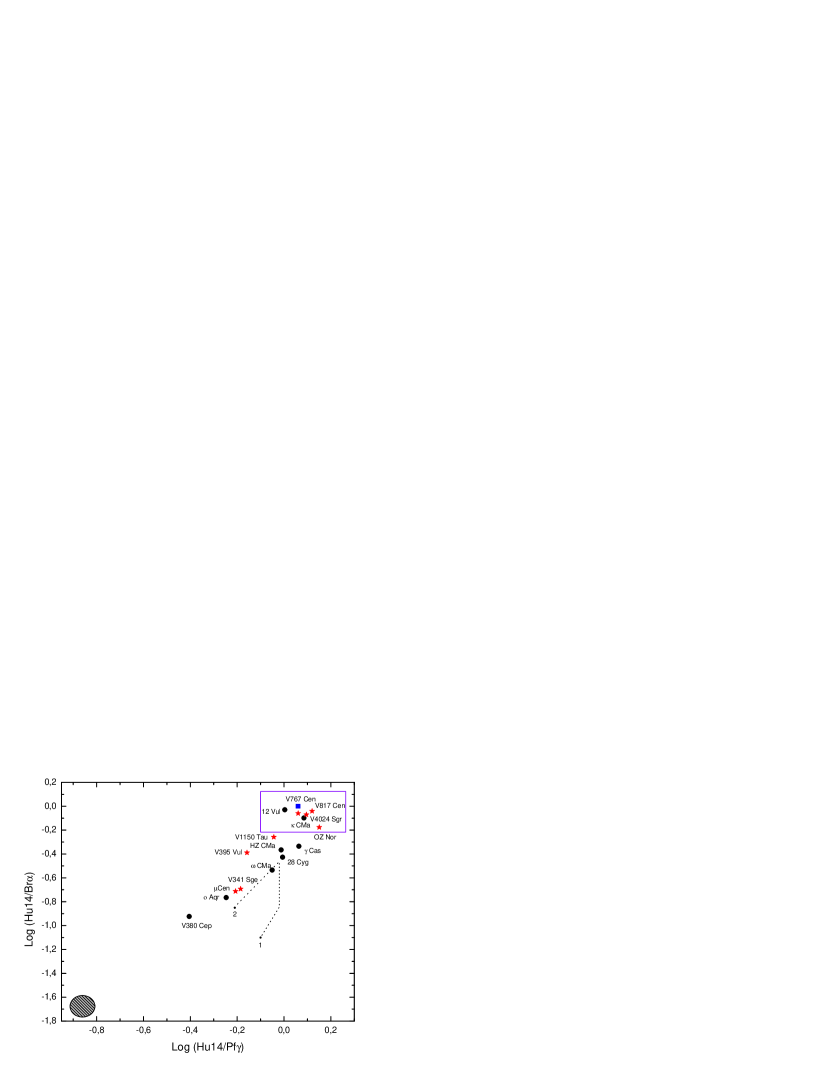
Lenorzer, de Koter, & Waters (2002b) have suggested that the study of (Hu14/Br) versus (Hu14/Pf) provides a simple way to investigate the nature of the circumstellar material around Be stars and related objects. They found that line ratios close to the Menzel case B recombination theory correspond to optically thin lines formed mainly in isothermal stellar winds and those close to unity are optically thick lines arising from a disk-like structure. Particularly, in an optically thick medium, the line flux ratios become independent on the mass absorption coefficient and the line flux turns out to be dominated by the size of the emitting surface. We show in Fig. 6 our decrements compared with those taken from the literature or from theoretical models. It is clear that Group II stars are distributed in a region of moderate or small optical depth, whereas those of Group I are in the extreme of the distribution, corresponding to cases of optically thick envelopes. Group III stars, without emission lines, probably correspond to stars that have lost most of their envelopes. We note that not all of these stars show Br and Pf absorption lines, suggesting the filling by emission in these lines and consecuently the presence of an incipient envelope. We find that our empirical groups trace the optical depth of the circumstellar envelope.
We note the change in position of V 395 Vul ( 12 Vul) in two epochs. As said in Section 3, this corresponds to a weakening of the H emission line strength, which is consistent with a more traslucent envelope in may 2003. We also investigated the ISO spectra of the stars reported by Lenorzer, de Koter, & Waters (2002b) and published by Vandenbussche et al. (2002). We note that above (Hu14/Br) -0.2 all the stars (7 objects, including V 1150 Tau) can be classified as Group I, and below that hypothetical line the stars (9 objects) are Group II. 12 Vul changes between Group I and II. This shows that transition objects are difficult to find, and that the classification in groups I, II and III is in principle observationally supported. This classification has a quantitative support in the Lenorzer, de Koter, & Waters (2002b) diagram, but can be done more rapidly by simple visual inspection of the spectrum, for classification or selection purposes. We note that Be stars showing long-lived outbursts are found only in the upper right part of the diagram whereas those showing short-lived outbursts are more widely distributed. Our qualitative conclusion about the optical depth condition in the envelopes of Group I & II stars is also supported by the emission line ratio Pf/Hu16, which is a good discriminator between optically thin and thick conditions (Hummer & Storey 1987, Hamann & Simon 1987). We found this ratio 1 for all Group I stars and much larger than unity for Group II stars, consistent with theoretical predictions for optically thick and thin envelopes (respectively) with = 10.000 and = 1010 cm-3.
A quantitative interpretation of the Lenorzer et al. diagram was done by Jones et al. (2009),
in terms of a disk with varying density and illuminated by a central star of given temperature . In this model the disk density profile is given by:
(6)
where is the cylindrical, radial distance from the star rotation axis, is the perpendicular height above the equatorial plane and the corresponding scale height. is the density at the inner edge of the disk in the equatorial plane. Jones et al. (2009) explain the region occupied by Be stars in the Lenorzer et al. diagram by different values of , and . They note that the models correctly explain the observed decrements if = 3.0 to 4.5 and = 7.5 10-12 to 1.0 10-11. Their models do not reproduce, however, the extreme optically thick cases located at the upper right corner of the diagram (our Group I stars). The fact that in Group I stars Br is comparable in strength to Humphreys lines suggests that the size of the emitting region is limited (by a putative companion for instance) and the gas density is high. However, the fact that we observe Br line widths lower than in Humphreys lines for all Group I cases, argues against this view. Also, the Jones et al. (2009) disk models cannot reproduce these cases by simply truncating the disk since, as reported by these authors, all line fluxes fall off approximately at the same rate with increasing distance from the central star. Jones et al. (2009) claim that these stars must have disk geometries different than a simple power-law. In this sense, different geometries like power-laws with non constant (Zorec et al 2007) could be explored. Our discovery of a significant number of Be stars in this region calls for additional theoretical work for explaining these cases.
4.3 Study of the s and Humphreys emission line decrements
We find a strong correlation between and wavelength for a given series. This parameter increases with and sometimes saturates at (Fig. 7). This kind of behavior was observed in the prototype Be star Cas in several infrared H I series and interpreted in terms of a decrease in the line source function in the outer parts of the circumstellar region (Hony et al. 2000). Here we demonstrate that this is an usual behavior of Group-I and Group-II stars, being the pattern only disrupted by the larger emission found in the Br and Pf lines of Group-II stars.
We have studied ( is the quantum number of the upper level) versus for every star showing emission lines. We find that the Humphreys decrements follow well defined patterns (Fig. 8). For the stars of Group II, they increase with , indicating optically thin conditions, as in the case of Monocerotis A (Sellgren & Smith 1992). On the contrary, for stars of Group I, the decrements change their behavior at a transition wavelength, , from optically thin conditions (at shorter wavelengths) to optically thick conditions (at longer wavelengths). This transition is rather fast, and , given in Table 3, apparently is a characteristic of every star. As in the case of , the transition at could reflect a change in the optical properties of the envelopes at a certain distance of the star. In this scheme, V 1150 Tau could be classified as a Group-I star. We note that even for Be stars with optically thick envelopes, high order Humphreys lines probe optically thin inner regions.
From Fig. 5 and 7 we deduce a rough anticorrelation between and for the Humphreys lines of a given star, as usually happens for the H line in Be stars (Dachs et al. 1986). Consequently, this can be explained assuming that the scales with the disk size and that higher order lines are formed in smaller and inner disk-like regions rotating faster than the outer and bigger regions forming low order Humphreys lines.


4.4 2MASS photometry and continuum slope
For each star we have calculated , where the first color is from 2MASS (Skrutskie et al. 2006) and the last one is given by Koornneef (1983) for a star of similar spectral type and luminosity class (Table 2). We have not corrected them by interstellar extinction, which is expected to be small in infrared wavelengths, especially for our bright and relatively close stars. Keeping in mind that variability could affect the comparison of non-simultaneous data, we find no correlation between color excess, outburst character and group membership.
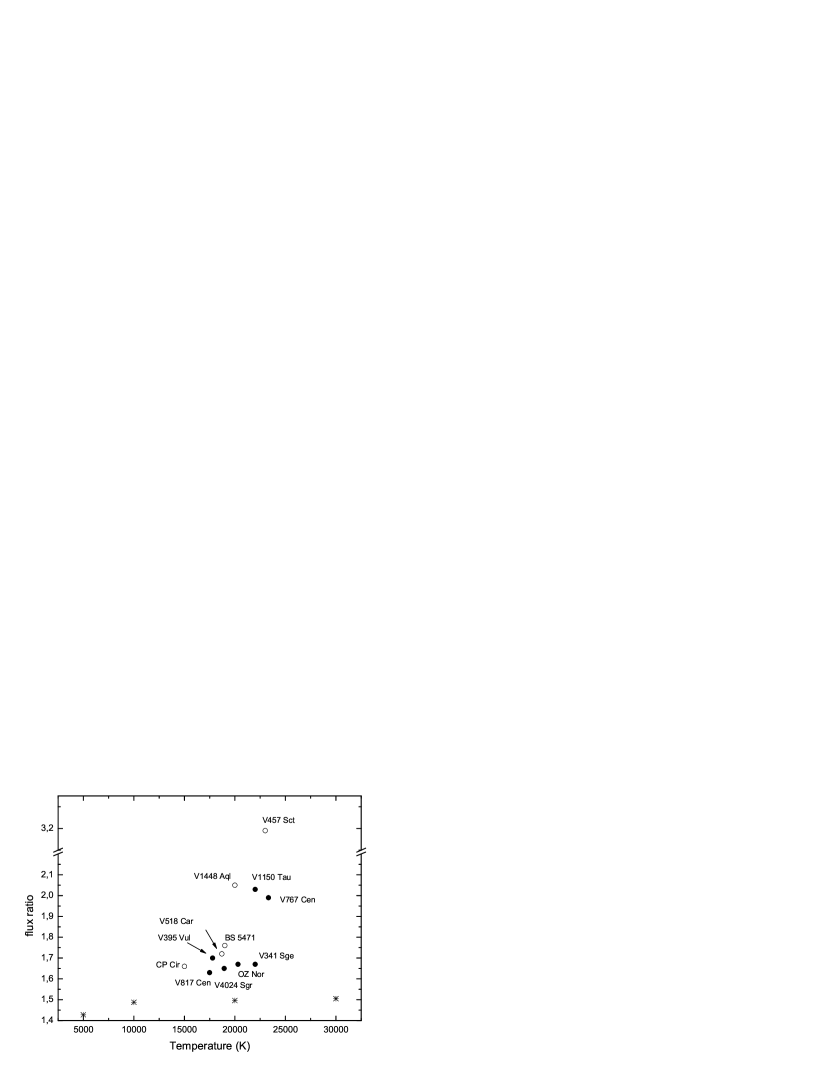
We measured the flux ratio in regions almost depleted of emission lines:
flux ratio = (7)
where is the spectral flux density. This ratio is bluer for hotter stars and for a given temperature is bluer for stars without emission lines (i.e. Group 3 stars, Fig. 9). No correlation is observed between continuum slope and emission line strength. These findings possibly point to the importance of the stellar flux in the infrared continuum emission; hotter stars produce bluer continuum and when the disk becomes developed (Group I-II stars) this continuum becomes redder, probably due to the contribution of free-free emission and partial stellar obscuration from the optically thicker disk. The position of V 457 Sct is notable. This star shows the bluest continuum, and no developed emission. However, the absence of Br and Pf absorptions indicate that residual emission is filling these lines. Incidentally, V 1448 Aql also show these characteristics; a very blue continuum and filled absorption lines. We speculate that these stars could be in a special position of their eruptive cycles, such as in the process of ejecting a hot optically thick disk. The disk could be later dissipated as an optically thin ring into the interstellar medium, as proposed in the model of de Wit et al. (2006), causing the stars’ position to move down in the diagram. The bluer color during the outburst ascending branch are predicted by this model, and observed in Be outbursting stars (de Wit et al. 2006). The stars should move up and down in the diagram of Fig. 9 during the outburst rising and decay. We note that Be star outbursts seem to be of larger amplitude in red bands (Mennickent et al. 2002) so this effect in our studied region should be significant. Further time resolved spectroscopy sampling the whole eruptive cycle is needed to test this conjecture for Be stars.
4.5 Dust around outbursting Be stars?
We note the absence of dust spectral features at the band, especially the Polycyclic Aromatic Hydrocarbons (PAH) emission feature at 3.3 m and the nano-diamond features at 3.43 and 3.52 m, that have been detected in some Herbig Ae/Be stars. These features have been observed in pre-main sequence stars of spectral type B9 and later but for earlier spectral types the 3.3 m band is weak or absent and the other bands are even weaker (Habart et al. 2004, Acke & van den Ancker 2006). As our stars are mostly early B-type, we cannot establish the absence of dusty envelopes from the absence of these key spectral features. However, the infrared color excesses of our targets listed in Table 2 and the 2MASS colors, between -0.08 and +0.34 and between -0.29 and 0.30, are typical for Be stars and not so large as in most hot stars surrounded by dust (e.g. Fig. 11 in Mathew, Subramaniam & Bhatt 2008). This suggests the absence of significant dust in the envelopes of these ourbursting Be stars. The IRAS colors of our targets provide the same insight. This finding is consistent with the classification of our targets as ”canonical” Be stars. Our targets probably are not surrounded by massive cool envelopes as in the case of Herbig Ae/Be stars.
5 Conclusions
We have provided a view of the L-band spectra of a selected sample of outbursting Be stars. These spectra show no evidence of dust and are not different from those reported spectra of Be stars showing only irregular photometric variability. The observed L-band spectra of 13 outbursting Be stars can be categorized in three broad groups reflecting the optical depth conditions in the Be star envelope. Based on the relative intensity of Humphreys, Br and Pf emission lines, a rapid visual inspection of the spectra indicates the envelopes optical depth. In addition, the Humphreys decrements, and the parameter defined in Section 4.3, can be used as a diagnostic tool for the optical depth of the circumstellar envelopes. We find that higher order Humphreys lines probe optically thin inner regions even in the case of optically thick envelopes. In addition, the large broadening observed in the IR lines probably reflect vertical velocity fields near the star. Some power-law disk models describing the infrared emission line properties fail to explain the cases of optically thick envelopes (Group I stars). We expect that our discovery of a large number of these stars motivates further theoretical work in this area. Our data does not allow us to test a possible correlation between the outburst stage and the spectral appearance, but the fact that the stars were observed at random outburst phases, the changes observed in two epochs in V 395 Vul ( 12 Vul) and the blue continuums of V 1448 Aql and V 457 Sct, suggest that all outbursting stars observed in this project could pass during their cycles through Groups I, II and III. The existence of these groups is in principle consistent with the proposed outburst description by de Wit et al. (2006) in terms of the ejection of an optically thick disk that expands and becomes optically thin before dissipation into the interstellar medium. Accordingly, , and the whole spectral appareance should change in a significant way during the entire outburst cycle, following the development of the circumstellar envelope. Variability of Be stars in the diagram of Fig. 6 along the diagonal was already suggested by Lenorzer et al. (2002b) due to the transient nature of Be star disks. We further suggest that the Be star outburst mechanism and disk evolution could be tested with time resolved infrared spectroscopy, using for instance the spectral diagnostics worked in this paper. Further time resolved L-band spectroscopy of selected targets along with photometry spanning several eruptive cycles are needed to test our prediction for outbursting Be stars.
References
- Andrillat, Jaschek, & Jaschek (1988) Andrillat Y., Jaschek M., Jaschek C., 1988, A&AS, 72, 129
- Acke & van den Ancker (2006) Acke B., van den Ancker M. E., 2006, A&A, 457, 171
- Bessell & Brett (1988) Bessell, M. S., & Brett, J. M., 1988, PASP, 100, 1134
- Briot (1981) Briot D., 1981, A&A, 103, 5
- Clark & Steele (2000) Clark J. S., Steele I. A., 2000, A&AS, 141, 65
- Dachs et al. (1986) Dachs J., Hanuschik R., Kaiser D., Rohe D., 1986, A&A, 159, 276
- de Wit et al. (2006) de Wit W. J., Lamers H. J. G. L. M., Marquette J. B., Beaulieu J. P., 2006, A&A, 456, 1027
- Frémat et al. (2005) Frémat Y., Zorec J., Hubert A.-M., Floquet M. 2005, A&A, 440, 305
- Frémat et al. (2006) Frémat, Y.; Neiner, C.; Hubert, A.-M. et al. 2006, A&A, 451, 1053
- Gehrz, Hackwell & Jones (1974) Gehrz R. D., Hackwell J. A., & Jones T. W. 1974, ApJ, 191, 675
- Glebocki & Stawikowski (2000) Glebocki, R., Stawikowski, A. 2000, AcA, 50, 509
- Grundstrom & Gies (2006) Grundstrom E. D., Gies D. R., 2006, ApJ, 651, L53
- Habart, Natta, & Krügel (2004) Habart E., Natta A., Krügel E., 2004, A&A, 427, 179
- Hamann & Simon (1987) Hamann F., Simon M., 1987, ApJ, 318, 356
- Hanuschik (1989) Hanuschik R. W., 1989, Ap&SS, 161, 61
- Hanuschik (1996) Hanuschik R. W., 1996, A&A, 308, 170
- Hirata & Kogure (1984) Hirata R., Kogure T., 1984, BASI, 12, 109
- Hony et al. (2000) Hony S. et al. 2000, A&A, 355, 187
- Hubert, Floquet & Zorec (2000) Hubert A. M., Floquet M. & Zorec J., 2000, in IAU Colloquium 175, “ The Be Phenomenon in Early-Type Stars”, Eds. M. A. Smith and H. F. Henrichs, ASP ConferenceProceedings, Vol. 214, p. 348
- Hummer & Storey (1987) Hummer D. G., Storey P. J., 1987, MNRAS, 224, 801
- Jaschek & Jaschek (1987) Jaschek C., & Jaschek M. 1987, ”The Classification of Stars”, Cambridge University Press.
- Jones et al. (2009) Jones C. E., Molak A., Sigut T. A. A., de Koter A., Lenorzer A., Popa S. C., 2009, MNRAS, 392, 383
- Koornneef (1983) Koornneef J., 1983, A&A, 128, 84
- Lenorzer et al. (2002a) Lenorzer A., Vandenbussche B., Morris P., de Koter A., Geballe T. R., Waters L. B. F. M., Hony S., Kaper L., 2002a, A&A, 384, 473
- Lenorzer, de Koter, & Waters (2002b) Lenorzer A., de Koter A., Waters L. B. F. M., 2002b, A&A, 386, L5
- Maiolino, Rieke, & Rieke (1996) Maiolino R., Rieke G. H., Rieke M. J., 1996, AJ, 111, 537
- Mathew, Subramaniam, & Bhatt (2008) Mathew B., Subramaniam A., Bhatt B. C., 2008, MNRAS, 388, 1879
- Mennickent, Vogt, & Sterken (1994) Mennickent R. E., Vogt N., Sterken C., 1994, A&AS, 108, 237
- Mennickent et al. (2002) Mennickent R. E., Pietrzyński G., Gieren W., Szewczyk O., 2002, A&A, 393, 887
- Moorwood et al. (1998) Moorwood A., et al., 1998, Msngr, 94, 7
- Persson & McGregor (1985) Persson S. E. & McGregor P. J. 1985, AJ, 90, 1860
- Pojmański (2001) Pojmański G., 2001, ASPC, 246, 53
- Quirrenbach et al. (1994) Quirrenbach A., Buscher D. F., Mozurkewich D., Hummel C. A., Armstrong J. T., 1994, A&A, 283, L13
- Sellgren & Smith (1992) Sellgren K., Smith R. G., 1992, ApJ, 388, 178
- Skrutskie et al. (2006) Skrutskie M. F., et al., 2006, AJ, 131, 1163
- Stee et al. (1995) Stee P., de Araujo F. X., Vakili F., Mourard D., Arnold L., Bonneau D., Morand F., Tallon-Bosc I., 1995, A&A, 300, 219
- Sterken, Vogt, & Mennickent (1996) Sterken C., Vogt N., Mennickent R. E., 1996, A&A, 311, 579
- Townsend, Owocki, & Howarth (2004) Townsend R. H. D., Owocki S. P., Howarth I. D., 2004, MNRAS, 350, 189
- Vandenbussche et al. (2002) Vandenbussche B., et al., 2002, A&A, 390, 1033
- Waters (1986) Waters L. B. F. M. 1986, A&A, 162, 121
- Wright et al. (2003) Wright C. O., Egan M. P., Kraemer K. E., Price S. D. 2003, AJ, 125,359
- Yudin (2001) Yudin R. V. 2001, A&A, 368, 912
- Zorec, Frémat & Cidale (2005) Zorec J., Frémat Y. & Cidale L. 2005, A&A, 441, 235
- Zorec et al. (2007) Zorec J., Arias M. L., Cidale L., Ringuelet A. E., 2007, A&A, 470, 239