The SINS survey: modeling the dynamics of galaxies and the high-z Tully-Fisher relation
Abstract
We present the modeling of SINFONI integral field dynamics of 18 star forming galaxies at from H line emission. The galaxies are selected from the larger sample of the SINS survey, based on the prominence of ordered rotational motions with respect to more complex merger induced dynamics. The quality of the data allows us to carefully select systems with kinematics dominated by rotation, and to model the gas dynamics across the whole galaxy using suitable exponential disk models. We obtain a good correlation between the dynamical mass and the stellar mass, finding that large gas fractions () are required to explain the difference between the two quantities. We use the derived stellar mass and maximum rotational velocity from the modeling to construct for the first time the stellar mass Tully-Fisher relation at . The relation obtained shows a slope similar to what is observed at lower redshift, but we detect an evolution of the zero point. We find that at there is an offset in for a given rotational velocity of with respect to the local Universe. This result is consistent with the predictions of the latest N-body/hydrodynamical simulations of disk formation and evolution, which invoke gas accretion onto the forming disk in filaments and cooling flows. This scenario is in agreement with other dynamical evidence from SINS, where gas accretion from the halo is required to reproduce the observed properties of a large fraction of the galaxies.
Subject headings:
Galaxies: evolution – Galaxies: high-redshift – Galaxies: kinematics and dynamics – Infrared: galaxies1. Introduction
In recent years our observational knowledge of the high redshift Universe has increased enormously. A variety of selection techniques have been developed to create well-defined samples of z=1-6 galaxies, from UV to sub-millimeter wavelengths (e.g. Giavalisco et al. giavalisco, 2002, Steidel et al. steidel, 2004, Adelberger et al. adelberger, 2004, Franx et al. franx, 2003, Chapman et al. chapman, 2005, Daddi et al. 2004b, ). These complementary and partially overlapping samples are now covering the critical redshift range around , which is the epoch of major star formation and mass assembly in galaxies (Hopkins & Beacom hopkins, 2006). Most of the first studies of these high- populations came from photometric measurements and comparisons with template spectral energy distributions (SEDs). As a consequence, little was known about the detailed properties and dynamics of these systems, since such information can best be obtained through sensitive, high-resolution near-IR (rest frame optical) spectroscopy. In the last few years, using increasingly sensitive IR detectors coupled with high throughput spectrometers and integral field techniques, it has become possible to carry out detailed imaging spectroscopy of the strongest rest-frame optical emission lines, allowing the assembly stage of massive galaxies to be studied directly through observations of the dynamical and detailed physical properties of the different populations at (see e.g. Erb et al. 2006a, , 2006c, ). Indeed, the dynamical state of distant galaxies is the key property that enables a quantitative assessment of the main drivers of mass assembly and evolutionary processes.
In this context we have initiated SINS, the high-z galaxy Spectroscopic Imaging survey in the Near-IR with SINFONI (Förster Schreiber et al. survey, 2008), making use of the capabilities of spatially resolved integral field spectroscopy to obtain new insights on the internal dynamics, sizes and morphology, dynamical masses, metal abundances and stellar populations of high-z massive star-forming galaxies. With the direct measurement of these quantities, the first study of detailed dynamical properties of these sources has been successfully carried out. We find evidence for large, massive, gas-rich rotating disks in place at , requiring rapid and efficient mass accretion (Förster Schreiber et al. natascha, 2006; Genzel et al. genzel, 2006, genzel08, 2008; Shapiro et al. kristen, 2008; see also e.g. Wright et al. wright, 2007, Bournaud et al. bournaud, 2007, van Starkenburg et al. vanstark, 2008). While major () mergers may form such disks in some cases (Robertson et al. robertson06, 2006, Robertson & Bullock robertson08, 2008), on average a more continuous and steady mass accretion mechanism, such as through cold flows along cosmic web filaments (Keres et al. keres, 2005, Dekel & Birnboim dekel, 2006, Dekel et al. dekel08, 2008, Sommer-Larsen et al. sl03, 2003), could be invoked. This leads to high star formation rates with longer time scales than the short bursts driven by mergers, and possibly induces the formation of central bulges via internal/secular dynamical processes (e.g. Noguchi noguchi, 1999, Immeli et al. immeli, 2004, Bournaud et al. bournaud, 2007). The latest generation of cosmological semi-analytical and hydrodynamical simulations in the -CDM paradigm indicate that minor mergers and/or smooth accretion are likely to dominate the assembly of the high-z populations, while major mergers would play a role in the smaller fraction of hyperluminous sources (see e.g. Kitzbichler & White kitzbichler, 2007, Naab et al. naab, 2007, Guo & White guo, 2008, Genel et al. shy, 2008). A comparison of the dynamical properties of different samples of high-z galaxies observed in SINS (Bouché et al. nicolas, 2007), shows that optically and IR-selected galaxies up to follow a similar velocity-size relation as late-type spirals, in strong contrast with sub-mm selected galaxies (see Tacconi et al. tacconi, 2008).
The spatially resolved integral field kinematics of high-z galaxies has therefore proven to be a powerful tool to study the major processes connected to the formation and evolution of galaxies in the early universe (see also Wright et al. wright, 2007, Law et al. law, 2007, Bournaud et al. bournaud08, 2008 and van Starkenburg et al. vanstark, 2008). A robust measure of the internal kinematics of high-z galaxies is therefore a fundamental step in our understanding of the formation and early evolution of galaxies.
In this paper we present quantitative kinematic modeling of a sample of galaxies at , selected from the SINS sample to be the most disk-like according to their kinematics, showing a regular velocity “spider-pattern” with a clear velocity gradient and the velocity dispersion peaking in the center. Thanks to the full two-dimensional coverage of our SINS datasets, we are able to model the internal dynamics of the warm gas as traced by the H emission, deriving important constraints on the structure of these objects and on the evolution of their scaling properties, such as the Tully-Fisher relation (Tully & Fisher TF, 1977).
In Section 2 we describe the sample selection, observations and data reduction, along with the extraction of the kinematic information from the observed datacubes. In Section 3 the disk model used and the fitting technique are presented, while the results are discussed in Section 4. In Section 5 the stellar mass Tully Fisher relation at is presented, and our conclusions follow in Section 6. Throughout the paper we assume a -dominated cosmology with , and . In this cosmology, corresponds to kpc at . All magnitudes are given in the Vega photometric system.
2. Sample and observations
In the framework of the SINS survey (see Förster Schreiber et al. natascha, 2006, survey, 2008; Genzel et al. genzel, 2006, genzel08, 2008; Bouché et al. nicolas, 2007; Shapiro et al. kristen, 2008), we used the SINFONI near-IR integral field spectrograph on the ESO VLT (Eisenhauer et al. frank, 2003, Bonnet et al. bonnet, 2004) to measure the dynamics of the warm gas in a substantial sample of over 60 redshift massive star-forming galaxies, as traced by their H emission redshifted into the -band () and -band (), or by [OIII] at .
2.1. The SINS high-z disks sample
Förster Schreiber et al. survey, 2008 describe in detail the selection criteria of the SINS sample. Briefly, the SINS galaxies were selected to be massive star forming galaxies using a variety of complementary techniques in UV through IR wavebands (BX/BM criterion, Adelberger et al. adelberger, 2004; s-BzK, Daddi et al. 2004b, ; K magnitude, Cimatti et al. cimatti, 2002, IRAC flux, Kurk et al. kurk, 2006). These selection criteria sample fairly luminous () and massive galaxies () with star formation rates of 10-300 /yr. These represent the bulk of the cosmic star formation activity and stellar mass density at these redshifts (Reddy et al. reddy, 2005; Rudnick et al. rudnick, 2006; Grazian et al. grazian, 2007, Caputi et al. caputi, 2007). Here we present the dynamical modeling performed on a subsample of 18 galaxies (see Table 1, Fig. 2), that are selected for showing ordered rotational signatures, i.e. a regular velocity pattern with a clear velocity gradient and a velocity dispersion that peaks in the center, as well as for their high S/N observations.
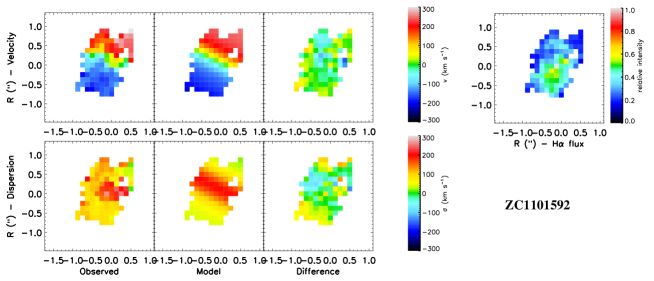
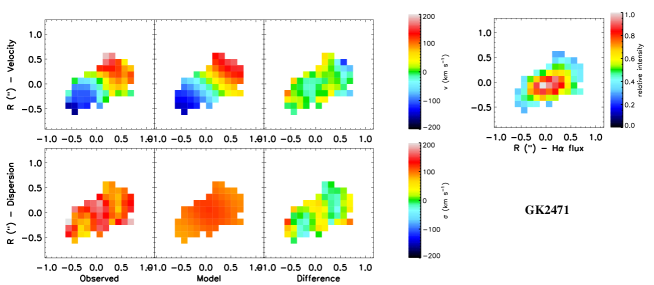
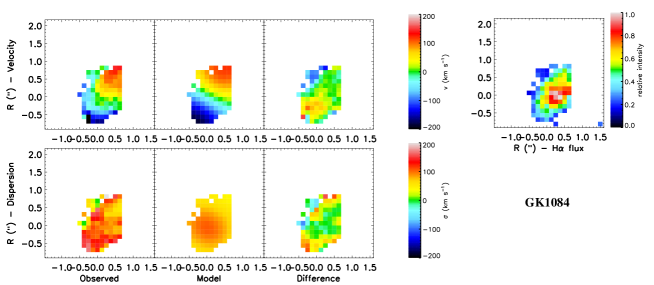
In order to distinguish between rotationally dominated galaxies and sources with merger induced complex dynamics, we used, where possible, the method described in Shapiro et al. (kristen, 2008). Using kinemetry (Krajnović et al. kinemetry, 2006), we were able to quantify asymmetries in both the velocity and velocity dispersion maps of the warm gas, in order to empirically differentiate between major merging and non-merging (or minor merging) systems at high redshift. These criteria take full advantage of the wealth of information available with integral field data, which - unlike broad-band morphology - give direct information on the dynamical state of the galaxies. The method was first applied to a subsample of galaxies with the best quality data (see Shapiro et al. kristen, 2008), and it has been now extended to a a larger subset of SINS galaxies (Shapiro et al. in preparation). In total 11 out of 18 galaxies of the sample discussed here were classified as rotationally dominated by kinemetry. For the remaining 7 sources (Q1623-BX663, Q2346-BX416, D3a-7144, D3a-4751, ZC1101592, GK2471, GK1084), we were not able to derive a quantitative classification due to the lower S/N of the data. We include them in this study since they closely resemble at a visual inspection the ones classified as disks in their dynamical properties (regular velocity pattern with clear velocity gradient, velocity dispersion peaking in the center), with no evidence of more complex merger induced dynamics.
The disk like systems selected for this study include 7 BX/BM galaxies selected by their rest-frame UV colors down to , taken from the H survey of Erb et al. (2006c, ), 2 galaxies selected with IRAC/Spitzer in the framework of the GMASS survey (Kurk et al. kurk, 2006), and 10 rest frame optical selected galaxies meeting the s-BzK color criterion introduced by Daddi et al. (2004b, ). These are taken from the K20 survey (Daddi et al. 2004a, ), Deep-3a (Kong et al. kong, 2006) and z-Cosmos (Lilly et al lilly, 2007) surveys.
2.2. Observations and data reduction
We observed the selected galaxies with SINFONI (Eisenhauer et al. frank, 2003) at the VLT UT4 telescope during several campaigns between July 2004 and November 2007 as part of guaranteed time observations. The H or K band grating was used to sample the H emission, depending on the redshift of the galaxy. Most of the observations were carried out in seeing limited mode, using the pixel scale, which provides a total field of view of . The average resolution obtained for our 18 galaxies, as sampled by PSF reference star observations before and after every hour of target integration, is . The spectral resolution provided is about 80 km/s Full Width Half Maximum (FWHM) in the band and 100 km/s in the band. For one source, D3a-15504, the presence of a suitable nearby reference star allowed us to use the correction provided by Natural Guide Star (NGS) Adaptive Optics (AO) observations. For two more objects, ZC782941 and Q2346-BX482, the Laser Guide Star (LGS) system PARSEC (Rabien et al. rabien, 2004, Bonaccini et al. bonaccini, 2006) was used to provide an average resolution of (corresponding to only 1.25 kpc at ). In the AO observations of these three sources the pixel scale was used, providing a field of view of . The observations and the data reduction were performed as described in Förster Schreiber et al. (natascha, 2006), Abuter et al. (abuter, 2006), and Davies et al. (ric, 2007).
The final result of the data reduction procedures is a flux-calibrated datacube, containing the full image of the galaxy observed at each wavelength. We are thus able to extract from the cube both the one-dimensional spectrum at each pixel (or integrated over a larger region) and monochromatic images of the field of view at different wavelengths.
2.3. Kinematic extraction
To increase the S/N ratio, we median filtered the reduced cubes spatially using a FWHM=3 pixels, obtaining an effective resolution of , or for the galaxies observed with the pixel scale and AO. We then extracted from the smoothed cubes the continuum maps, line emission, velocity and velocity dispersion fields of H. This was done by fitting a function to the continuum-subtracted spectral profile at each spatial position in the datacube, masking out the wavelength range contaminated with the [NII] line emission. The function fitted was a convolution of a Gaussian with a spectrally unresolved emission line profile of a suitable sky line, i.e. a high signal and non-blended line in the appropriate band. A minimization was performed in which the parameters of the Gaussian were adjusted until the convolved profile best matched the data. During the minimization, pixels in the data that consistently deviated more than from the average were rejected, and were not used in the analysis. The uncertainties on the measured velocity and velocity dispersion maps are evaluated through Monte Carlo realizations, perturbing the input data assuming Gaussian uncertainties. All details and issues of the kinematic extraction with the IDL routine LINEFIT are described in more details in Förster Schreiber et al. (survey, 2008) and Davies et al. (in preparation).
3. Dynamical modeling of the galaxies
The observed H line emission kinematics of the selected galaxies can now be studied to robustly quantify their dynamical properties. This represents a major step forward in the modeling of the dynamics of high-z galaxies, as the full two-dimensional mapping from SINFONI is more complete and not biased by a priori assumptions about the kinematic major axis and inclination of the system as in long-slit spectroscopy (see also Wright et al. wright, 2007, Law et al. law, 2007).
We compare the velocity and velocity dispersion maps, derived from the SINFONI data as described in Sec. 2, with an exponential disk model (scale height ). Although a simple exponential disk could be an oversimplification of the structure in some of these high-z sources, this represents the best compromise between providing homogeneous reliable properties and avoiding over-interpretation of the data. A more detailed analysis is possible for the higher resolution and S/N datasets, using more complex mass distributions (see Genzel et al. genzel08, 2008).
The observed intensity distribution of the H emission line traces the location of the star forming regions across the galaxy, and has a clumpy and irregular distribution even for kinematically very regular disks. Therefore the line emission light distribution is used in the following only to evaluate the size of the emitting region. The best fitting disk parameters were derived using an optimized minimization routine, comparing the disk model with the observed velocity and velocity dispersion extracted as described in Sec. 2.3.
3.1. The disk model
We create the disk models using the IDL code DYSMAL. The code uses a set of input parameters to derive a datacube with two spatial and one spectral (velocity) axis, from which it is possible to extract 2D morphological and kinematical maps. It begins by creating a face-on model of an axisymmetric galaxy with 3 spatial dimensions , in which is normal to the galaxy plane. The radial mass profile is specified by the user and can be based on exponential, Gaussian, Moffat, or power-law functions. The radial luminosity profile can be specified independently, since it can refer to different tracers that do not necessarily follow the mass distribution. The scale height of the disk must also be provided. The 3D model is then rotated to the required inclination and position angles, to create a cube that has axes where is the projection on the sky. Although a warped disk can be modelled by specifying these 2 parameters as functions of radius, in all cases here the disk was modelled in a single plane. To make this coordinate transformation more efficient, it is first necessary to identify those pixels in the resulting cube containing flux, and only fluxes for these pixels are calculated. The flux in each pixel is interpolated based on the sub-pixel location in the original cube. A second matching cube is created in which each pixel is assigned an appropriate line-of-sight velocity. The velocities are interpolated from a rotation curve that is itself generated from the combined mass profile (including a black hole mass if one is specified) and scaled to the total mass at a given radius. The next step is, for each pixel , to generate a Gaussian profile to model the line emission, whose scaling depends on the flux, whose center depends on the line-of-sight velocity, and whose width depends on both the instrumental broadening specified by the user and a local isotropic velocity dispersion depending on the z-scale height. This z-velocity dispersion is estimated in one of two ways:
-
1.
using an approximation appropriate for large thin disks, in which it depends on the scale height and mass surface density (Binney & Tremaine binney, 2008, eq. 4.302c):
(1) where is the scale height and the rotational velocity at radius ;
-
2.
assuming that the vertical motion is restricted to the inner part of an extended mass distribution and does not feel the entire gravity:
(2) which is more suitable for a thick or compact disk (Genzel et al. genzel08, 2008), and it was used in the modeling discussed below.
The total z-velocity dispersion in the model is then given by , where is an additional component of isotropic velocity dispersion throughout the disk that can be added by the user. This term was introduced in DYSMAL to account for instrumental broadening. It can also be used to include any additional possible contribution to the observed velocity widths from, e.g., rapid mass accretion, strong feedback from star formation, or unresolved non-circular motions (hereafter globally called “random motions” for simplicity). This yields a line-of-sight velocity profile for each pixel in . Then, at each location, the velocity profiles for all the positions are summed to yield the full line-of-sight velocity distribution at that point. This creates a cube with two spatial and one velocity axes. The final step is to convolve each plane in this cube with the spatial beam and to rebin to the desired pixel scale.
The reason for beginning with a galaxy in 3 spatial dimensions is to ensure that there is always enough spatial resolution along the projected minor axis to yield a reliable line-of-sight velocity distribution. This can be an issue when the inclination is high, and in such cases a direct 2D projection is insufficient. It also enables one to apply a mask that modulates the flux distribution, for example to simulate a knotty or clumpy structure. The code allows one either to generate a mask containing random knots; or to input one if, for example, a more ordered pattern such as spiral arms is required. In either case, the mask is applied to the galaxy while it is face-on, in the plane. For this high-z study, however, a plain exponential disk was used to keep the number of free parameters as low as possible.
The velocity dispersion across the galaxy disk is an important parameter to consider. When there are significant random motions, as implied by the large observed dispersion, they should also support some of the mass. This is currently not implemented in DYSMAL, which assumes that all the mass is supported by ordered rotation in the disk plane. Thus, if , the total system mass may be underestimated by a factor of 2 or more. The average for our sample is , producing an effect of .
We account for spatial beam smearing from the PSF and velocity broadening from instrumental spectral resolution in our modeling, as we compare this spatially and spectrally convolved model disk to the observations. Hence, the best-fit quantities represent the intrinsic properties derived by properly taking into account these observational effects.
3.2. Fitting technique: an evolutionary approach
Given the large number of parameters and the potential for many local minima in the likelihood/ space, it is important to use a reliable fitting algorithm, i.e. robust and efficient one to find the global extremum. We selected for this task genetic algorithms, which are heuristic search techniques that provide a means to efficiently sample the parameter space, reproducing in a computational setting the biological effect of evolution by natural selection (e.g. Holland, holland, 1975). These kinds of algorithms have the advantage of being robust and efficient in finding the global maximum of a given function even in a very complex parameter space, with a reasonable number of iterations and without the need of a good set of initial guesses. It thus represents an ideal tool for our specific problem.
We use a modified version of PIKAIA, a genetic algorithm-based optimization routine by Charbonneau (charbonneau, 1995). The algorithm starts with a random population of “individuals” that represent a single location in parameter space with a complete set of the parameters we want to fit. The fitness of each individual is evaluated through their , and the probability to survive in the next iteration is set to be proportional to this value. In this way the more suitable parameter sets are selected, but at the same time the parameter space is efficiently sampled by “breeding” between different individuals and allowing random “mutations” and “crossovers” between the parameters. Therefore, in each iteration the whole population becomes more and more suitable, while still sampling the parameter space. When the requested tolerance is reached, or at the end of a given number of iterations, the best fitting “individual” is chosen as the solution.
The genetic algorithm allows us to efficiently minimize the differences between the exponential disk model and the observed velocity and velocity dispersion fields of the H emission line. Simulations on test galaxies have shown that leaving the rotation center as a free parameters in the fitting significantly worsens the the final results, even after increasing the number of maximum iterations allowed (see also Shapiro et al. kristen, 2008). We therefore locate the center using the continuum light distribution of the galaxies, which corresponds roughly to rest frame band as observed in the near-IR at . In the SINFONI data of our galaxies, the continuum is detected, although typically at a lower S/N than the emission lines. The resulting intensity map is generally smoother and distinct than the emission line (Förster Schreiber et al. natascha, 2006, Genzel et al. genzel08, 2008, Shapiro et al. kristen, 2008), as it is also the case for local disk galaxies (e.g. Daigle et al. daigle, 2006). These continuum intensity maps show a clear peak in the central region, especially in the BzK selected galaxies, and represent a better tracer of the mass distribution (dominated by stars) in the galaxies than the more clumpy line emission (tracing active sites of star formation). The center is identified by computing the intensity weighted mean of the light profile of the central pixels along both minor and major axes, and it is kept fixed in the disk fitting procedure.
The other parameter that is provided as an input to the fitting routine is the scale length of the disk. This parameter is in fact better constrained by the emission intensity than by the dynamical properties of the gas. In this case we used the higher S/N line emission image of the galaxies to quantify it. The disk H distribution has been found to follow the continuum for local spiral galaxies, with consistent derived scale lengths (e.g. Tacconi et al. tacconi86, 1986, Koopmann et al. koopmann, 2001, Hanish et al. hanish, 2006). From an analysis of different SINS and simulated galaxies, we found that the most robust way to measure the scale length of the disks given the S/N and resolution of the data is to fit a linear Gaussian profile along the major axis of the line intensity maps. This method has the advantage of using just the bulk of the brighter line emission, avoiding the problems related to the surface brightness at the edges of the galaxies. Following Bouché et al. (nicolas, 2007), we assumed that the derived HWHM, once corrected for the observed seeing, corresponds to the scale length of the disk. This assumption is supported by model disk fits, incorporating the beam smearing due to the FWHM resolution of our data. These simulations show that measured in this way is likely to be overestimated by no more than . Using available HST/NICMOS continuum imaging (see Förster Schreiber et al. in preparation) and deep ISAAC imaging in GOODS (data release v1.5: http://www.eso.org/science/goods/releases/20050930/) of a subsample of these sources (1 GMASS, 2 K20 and 5 BX), we find reasonable agreement between our measured scale length and the ones derived by fitting an exponential profile to these K band images with GALFIT (Peng et al. peng, 2002). The results are shown in Fig. 1.
According to simulations, a choice of a scale length smaller would provide a dynamical mass lower, and a smaller one a mass lower. We note that the value obtained for the maximum rotational velocity is instead much less sensitive to a variation of the scale length, as the fitting routine has to reproduce the observed velocity pattern. However, we also note that if a flatter mass distribution is a more appropriate description of the structure of these high-z disks, e.g. the ring-like structures discussed in Genzel et al. (genzel08, 2008), the true enclosed masses would then be up to lower than the one obtained with the method presented here.
The inclination of the disk with respect to the line of sight , the position angle on the plane of the sky , the total enclosed mass , the velocity zero point at the rotation center, and the constant global isotropic dispersion term (see eq. 2), are left as free parameters in the minimization. The model disk obtained is then rescaled as it would appear at the redshift of the source, re-binned to the pixel size of the current observation, and smeared using the FWHM of the PSF observed (see Sect. 2). In every iteration of the genetic algorithm, the is evaluated for each “individual” from the squared difference between the observed velocity and velocity dispersion maps and the modeled ones. The difference in each pixel is weighted using the uncertainties on the velocity and on derived as described in Sec. 2 at that location, e.g.:
| (3) |
where is the number of pixels with S/N over the threshold (see Sect. 2.3) used in the analysis. The best fitting parameter set is therefore taken as the solution. The uncertainties are evaluated following Avni (avni, 1976) method to calculate confidence limits for a multiple number of parameters, studying the variation of around the optimized minimum. We assumed as confidence interval where the reduced is increased by for the three “interesting parameters” (inclination, dynamical mass and ) used in the analysis.
4. Results
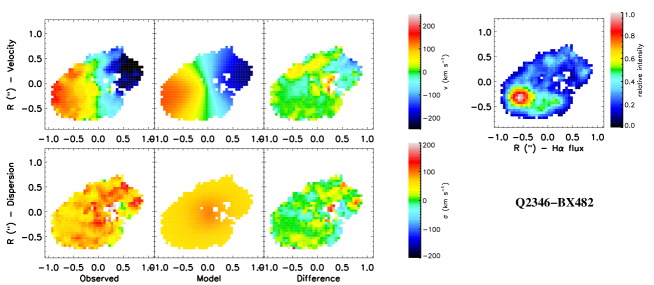
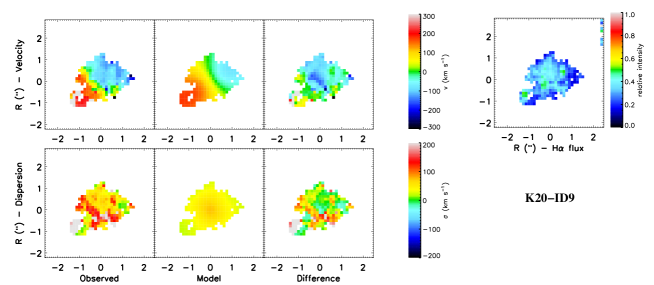
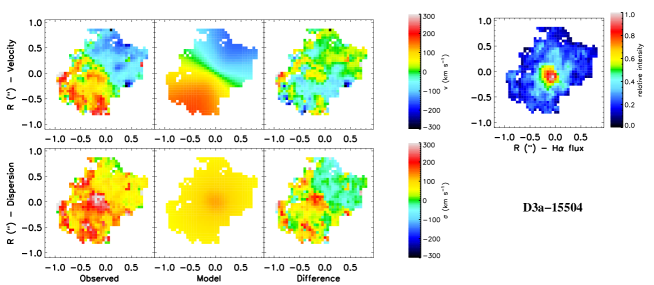
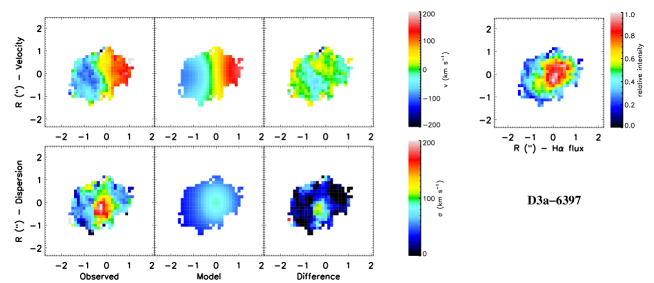
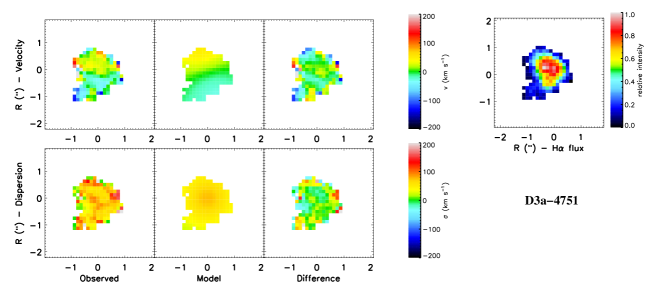
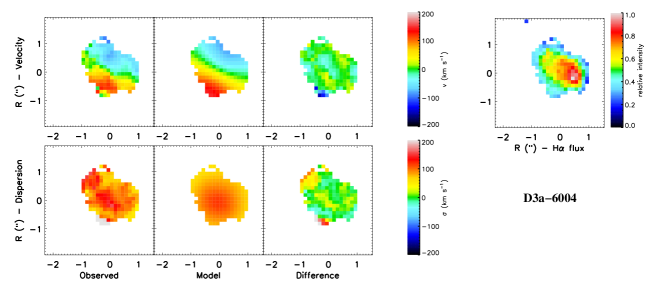
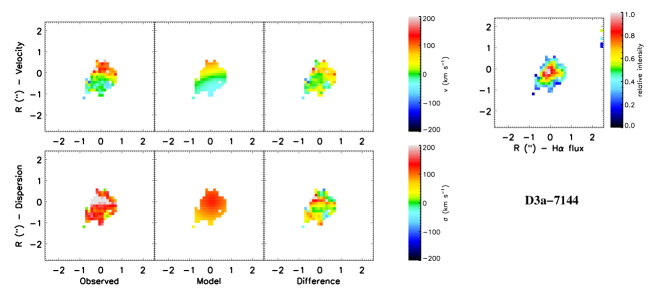
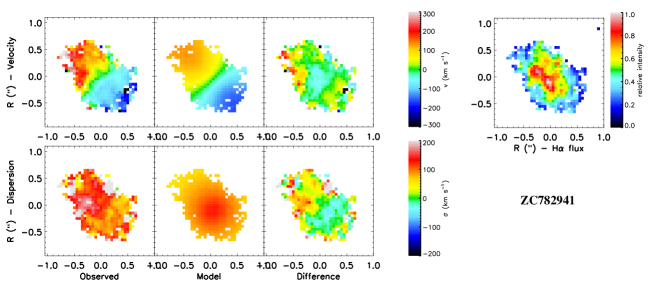
For each galaxy in the sample we show, in Fig. 2, the results of the best fit with the exponential disk model, for both the velocity and velocity dispersion fields. The disk model is able to reproduce the global dynamical pattern of the galaxies, although in the observed maps small deviations from a perfect “spider-diagram” are observed. These deviations are clear as residuals in the difference image between the observed maps and the model, and in the maps, defined as above (eq. 3). The total reduced obtained for the galaxies vary between 0.2 and 20, but comparing directly the different values between the galaxies is not a reliable criterion for evaluating the quality of the modeling for the different sources nor for distinguishing ordered motions from disturbed kinematics due to interactions. In fact the test is, as expected, sensitive to the average S/N of the observation, since the value is weighted using the uncertainties on the velocity and dispersion. Since the S/N of the data varies from source to source, the separation between rotating disks and disturbed kinematics is performed using the kinemetry criteria developed by Shapiro et al. (kristen, 2008, see section 2).
The results of the modeling are summarized in Tab. 2. The dynamical mass reported is the total mass in the best fitting exponential disk at a radius of 10 kpc ( at ). This radius was chosen to roughly match the photometric radius used to measure the “total” fluxes of the galaxies in the different filters, which were used in the SED fitting to calculate the stellar masses (see following section), allowing a meaningful comparison of the two quantities. is the maximum velocity in the exponential disk model. The main source of uncertainty is the determination of the inclination with respect to the plane of the sky. Moreover, the stated errors on the dynamical mass do not include possible systematic effects, e.g. due to the value used for or due to the choice of the exponential mass profile (see Sect. 3.2).
The measurement of is mainly constrained from the dispersion in the outer part of the disks, where the effects due to the beam smearing of the steep central rotation curve are less prominent. Some of the galaxies were too compact, or with insufficient data quality to derive a robust measure of this quantity. In one case, Q2343-BX389, the irregular dispersion profile was also preventing a unique and robust estimate for the isotropic dispersion using this technique. In agreement with the earlier findings of Förster Schreiber et al. (natascha, 2006) and the modeling of Genzel et al. (genzel08, 2008), the majority of the star forming galaxies modeled have a large component of local random motion, with and a average , with a typical uncertainty of km/s. Low values of the V/sigma ratio in these galaxies suggest that a significant fraction of star-forming disks at may be highly turbulent and geometrically thick. Concurring evidence from kinematics has now also been found in other disk-like systems (e.g., Wright et al. wright, 2007, van Starkenburg et al. vanstark, 2008) and is supported by the large thickness ( kpc) inferred from morphological analysis of candidate edge-on disks based on high resolution HST imaging (Elmegreen & Elmegreen elmeg, 2006).
The dynamical evidence of the presence of such large, rotating and turbulent disks is in agreement with the scenario in which rapid, smooth gas accretion from the halo may play a significant role in the the formation of massive galaxies (Genzel et al. genzel08, 2008). This picture is also supported by recent broad-band observations of high- populations, which have found a fairly tight relation between stellar mass and star formation rate, a sign that steady star formation rates, rather than merger induced short luminous bursts, dominate the stellar assembly of these galaxies (Noeske et al. noeske, 2007; Elbaz et al. elbaz, 2007; Daddi et al. 2007b, ). The most recent dark matter simulations such as the Millennium (Springel et al. springel, 2005) show that subsequent mergers are not frequent enough to convert all disks into elliptical galaxies at , and that most of the mass growth is achieved via mergers less intense than 10:1 or smooth accretion (Genel et al. shy, 2008). Recent hydrodynamic simulations (see e.g. Sommer-Larsen et al. sl03, 2003, Ocvirk et al. ocvirk, 2008, Dekel et al. dekel08, 2008) also show that steady, cold gas streams, which penetrate effectively through the shock-heated media of dark-matter haloes, are a main accretion mechanism for galaxies in this redshift range.
4.1. Comparison between dynamical and stellar mass
Thanks to the multiband coverage of the different fields from which we drew our SINS targets (see Sect. 2.1), we were able to perform a Spectral Energy Distribution (SED) analysis using the available broad-band photometry from the observed optical to near-IR/mid-IR. In particular, as described in detail in Förster Schreiber et al. (survey, 2008), we used data from published works by Erb et al. (2006b, , BX), Daddi et al. (2004a, , K20), Kong et al. (kong, 2006, D3a), Kurk et al. (kurk, 2006, GMASS), Capak et al. (capak, 2007, COSMOS), as well as photometry kindly provided to us by McCracken et al. (in preparation, COSMOS). SED modeling has been carried out by these authors but using different model ingredients or assumptions. In order to ensure more uniformly derived properties among our sample, we re-modeled all the galaxies following the prescriptions described in Förster Schreiber et al. (nataschased, 2004, see also Förster Schreiber et al. survey, 2008). Our results do not differ significantly from the published ones. We used the solar metallicity Bruzual & Charlot (bruzual, 2003) stellar population synthesis models, with a Chabrier Initial Mass Function (IMF) between 0.1 and 100 , and the Calzetti et al. (calzetti, 1994) reddening law. We considered three combinations of star formation history and dust content: constant star formation rate (CSF) and dust, an exponentially declining star formation rate with e-folding timescale of t = 300 Myr and dust (), and a dust-free single stellar population formed instantaneously. We adopted the best of those three cases based on the reduced chi-squared value of the fits (for all the galaxies in the sample, this is either CSF or ). The redshift is kept fixed to the spectroscopic redshift measured from the emission lines detected, while the stellar mass , SFR, star formation history, stellar population age and visual extinction are free parameters. We evaluate the uncertainties through Monte Carlo simulations, where the input photometry is varied randomly assuming the photometric uncertainties are Gaussian. The fitting results for the galaxies of the sample are reported in Table 1.
The reported stellar masses are affected by various uncertainties and systematic errors. In particular, different stellar population synthesis models do not reproduce a consistent picture of evolution in the rest frame NIR (see Marchesini et al. marchesini, 2008). For example, Maraston et al. (maraston, 2006) suggests that the Bruzual & Charlot (bruzual, 2003) stellar population synthesis models used here may overestimate the stellar masses up to a factor of when the bulk of the population in the age range between and Gyr. This is due to a different approach in the treatment of the thermally-pulsing asymptotic giant branch (TP-AGB) phase. However, findings from much larger samples, where the effects of SED modeling can be better and more reliably investigated on a statistical basis, suggest that the correction between the two different approaches can be negligible or up to (see e.g. Berta et al. sberta, 2007, Marchesini et al. marchesini, 2008, Wuyts et al. wuyts, 2007). Accordingly, using the different library of synthetic spectra of Charlot & Bruzual (2007), the stellar masses estimated for our small sample change individually by no more than 20%, while the median of the whole sample remains consistent within 2%. In any case, this correction would make the stellar masses lower, and the offset in the zero point of the high-z Tully-Fisher relation discussed in Sect. 5 will be correspondingly larger.
In four objects of the sample there are independent indications of the presence of an AGN: dynamical and UV spectral evidence suggests the presence of an AGN in D3a-15504 (see Genzel et al. genzel, 2006, Daddi et al. in preparation), BX663 and D3a-7144 show AGN features in optical spectroscopy (Erb et al. 2006c, and Daddi et al. in preparation respectively), while for D3a-6004 a 24 excess was observed by Daddi et al. (in preparation), and a large [NII]/H ratio was measured in our data in the nuclear region of the galaxy (Buschkamp et al. in preparation). The inspection of the optical to K band available SED for these galaxies suggests that this AGN contribution may be biasing the stellar mass estimate towards higher stellar mass in the latter two cases (see Förster Schreiber et al. survey, 2008). We therefore conservatively consider the stellar mass estimate for D3a-6004 and D3a-7144 as an upper limit.
The stellar masses derived for the sample are between , with an average of confirming that all the selected galaxies are drawn from the massive star forming galaxy population at high-z. Thanks to the SED results and our dynamical model, we are able to compare the stellar and dynamical mass of the galaxies. In Fig. 7 these are compared for galaxies in which multi-band photometry is available to constrain the SED fitting. We observe remarkable correlation between the two quantities: the Spearman correlation test gives a probability that the two masses are uncorrelated.
The resulting average dynamical mass at is times larger than the average stellar mass, excluding the sources with a possible AGN contribution. Therefore, given a dark matter contribution of at this radius to the total dynamical mass of such disks (see Genzel et al. genzel08, 2008), we infer a large fraction of gas in the sample galaxies (, or ), although with very large uncertainties. This estimate may be compared with a gas mass derived from the star formation rate surface density using the Schmidt-Kennicutt relation (see Bouché et al. nicolas, 2007). In this way we derive an average gas contribution of 23% to the total dynamical mass of the galaxies, where the difference can be accounted for by the large uncertainties in both our estimate and the extinction correction needed to derive the star formation rates from the detected H fluxes. The gas fraction estimate is also in agreement with the findings of Daddi et al. (daddi08, 2008), who directly observed molecular gas in two BzK galaxies, deriving gas fraction as high as . An alternative possibility is that the stellar mass is significantly underestimated for most of the sample, presumably because of a faded old stellar population that is not detected in the multicolor SED, but would still contribute to the total dynamical and stellar mass (see the discussion by, e.g. Shapley et al. shapley, 2001, Papovich et al. papovich, 2001, and for the galaxies with available IRAC photometry Wuyts et al. wuyts, 2007), or that the dynamical mass is overestimated due to the systematic effects discussed in Sect. 3.2.
Although the stellar population age is not strongly constrained by the SED fitting due to the uncertainty on the star formation history and the degeneracy with extinction, we note that the objects with the higher generally correspond to younger best fitting ages, similar to what was discussed by Erb et al. (2006b, ), and that none of the youngest galaxies has a small mass ratio (see Fig. 8). The significance of the correlation according to the Spearman test gives a probability that the two quantities are uncorrelated. The scatter is in fact high, probably suggesting that these galaxies are not closed systems, and that an important contribution from continuous gas accretion must be considered. This again suggests that the galaxies in the sample are star forming disks with significant gas fraction and gas accretion, where the gas consumption correlates with the stellar population age.
5. The Tully-Fisher relation
The relation between luminosity (or stellar mass) and maximum rotational velocity of disk galaxies has long been known (Tully & Fisher TF, 1977). This Tully-Fisher relation (TFR) has been used as a distance indicator for disk galaxies (e.g. Tully & Pierce tullypierce, 2000, Sandage sandage, 1999), but also as a key feature for understanding the structure and evolution of these galaxies, as it links directly the angular momentum of the dark halo with the luminosity (or mass) of the stellar population in the disk. In fact, according to the standard model for disk galaxy formation (Fall & Efstathiou fall, 1980), disks form out of gas cooling down from a hot halo associated with the dark matter potential well, maintaining its specific angular momentum and settling in a rotationally supported disk (Mo et al. mo, 1998). Consequently, the structure and dynamics of disk galaxies are expected to be closely correlated with the properties of the dark matter halo in which they are embedded, and the observable structural parameters of disks at different cosmic epochs can be used as tracers of the properties of the corresponding halos. The evolution of the stellar mass TFR is expected to be related both to the conversion of gas into stars and to the inside-out growth of the dark matter halo by accretion. In fact, while the extent of the halo grows considerably with time, the circular velocity of the halo grows less keeping the rotation curve approximately flat to larger and larger distances. The accretion of the dark matter is followed by accretion of baryonic gas, which is subsequently converted into stars by ordinary star-formation in the disk. However, the details of the process and the amount of evolution expected depends strongly on the model assumptions, accretion mechanism adopted and the timescale needed to convert the gas into stars. Any successful model of disk formation should then be able to reproduce the slope, zero-point, scatter and redshift evolution of the TFR and other scaling relations. However, reproducing simultaneously the TFR, the shape and normalization of the luminosity function, and the observed sizes, metallicities and colors of disk galaxies is still a challenging task for current models (Courteau et al. courteau, 2007). Therefore, as the normalization, slope and evolution of the TFR depend strongly on the prescription used for the star formation and feedback, as well as on the disk formation mechanism and cosmological parameters, it represents a crucial test for galaxy evolution models (e.g. Silk et al. silk, 1997; Steinmetz & Navarro steinmetz, 1999; van den Bosch vanbosch, 2000, vanbosch02, 2002; Sommer-Larsen et al. sl03, 2003; Dutton et al. dutton, 2007).
In recent years an increasing number of dynamical observations of disk galaxies in the local and intermediate redshift Universe have allowed us to begin exploring the evolution of the TFR with redshift. There are still discrepant results on a possible evolution at intermediate redshifts of the tight relation observed in local samples of disk galaxies (e.g. Haynes et al. haynes, 1999, Pizagno et al. pizagno07, 2007) between the absolute magnitude and the maximum rotational velocity. For example, while Vogt et al. (vogt, 1996) reported very little evolution of the B-band TFR up to , other groups (see e.g. Simard & Pritchet simardpr, 1998, Barden et al. barden, 2003, Nakamura et al. nakamura, 2006 and Böhm et al. bohm, 2004) found a strong brightening of mag in B-band luminosity over the same redshift range.
Furthermore, the interpretation of a possible evolution of a luminosity based TFR is difficult as both the luminosity and the angular momentum might be evolving at the same time. For this reason, the stellar mass TFR, which correlates the stellar mass and the maximum rotational velocities of disks, offers a more physically robust comparison as it involves more fundamental quantities (Bell & de Jong belldj, 2001, McGaugh et al. mcgaugh, 2005, Pizagno et al. pizagno, 2005). In this context, Flores et al. (flores, 2006), Kassin et al (kassin, 2007) and Conselice et al. (conselice, 2005) have found no evolution in both the slope and zero point of the stellar mass TFR up to . On the other hand, Puech et al. (puech, 2008) detect an evolution of the stellar mass TFR zero point of 0.36 dex between and , using a sample of 18 disk-like galaxies observed with the integral field spectrograph GIRAFFE at the VLT. The differences with the results obtained by Flores et al. (flores, 2006) on a similar dataset are attributed to both a difference in the reference local relation and a more accurate measurement of the rotation velocity at high redshift. A very mild evolution was also found in cosmological N-body/hydrodynamical simulations of disc galaxy evolution (Portinari & Sommer-Larsen portinari, 2007, see Sect. 5.1), where the galaxy growth with time since is happening mostly along the TFR. The growth of the disk baryonic mass by infall of gas and mergers between is therefore observed to be accompanied by a correspondingly large increase of the rotation velocity, so that the evolution of individual objects occurs mainly along the TFR.
5.1. The observed Tully-Fisher relation
With the available modeled kinematics of galaxies from our SINS data, we are now able to push, for the first time with a sizeable sample, the investigation of the evolution of the TFR to even higher redshift. When comparing the evolution of the high-z TFR with that inferred from local (or lower redshift) samples of star forming galaxies, one must be aware that we are comparing different classes of objects, which are not necessarily linked from an evolutionary point of view. Therefore any evolution in the relation can not be interpreted straightforwardly as evolution of any individual galaxy, as from to part of our galaxies may undergo significant (morphological/dynamical) evolution driven by efficient secular/internal dynamical processes and/or merging (cf. Genzel et al. genzel08, 2008, Genel et al. shy, 2008). Rather, evolution of TFR represents the evolution of ensemble properties of disk-like populations at different redshifts.
The available full 3D coverage of the dynamical features will not only provide a more complete and detailed view of the kinematics, but will also allow us to avoid the biases and limitations due to slit spectroscopy, such as misalignment of the slit and the major axis, and to identify disturbed rotational patterns avoiding the contamination of our disk-like sample with more complex dynamics. Using similar 3D SINFONI data, Starkenburg et al. (vanstark, 2008) have presented the position of a single galaxy at on the stellar mass TFR, yielding an offset of () from the local one (see Fig. 9). In view of the uncertainties of the quantities involved, which are not insignificant at high-z, larger samples are required to constrain more robustly any offset in the TFR at .
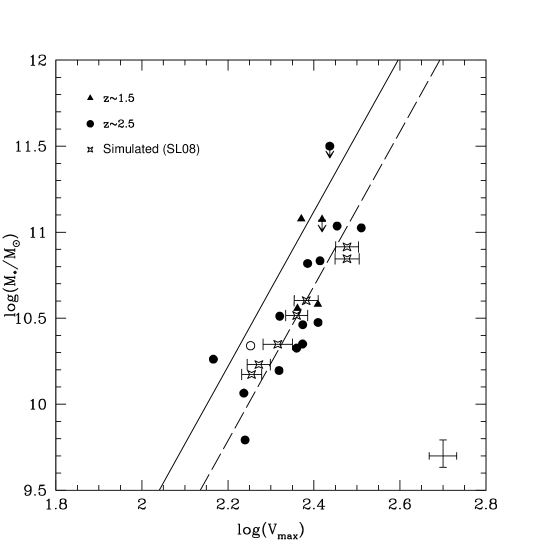
We have therefore used the best fitting Vmax from our dynamical modeling, together with the stellar mass from SED fitting discussed in sect. 4.1, to build the TFR for our sample, shown in Fig. 9. The solid line shows the best fit relation obtained by Bell & de Jong (belldj, 2001). Both are corrected to convert their “diet” Salpeter and Salpeter IMF to the Chabrier IMF used here, using a factor 1.19 and 1.7 respectively. We note that Pizagno et al. (pizagno, 2005) have obtained a shallower () local stellar mass TFR than Bell & de Jong (belldj, 2001, ), but the two relations agree at . However, they used the circular velocity at instead of to estimate of the rotational velocity, and differences in the sample selection may also account for the different result. McGaugh et al. (mcgaugh, 2005) obtained an intermediate slope, , but they explored the total baryonic TFR, including the contribution of the gaseous mass component. In this case, higher gas fraction in lower mass galaxies may explain the flatter slope. Recently Meyer et al. (meyer, 2008) presented the local stellar mass TFR for a large HI-selected sample of galaxies, obtaining a slope consistent to the Bell & de Jong (belldj, 2001) value adopted here for comparison with previous studies.
The circles in Fig. 9 show the data for the galaxies from SINS, while the filled triangles the sources. The open circle is the galaxy presented in van Starkenburg et al. (vanstark, 2008). The average uncertainty is shown as an error bar in the lower right corner. This does not include possible systematic effects both in the SED fitting (see Sect. 4.1) and in the dynamical modeling (see Sect. 3). The galaxies show an evident evolution in the zero point of the TFR. The dashed line shows the best fitting relation keeping the slope fixed at the value found by Bell & de Jong (belldj, 2001). The current data are in fact not yet able to fully constrain the slope of the relation due to the limited statistics and mass range. The best fitting zero point is , where the error is the uncertainty, to be compared with the local , giving a significance of . The relation can be written as , finding an offset in of for a given rotational velocity. We do not find evidence for significant evolution in our sample with respect to the local relation, although the data are still too sparse in this redshift range to place a firm constraint. The evolution observed at is larger than the intermediate 0.36 dex found at by Puech et al. (puech, 2008), although they use a different local reference, suggesting an increasing of the evolution of the TFR with redshift.
5.2. Comparison with galaxy evolution models
Interestingly, the amount of observed evolution in our sample is consistent with the factor of increased velocity for a given stellar mass predicted by Somerville et al. (somerville, 2008) in their semi-analytic formation model of a disk with at this redshift. They follow the classical paradigm for disk formation within massive extended dark matter halos initially proposed by Fall & Efstathiou (fall, 1980) but use a Navarro et al. (nfw, 1997) mass density profile instead of a singular isothermal sphere as halo mass density profile, account for the expected evolution with time of the profile concentration (Bullock et al. bullock, 2001), and for the effect of self-gravity of the baryons in the central part of the halo (so called “adiabatic contraction”). They find that with this refined model the disk rotation velocity at fixed disk mass evolves much more gradually than the halo virial velocity at fixed halo mass, remaining nearly constant and showing the largest evolution between . If this prediction of the model is correct, our sample therefore probes the best suited cosmic epoch to test the evolution of the TFR.
We also compare the observed Tully-Fisher relation with the Smoothed Particle Hydrodynamic (SPH) simulations of disk formation and evolution in a cold dark matter hierarchical clustering scenario by Sommer-Larsen et al. (in preparation) and Portinari & Sommer-Larsen (portinari, 2007). They include in their modeling star formation and stellar feedback effects to delay the collapse of protogalactic gas clouds and allow the infalling gas to preserve a large fraction of its angular momentum. Previous numerical simulations have in fact shown that when only cooling processes are included, the infalling gas loses too much angular momentum, resulting in disks that are much smaller than the observed ones (Navarro & White navarroW, 1994, Navarro & Steinmetz navarroS, 2000). Moreover, chemical evolution with non-instantaneous recycling, metallicity-dependent radiative cooling and the effects of a meta-galactic ultraviolet field, including simplified radiative transfer, were implemented in the simulations. This is an improved version of the models developed by Sommer-Larsen et al. (sl99, 1999, sl03, 2003) to address the angular momentum problem in disk formation models and provide realistic galaxies. It has proven successful in reproducing better than previous numerical models the observed sizes of disk galaxies, the luminosity profile of both disks and bulges, bulge to disk ratios, integrated colors and TFR of local galaxies, as well as the observed peak in the cosmic star formation rate at (Sommer -Larsen et al. sl03, 2003). The models are characterized by a formation mechanism where a large fraction of the gas is accreted onto the forming disk through both rapid cold gas accretion in filamentary structures (dominant at ) and gradual cooling flows from a surrounding hot phase (dominant for ), without abrupt changes of angular momentum orientation, rather than by rapid mergers of massive cold clumps. These simulated galaxies at are shown as open diamonds in Fig. 9. Again, we obtain very good agreement between our data and the predicted position of galaxies on the TFR for a range of stellar masses. In the model the predicted zero point offset is produced by a relevant inside-out mass accretion between and , that do not correspond to an equal increase of the rotation velocity of the galaxies. This issue will be investigated in a forthcoming paper (Sommer-Larsen et al. in preparation). However, if the TFR evolution is driven mainly by dark matter as suggested by the models, this may suggest that the galaxies we are observing at high-z are “stable”, in contradiction with inferences from our detailed studies of several of our disks which appear to be globally unstable to star formation (see Genzel et al. genzel08, 2008).
5.3. The Tully-Fisher relation
Kassin et al. (kassin, 2007) have constructed a stellar mass TFR at using the estimator, in order to take into account disordered or non-circular motions through the gas. In this way, they found a tighter relation up to , with no significant evolution, and conclude that the observed scatter in the TFR is partly due to disturbed and peculiar morphologies, corresponding to lower rotation velocities for their masses. In Fig. 10 the result obtained for our sample using the index is shown, using the fitted as a measure of the intrinsic dispersion of the gas not due to rotation. Although the used here does not exactly match the definition adopted by Kassin et al. (kassin, 2007), it is the best indicator of turbulent and disturbed motion obtained from our modeling. Using the index we also detect an evolution of the relation between and , further supporting the claim of an evolution of the TFR. However, due to the different definition of used here, we do not attempt to quantify this evolution. The resulting scatter is slightly smaller than the already remarkably low one obtained for the classical TFR (see Fig. 9). We suggest that this is due to the optimal selection of our rotational supported systems at , as the SINFONI 3D data are ideal to ensure a much lower contamination from complex dynamics and irregular motions than in longslit datasets.
6. Conclusions
We have presented the dynamical modeling of the full 2D velocity and velocity dispersion fields of the H emission line for 18 star forming galaxies at , observed with the integral field spectrometer SINFONI in the near-IR. The galaxies are selected from the larger sample of the SINS survey, which probes galaxy populations responsible for the bulk of the cosmic star formation activity and stellar mass density at these redshifts, based on the prominence of ordered rotational motions with respect to more complex merger induced dynamics. The quality of the data allows us to model the observed dynamics with suitable simulated exponential disks, and derive the total dynamical mass and maximum rotational velocity of these galaxies.
We find a good correlation between the dynamical mass and the stellar mass derived through SED fitting, deriving that large gas fractions () are required to explain the difference between the two quantities. We also find that the galaxies with younger stellar population age have generally larger gas fractions, as reported by Erb et al. (2006b, ), although the large observed spread could be related to a significant contribution of continuous gas accretion.
We used the derived stellar mass and the of the best fitting disk model of each galaxy to construct for the first time a Tully-Fisher relation at . This is the redshift range where the largest evolution may be expected according to some recent simulations (Somerville et al. somerville, 2008). The full 2D spatial coverage of our data provides a view of the kinematics in unprecedented detail at these redshifts, with which we can avoid the biases and limitations of slit spectroscopy in studying the dynamics of high-z sources. Moreover, the full 2D dynamical information allows us to select a sample with a lower contamination from irregular and complex dynamics, which is better suited for studying the evolution of the TFR in rotationally dominated systems. We find a remarkably low scatter in the Tully-Fisher relation in our sample, and an evolution of the zero point in of for a given rotational velocity, which is fully consistent with the predictions of the latest N-body/hydrodynamical simulations of disks formation and evolution. To reproduce the observed properties of the local and high-z TFR, the SPH model used as comparison (Sommer-Larsen et al. sl99, 1999, sl03, 2003 and in preparation) invokes a formation mechanism where a large fraction of the gas is accreted onto the forming disk through both rapid cold gas accretion in filamentary structures and gradually in a cooling flow from a surrounding hot phase, rather than by rapid mergers of massive cold clumps. This is in qualitative agreement with recent results showing that smooth gas accretion from the halo is required to reproduce the observed properties of a large fraction of the galaxies (see e.g. Förster Schreiber et al. natascha, 2006; Genzel et al. genzel, 2006, genzel08, 2008; Shapiro et al. kristen, 2008; Noeske et al. noeske, 2007; Elbaz et al. elbaz, 2007; Daddi et al. 2007b, ). As already suggested by the velocity-size relation obtained for a larger sample of SINS UV/optically selected galaxies (Bouché et al. nicolas, 2007), the angular momentum properties of these galaxies are very similar to local spirals and intermediate redshift disks. However, these disks show a much larger component of random local gas motion (, and up to an order of magnitude less than spirals), implying high turbulence and scale heights. The random motions could be the result of feedback from the intense star formation (), or be driven by the accreting gas as it settles onto the forming disk (see Genzel et al. genzel08, 2008).
The results obtained confirm that the capabilities of Integral Field Spectroscopy can provide unique insights in the formation and evolution of high-z galaxies, and that large, gas rich, rotating disks, represent a significant population in the universe.
References
- (1) Abraham, R. G., et al. 2004, AJ, 127, 2455
- (2) Abuter, R., Schreiber, J., Eisenhauer, F., Ott, T., Horrobin, M., & Gillesen, S. 2006, New Astronomy Review, 50, 398
- (3) Adelberger, K. L., Steidel, C. C., Shapley, A. E., Hunt, M. P., Erb, D. K., Reddy, N. A., & Pettini, M. 2004, ApJ, 607, 226
- (4) Avni, Y. 1976, ApJ, 210, 642
- (5) Barden, M., Lehnert, M. D., Tacconi, L., Genzel, R., White, S., & Franceschini, A. 2003, arXiv:astro-ph/0302392
- (6) Baugh, C. M. 2006, Reports of Progress in Physics, 69, 3101
- (7) Bell, E. F., & de Jong, R. S. 2001, ApJ, 550, 212
- (8) Berta, S., et al. 2007, A&A, 476, 151
- (9) Binney, J. & Tremaine, S. 2008, Galactic Dynamics, second edition, Princeton University Press, Princeton
- (10) Böhm, A., et al. 2004, A&A, 420, 97
- (11) Bonaccini, D., et al., 2006, SPIE 6272, 627207
- (12) Bonnet, H., et al. 2004, Proc. SPIE, 5490, 130
- (13) Bouché, N., et al. 2007, ApJ, 671, 303
- (14) Bournaud, F., Elmegreen, B. G., & Elmegreen, D. M. 2007, ApJ, 670, 237
- (15) Bournaud, F., et al. 2008, A&A, 486, 741
- (16) Bower, R. G., Benson, A. J., Malbon, R., Helly, J. C., Frenk, C. S., Baugh, C. M., Cole, S., & Lacey, C. G. 2006, MNRAS, 370, 645
- (17) Bruzual, G., & Charlot, S. 2003, MNRAS, 344, 1000
- (18) Bullock, J. S., Kolatt, T. S., Sigad, Y., Somerville, R. S., Kravtsov, A. V., Klypin, A. A., Primack, J. R., & Dekel, A. 2001, MNRAS, 321, 559
- (19) Calzetti, D., Kinney, A. L., & Storchi-Bergmann, T. 1994, ApJ, 429, 582
- (20) Capak, P., et al. 2007, ApJS, 172, 99
- (21) Caputi, K. I., et al. 2007, ApJ, 660, 97
- (22) Chapman, S. C., Blain, A. W., Smail, I., & Ivison, R. J. 2005, ApJ, 622, 772
- (23) Charbonneau, P. 1995, ApJS, 101, 309
- (24) Cimatti, A., et al. 2002, A&A, 381, L68
- (25) Conselice, C. J., Bundy, K., Ellis, R. S., Brichmann, J., Vogt, N. P., & Phillips, A. C. 2005, ApJ, 628, 160
- (26) Courteau, S., Dutton, A. A., van den Bosch, F. C., MacArthur, L. A., Dekel, A., McIntosh, D. H., & Dale, D. A. 2007, ApJ, 671, 203
- (27) Croton, D. J., et al. 2006, MNRAS, 365, 11
- (28) Daddi, E., et al. 2004a, ApJ, 600, L127
- (29) Daddi, E., Cimatti, A., Renzini, A., Fontana, A., Mignoli, M., Pozzetti, L., Tozzi, P., & Zamorani, G. 2004b, ApJ, 617, 746
- (30) Daddi, E., et al. 2007, ApJ, 670, 173
- (31) Daddi, E., et al. 2007, ApJ, 670, 156
- (32) Daddi, E., Dannerbauer, H., Elbaz, D., Dickinson, M., Morrison, G., Stern, D., & Ravindranath, S. 2008, ApJ, 673, L21
- (33) Daigle, O., Carignan, C., Amram, P., Hernandez, O., Chemin, L., Balkowski, C., & Kennicutt, R. 2006, MNRAS, 367, 469
- (34) Davies, R. I. 2007, MNRAS, 375, 1099
- (35) Dekel, A., & Birnboim, Y. 2006, MNRAS, 368, 2
- (36) Dekel, A., et al. 2008, ArXiv e-prints, 808, arXiv:0808.0553
- (37) Dutton, A. A., van den Bosch, F. C., Dekel, A., & Courteau, S. 2007, ApJ, 654, 27
- (38) Eisenhauer, F., et al. 2003, Proc. SPIE, 4841, 1548
- (39) Elbaz, D., et al. 2007, A&A, 468, 33
- (40) Elmegreen, B. G., & Elmegreen, D. M. 2006, ApJ, 650, 644
- (41) Erb, D. K., Shapley, A. E., Pettini, M., Steidel, C. C., Reddy, N. A., & Adelberger, K. L. 2006, ApJ, 644, 813
- (42) Erb, D. K., Steidel, C. C., Shapley, A. E., Pettini, M., Reddy, N. A., & Adelberger, K. L. 2006, ApJ, 646, 107
- (43) Erb, D. K., Steidel, C. C., Shapley, A. E., Pettini, M., Reddy, N. A., & Adelberger, K. L. 2006, ApJ, 647, 128
- (44) Fall, S. M., & Efstathiou, G. 1980, MNRAS, 193, 189
- (45) Flores, H., Hammer, F., Puech, M., Amram, P., & Balkowski, C. 2006, A&A, 455, 107
- (46) Förster Schreiber, N. M., et al. 2004, ApJ, 616, 40
- (47) Förster Schreiber, N. M., et al. 2006, ApJ, 645, 1062
- (48) Förster Schreiber, N. M., et al. 2008, in preparation
- (49) Franx, M., et al. 2003, ApJ, 587, L79
- (50) Hopkins, A. M., & Beacom, J. F. 2006, ApJ, 651, 142
- (51) Genel, S., et al. 2008, ApJ, in press
- (52) Genzel, R., et al. 2006, Nature, 442, 786
- (53) Genzel, R., et al. 2008, ApJ, in press
- (54) Giavalisco, M. 2002, ARA&A, 40, 579
- (55) Grazian, A., et al. 2007, A&A, 465, 393
- (56) Guo, Q., & White, S. D. M. 2008, MNRAS, 384, 2
- (57) Hanish, D. J., et al. 2006, ApJ, 649, 150
- (58) Haynes, M. P., Giovanelli, R., Chamaraux, P., da Costa, L. N., Freudling, W., Salzer, J. J., & Wegner, G. 1999, AJ, 117, 2039
- (59) Holland, J. H. 1975, Adaptation in Natural and Artificial Systems, Ann Arbor: Univ. of Michigan Press
- (60) Immeli, A., Samland, M., Gerhard, O., & Westera, P. 2004, A&A, 413, 547
- (61) Kassin, S. A., et al. 2007, ApJ, 660, L35
- (62) Kennicutt, R. C., Jr. 1998, ARA&A, 36, 189
- (63) Kereš, D., Katz, N., Weinberg, D. H., & Davé, R. 2005, MNRAS, 363, 2
- (64) Kitzbichler, M. G., & White, S. D. M. 2007, MNRAS, 376, 2
- (65) Kong, X., et al. 2006, ApJ, 638, 72
- (66) Koopmann, R. A., Kenney, J. D. P., & Young, J. 2001, ApJS, 135, 125
- (67) Krajnović, D., Cappellari, M., de Zeeuw, P. T., & Copin, Y. 2006, MNRAS, 366, 787
- (68) Kurk, J. D., et al. 2006, ArXiv Astrophysics e-prints, arXiv:astro-ph/0604132
- (69) Law, D. R., Steidel, C. C., Erb, D. K., Larkin, J. E., Pettini, M., Shapley, A. E., & Wright, S. A. 2007, ApJ, 669, 929
- (70) Lilly, S. J., et al. 2007, ApJS, 172, 70
- (71) Maraston, C., Daddi, E., Renzini, A., Cimatti, A., Dickinson, M., Papovich, C., Pasquali, A., & Pirzkal, N. 2006, ApJ, 652, 85
- (72) Marchesini, D., van Dokkum, P. G., Forster Schreiber, N. M., Franx, M., Labbe’, I., & Wuyts, S. 2008, arXiv:0811.1773
- (73) McGaugh, S. S. 2005, ApJ, 632, 859
- (74) Meyer, M. J., Zwaan, M. A., Webster, R. L., Schneider, S., & Staveley-Smith, L. 2008, MNRAS, 391, 1712
- (75) Mo, H. J., Mao, S., & White, S. D. M. 1998, MNRAS, 295, 319
- (76) Monaco, P., Fontanot, F., & Taffoni, G. 2007, MNRAS, 375, 1189
- (77) Naab, T., Johansson, P. H., Ostriker, J. P., & Efstathiou, G. 2007, ApJ, 658, 710
- (78) Nakamura, O., Aragón-Salamanca, A., Milvang-Jensen, B., Arimoto, N., Ikuta, C., & Bamford, S. P. 2006, MNRAS, 366, 144
- (79) Navarro, J. F., & White, S. D. M. 1994, MNRAS, 267, 401
- (80) Navarro, J. F., Frenk, C. S., & White, S. D. M. 1997, ApJ, 490, 493
- (81) Navarro, J. F., & Steinmetz, M. 2000, ApJ, 538, 477
- (82) Noeske, K. G., et al. 2007, ApJ, 660, L43
- (83) Noguchi, M. 1999, ApJ, 514, 77
- (84) Ocvirk, P., Pichon, C., & Teyssier, R. 2008, ArXiv e-prints, 803, arXiv:0803.4506
- (85) Papovich, C., Dickinson, M., & Ferguson, H. C. 2001, ApJ, 559, 620
- (86) Peng, C. Y., Ho, L. C., Impey, C. D., & Rix, H.-W. 2002, AJ, 124, 266
- (87) Pizagno, J., et al. 2005, ApJ, 633, 844
- (88) Pizagno, J., et al. 2007, AJ, 134, 945
- (89) Portinari, L., & Sommer-Larsen, J. 2007, MNRAS, 375, 913
- (90) Puech, M., et al. 2008, A&A, 484, 173
- (91) Rabien, S., Davies, R. I., Ott, T., Li, J., Abuter, R., Kellner, S., & Neumann, U. 2004, Proc. SPIE, 5490, 981
- (92) Reddy, N. A., Erb, D. K., Steidel, C. C., Shapley, A. E., Adelberger, K. L., & Pettini, M. 2005, ApJ, 633, 748
- (93) Robertson, B., Bullock, J. S., Cox, T. J., Di Matteo, T., Hernquist, L., Springel, V., & Yoshida, N. 2006, ApJ, 645, 986
- (94) Robertson, B. E., & Bullock, J. S. 2008, ArXiv e-prints, 808, arXiv:0808.1100
- (95) Rudnick, G., et al. 2006, ApJ, 650, 624
- (96) Sandage, A. 1999, ApJ, 527, 479
- (97) Shapiro, K. et al. 2008, ArXiv e-prints, 802, arXiv:0802.0879
- (98) Shapley, A. E., Steidel, C. C., Adelberger, K. L., Dickinson, M., Giavalisco, M., & Pettini, M. 2001, ApJ, 562, 95
- (99) Silk, J. 1997, ApJ, 481, 703
- (100) Simard, L., & Pritchet, C. J. 1998, ApJ, 505, 96
- (101) Somerville, R. S., et al. 2008, ApJ, 672, 776
- (102) Sommer-Larsen, J., Gelato, S., & Vedel, H. 1999, ApJ, 519, 501
- (103) Sommer-Larsen, J., Götz, M., & Portinari, L. 2003, ApJ, 596, 47
- (104) Springel, V. et al. 2005, Nature, 435, 629
- (105) Steidel, C. C., Shapley, A. E., Pettini, M., Adelberger, K. L., Erb, D. K., Reddy, N. A., & Hunt, M. P. 2004, ApJ, 604, 534
- (106) Steinmetz, M., & Navarro, J. F. 1999, ApJ, 513, 555
- (107) Tacconi, L. J., & Young, J. S. 1986, ApJ, 308, 600
- (108) Tacconi, L. J., et al. 2008, ArXiv e-prints, 801, arXiv:0801.3650
- (109) Tully, R. B., & Fisher, J. R. 1977, A&A, 54, 661
- (110) Tully, R. B., & Pierce, M. J. 2000, ApJ, 533, 744
- (111) van den Bosch, F. C., 2000, ApJ, 530, 177
- (112) van den Bosch, F. C. 2002, MNRAS, 332, 456
- (113) van Dokkum, P. G.,Kriek, M., Rodgers, B., Franx, M., & Puxley, P. 2005, ApJ, 622, L13
- (114) van Starkenburg, L., van der Werf, P. P., Franx, M., Labbe, I., Rudnick, G., & Wuyts, S. 2008, ArXiv e-prints, 806, arXiv:0806.3369
- (115) Vogt, N. P., Forbes, D. A., Phillips, A. C., Gronwall, C., Faber, S. M., Illingworth, G. D., & Koo, D. C. 1996, ApJ, 465, L15
- (116) Wright, S. A., et al. 2007, ApJ, 658, 78
- (117) Wuyts, S., et al. 2007, ApJ, 655, 51


| Galaxy | Select. | Band | Scale | Exp. Time | Age | H | SFR | |||
|---|---|---|---|---|---|---|---|---|---|---|
| (arcsec) | (s) | () | (Gyr) | ( cgs) | () | |||||
| Q1623-BX447 | 2.148 | 20.55 | BX | K | 0.125 | 14400 | 2.12 | 0.51 | 8.3 | 55 |
| Q1623-BX663 | 2.434 | 19.92 | BX | K | 0.125 | 28800 | 6.58 | 0.81 | 12.0 | 100 |
| SSA22-MD41 | 2.172 | - | BX | K | 0.125 | 28800 | 0.62 | 0.05 | 11.5 | 73 |
| Q2343-BX389 | 2.174 | 20.18 | BX | K | 0.125 | 14400 | 6.82 | 2.75 | 23 | 146 |
| Q2343-BX610 | 2.211 | 19.21 | BX | K | 0.125 | 21600 | 10.7 | 1.01 | 32 | 211 |
| Q2346-BX416 | 2.241 | 20.30 | BX | K | 0.125 | 7200 | 2.24 | 0.40 | 11 | 75 |
| Q2346-BX482 | 2.258 | - | BX | K | 0.05 | 31800 | 2.90 | 0.40 | 21 | 146 |
| K20-ID8 | 2.224 | 19.74 | K20 | K | 0.125 | 29400 | 3.25 | 0.45 | 11 | 73 |
| K20-ID9 | 2.036 | 19.94 | K20 | K | 0.125 | 34200 | 1.16 | 0.13 | 9.0 | 48 |
| D3a-15504 | 2.383 | 19.20 | BzK | K | 0.05 | 20400 | 10.9 | 0.45 | 27 | 214 |
| D3a-6004 | 2.387 | 37.63 | BzK | K | 0.125 | 36000 | 0.64 | 20 | 159 | |
| D3a-7144 | 1.650 | 18.70 | BzK | H | 0.125 | 7200 | 0.40 | 11 | 34 | |
| D3a-4751 | 2.266 | 18.94 | BzK | K | 0.125 | 3600 | 1.83 | 0.20 | 5.8 | 41 |
| D3a-6397 | 1.514 | 18.11 | BzK | H | 0.125 | 9600 | 11.9 | 0.20 | 21 | 57 |
| ZC782941 | 2.182 | 18.94 | BzK | K | 0.05 | 12600 | 2.99 | 0.14 | 20 | 123 |
| ZC1101592 | 1.404 | 19.43 | BzK | H | 0.125 | 3600 | 3.81 | 0.29 | 7.4 | 16 |
| GK2471 | 2.430 | 20.93 | 4.5 | K | 0.125 | 23400 | 1.57 | 0.13 | 4.3 | 35 |
| GK1084 | 1.552 | 19.31 | 4.5 | H | 0.125 | 13200 | 3.61 | 0.08 | 5.0 | 13 |
| Galaxy | ||||||
|---|---|---|---|---|---|---|
| ( | ( | (km/s) | (kpc) | (km/s) | ||
| Q1623-BX447 | 46 (+6-4) | 11.9 (+0.6-1) | 6.5 | - | 6.22 | 229 |
| Q1623-BX663 | 28 (+6-6) | 13.0 (+0.8-1) | 7.5 | 40 (+24-26) | 6.49 | 243 |
| SSA22-MD41 | 49 (+16-5) | 6.8 (+1.9-0.4) | 3.5 | 78 (+7-12) | 5.87 | 174 |
| Q2343-BX389 | 76 (+8-24) | 13.9 (+0.6-0.9) | 7.7 | - | 6.21 | 259 |
| Q2343-BX610 | 33 (+6-3) | 23.4 (+9.7-0.5) | 11 | 68 (+14-18) | 5.38 | 324 |
| Q2346-BX416 | 21 (+7-3) | 7.7 (+0.5-0.4) | 2.0 | - | 1.90 | 236 |
| Q2346-BX482 | 51 (+11-8) | 12.3 (+3.5-0.7) | 7.1 | 52 (+13-21) | 6.35 | 237 |
| K20-ID8 | 52 (+6-5) | 9.85 (+0.4-0.3) | 4.7 | - | 5.36 | 209 |
| K20-ID9 | 52 (+11-2) | 7 (+2-2) | 3.5 | 39 (+28-25) | 7.51 | 173 |
| D3a-15504 | 37 (+7-6) | 16.0 (+0.4-0.3) | 9.0 | 44 (+24-22) | 5.31 | 284 |
| D3a-6004 | 30 (+35-10) | 16 (+5-1) | 9.8 | 58 (+12-24) | 6.60 | 273 |
| D3a-7144 | 18 (+14-3) | 16.1 (+0.6-0.7) | 7.0 | - | 5.08 | 262 |
| D3a-4751 | 16 (+13-4) | 4.7 (+0.6-0.3) | 1.8 | 32 (+27-21) | 4.11 | 147 |
| D3a-6397 | 38 (+7-9) | 12 (+4-3) | 8.4 | 41 (+16-26) | 7.62 | 235 |
| ZC782941 | 39 (+4-7) | 14 (+4-3) | 4.8 | 68 (+12-24) | 3.60 | 257 |
| ZC1101592 | 84 (+4-5) | 15 (+0.9-1) | 2.8 | 35 (+15-18) | 5.70 | 257 |
| GK2471 | 70 (+18-36) | 9 (+5-4) | 3.3 | - | 3.82 | 208 |
| GK1084 | 49 (+9-5) | 12 (+2-2) | 4.8 | 52 (+21-26) | 4.66 | 230 |