57 second oscillations in Nova Centauri 1986 (V842 Cen)
Abstract
High speed photometry in 2008 shows that the light curve of V842 Cen possesses a coherent modulation at 56.825 s, with sidebands at 56.598 s and 57.054 s. These have appeared since this nova remnant was observed in 2000 and 2002. We deduce that the dominant signal is the rotation period of the white dwarf primary and the sidebands are cause by reprocessing from a surface moving with an orbital period of 3.94 h. Thus V842 Cen is an intermediate polar (IP) of the DQ Herculis subclass, is the fastest rotating white dwarf among the IPs and is the third fastest known in a cataclysmic variable. As in other IPs we see no dwarf nova oscillations, but there are often quasi-periodic oscillations in the range 350 – 1500 s. There is a strong brightness modulation with a period of 3.78 h, which we attribute to negative superhumps, and there is an even stronger signal at 2.886 h which is of unknown origin but is probably a further example of that seen in GW Lib and some other systems. We used the Swift satellite to observe V842 Cen in the ultra-violet and in X-rays, although no periodic modulation was detected in the short observations. The X-ray luminosity of this object appears to be much lower than that of other IPs in which the accretion region is directly visible.
keywords:
binaries – close – novae – stars: oscillations – stars: individual: V842 Cen, cataclysmic variables1 Introduction
Nova Centauri 1986 (later designated V842 Cen) was discovered on 22 November 1986 at and two days later reached maximum at (McNaught 1986). It was a moderately fast nova, with decay time d and developed an obscuring dust shell starting 37 d after maximum and reaching greatest optical thickness 74 d after maximum, placing it in the group II category of nova light curves as defined by Duerbeck (1981), which is essentially of DQ Herculis type. The pre-eruption brightness was estimated by McNaught (1986) to be in the range . Fifteen years after eruption it was at (Downes & Duerbeck 2000; Woudt & Warner 2003), and our latest measurements give . Therefore 22 years after maximum it is still about two magnitudes above its pre-nova brightness, which could be a result of irradiation enhanced mass transfer caused by a still very hot white dwarf primary, especially if it is relatively massive (see Warner (2002) for a discussion of anomalous post-nova luminosities arising from this effect), though Kato (2008) reports that there is nothing in the eruptive behaviour to suggest a mass much greater than 0.7 M⊙. DQ Her, also a moderately fast nova ( d), but of low mass (0.60 M⊙: Horne, Welsh & Wade 1993), reached its maximum optical thickness dust obscured phase 101 d after maximum light; it was at prior to its 1934 eruption (Robinson 1975) and yet had returned to that level less than 20 years later (Walker 1956).
Sekiguchi et al. (1989) give distance estimates that average 1.0 kpc from strengths of interstellar Na D lines and the 2200 Å feature, and a reddening of E(B-V) = 0.55. Gill & O’Brien (1998) in 1995 detected an ejecta shell of diameter arcsec in direct imaging.
There is nothing in the nova development of V842 Cen that marks it as in any way peculiar. The UV and soft X-Ray turn-off times are normal (González-Riestra, Orio & Gallagher 1998) and the abundances (including a high carbon content typical of dusty ejecta) are within the normal ranges (Andrea, Drechsel & Starrfield 1994), except that Iben (1992) found that V842 Cen was the only nova with a He/H ratio falling between two groups having solar and half-solar values.
Recent spectra, however, show peculiarities that are relevant to the present state of the primary in V842 Cen. An optical spectrum obtained in 2003 (Schmidtobreick et al. 2005) shows a strong blue continuum with weak high ionization lines, e.g. C IV, probably coming from the nova ejecta but indicative of a hot central source, yet accompanied by strong Balmer lines extending to high series components and by He I emission lines, with only moderate He II and 4650 Å Bowen fluorescence lines. These are more characteristic of dwarf novae spectra than of old novae. Schmidtobreick et al. (2005) find that the much older nova XX Tau (Nova Tauri 1927, d) has a similar unusual emission line spectrum and suggest that both of these novae could be currently in states of low rates of mass transfer ().
Finally, previous high speed photometry of V842 Cen, carried out in 2000 (Woudt & Warner 2003: hereafter WW03), showed extreme activity with flares up to 0.25 mag on time scales min but no evident orbital or short period coherent brightness modulations, though there were quasi-periodic oscillations (QPOs) on time scales s. A parallel was drawn with the light curve of TT Ari, which is a high nova-like cataclysmic variable (CV).
With a view to checking whether V842 Cen had changed its light curve character in the 8 years since it was last observed we made an initial exploration in February 2008, and the surprising result led us to concentrate on it for the remainder of that and the following observing run. The optical observations are described and analysed in Section 2, X-Ray observations in Section 3, and a discussion is given in Section 4.
2 Optical Observations and Analysis
Our observations were made with the University of Cape Town’s frame transfer CCD photometer (O’Donoghue 1995) attached to the 74-in Radcliffe telescope at the Sutherland site of the South African Astronomical Observatory. All photometry was unfiltered (i.e. in white light), with 6 s integrations, and a white dwarf standard star was used to provide an approximate V magnitude scale. The observing runs are listed in Table 1.
| Run | Date of obs. | HJD of first obs. | Length | V |
|---|---|---|---|---|
| (start of night) | (+2450000.0) | (h) | (mag) | |
| S7791 | 2008 Feb 17 | 4514.54882 | 2.14 | 16.2 |
| S7795 | 2008 Feb 18 | 4515.45960 | 3.18 | 16.3 |
| S7798 | 2008 Feb 19 | 4516.45845 | 4.34 | 16.3 |
| S7803 | 2008 Mar 13 | 4539.41017 | 5.83 | 16.3 |
| S7806 | 2008 Mar 14 | 4540.39963 | 3.67 | 16.3 |
| S7809 | 2008 Mar 16 | 4542.39838 | 6.25 | 16.3 |
| S7811 | 2008 Mar 17 | 4543.43785 | 3.05 | 16.3 |
| S7813 | 2008 Mar 18 | 4544.40490 | 6.12 | 16.2 |
Fig. 1 shows the light curves for February 2008 (note that V842 Cen was only accessible at the end of the night for a maximum of about 4 hours) and Fig. 2 shows the March 2008 light curves. In the latter we have phased the light curves on a period of 3.780 h, for reasons explained below.


Comparison with the 2000 light curves (WW03) shows one immediately obvious change – there are now recurrent peaks of amplitude mag on a time scale h. A more subtle addition appears when comparing the high frequency parts of the Fourier transforms (FTs) of individual runs in June 2000, February 2008 and March 2008. As seen in Fig. 3, a modulation at s has appeared in the interval. There is no sign of this in a short run made in March 2002 (WW03).

2.1 The 57 s brightness oscillation
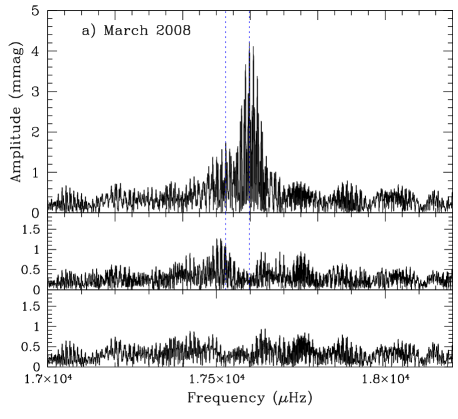
We start our analysis by concentrating on the neighbourhood of the s signal. The FT for the combined March 2008 light curves, which have a five day baseline, is shown in Fig. 4a (we have omitted run S7813 where the interruption in the light curve causes problems in the FT). The dominant feature is the window pattern of the data set, centred on 56.825 0.001 s, with an amplitude of 4.2 mmag (we estimate uncertainties from the formal errors of fitting sine curves by least squares). Prewhitening with that modulation leaves a signal on the low frequency side (visible at the position of the dashed line in Fig. 4a) with period 57.054 0.002 s and amplitude 1.6 mmag. This is equivalent to a sideband splitting of 70.5 0.5 Hz. Prewhitening with both sinusoids simultaneously leaves no significant signal in this region, as seen in the lower plot in Fig. 4a.
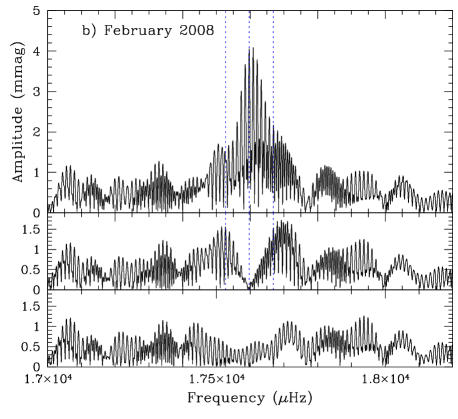
The FT for the combined February 2008 light curves is shown in Fig. 4b. The dominant signal over the three day baseline is at 56.828 0.002 s, and amplitude of 3.9 mmag. The periods and amplitudes in the two data sets indicate a stable modulation, within errors of measurement. As can be seen in the FT, the lower frequency sideband is also present, but there is evidence for a longer frequency sideband overlapping the principal window pattern. A three sinusoid fit to the light curve gives 57.055 s and 56.598 s for the two sidebands, both with uncertainty 0.005 s and amplitude 1.7 mmag. Prewhitening with these three modulations leaves no significant signal in the region, as seen in the lower plot of Fig. 4b.
The frequency difference between the principal signal and the longer frequency sideband is 71.6 2.3 Hz, which is within errors the same as the splitting on the low frequency side. This arrangement, of equally split sidebands, even with a variation of amplitude in one sideband, is the recognizable structure of an intermediate polar (IP). Denoting the spin frequency of the white dwarf primary as and the orbital frequency as , we have detected the components , , and , which are characteristic of an IP (Warner 1986). The variable amplitude of the one sideband is consistent with reprocessed radiation from a rotating source, not simply amplitude modulation of a single source.
The FTs for individual runs do not resolve the sidebands and as a result the amplitude of the 57 s modulation varies on the 70.0 Hz, or 3.94 h, time scale. Selecting a section where the amplitude is maximal enables us to show the 57 s directly in the light curve – Fig. 5.

In the FTs there are no signs of harmonics or a subharmonic to the 57 s modulations. The uncertainties in the 56.825 s signal are just too large to enable the gap between the February and March 2008 observations to be bridged without ambiguity, so a more accurate period cannot be offered.
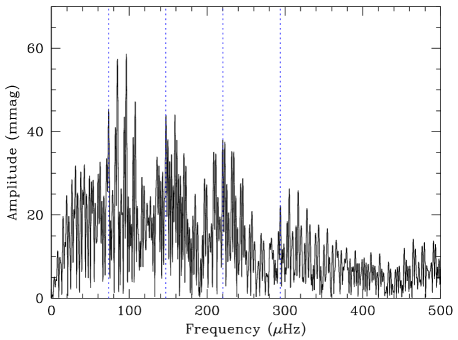
2.2 Orbital and superhump periods
We now turn to the low frequency end of the FTs, seen in Fig. 6 for the March 2008 runs (the February data are too sparse to give useful additional information). The strongest signal is at 96.23 0.01 Hz, or 2.886 h, with amplitude 60 mmag and no detectable harmonics, which we will discuss later. Prewhitening at that frequency leaves a strong signal at 73.46 0.07 Hz, or 3.780 h and strong higher harmonics. This is the period chosen to phase the light curves in Fig. 2. The average light curve of the March 2008 data at this period is shown in Fig. 7. From the general appearance of the light curve – its narrow and variable peak profiles – it looks more like a superhump modulation than an orbital modulation. The mean amplitude of the peaks is mag. From the discussion in the previous section we would expect that any orbital modulation would appear at 70.0 0.5 Hz, equivalent to a period of 3.94 0.03 h. But there is no evidence for this in the FT. But not to despair – it was already pointed out in WW03 that the absence of a signal implies that V842 Cen probably has a low orbital inclination. On the other hand, the amplitudes of superhumps are known to be independent of inclination (e.g. Warner 1995), so the existence of large amplitude superhumps is not a surprise. But what we see is that in V842 Cen they are negative superhumps, with a period 4.1% shorter than the inferred . Again we draw attention to the similarities between the light curve of V842 Cen and that of TT Ari, which has = 3.30 h and for much of the time negative superhumps at a period 3.4% shorter (Skillman et al. 1998).

2.3 Quasi-periodic oscillations
We see no sign of any dwarf nova oscillations (DNOs), which might be expected with periods s, but the light curves and FTs show occasional presence of QPOs over the range 350 – 1500 s, often with re-occurrence during a particular run. We show here only an example of a train of s QPOs in one of the light curves (Fig. 8).

2.4 The 2.89 h modulation
The strong signal at 2.886 h is sinusoidal, as seen in the mean light curve of the March 2008 data: Fig. 9. This period bears no obvious relationship to the orbital or superhump periods; its ratio to is 1/1.37. Our only current suggestion is that it is another example of the mysterious ‘GW Lib’ phenomenon, of which other examples are given in table 2 of Woudt, Warner & Pretorius (2004). There, the periodic signals in GW Lib, Aqr1, FS Aur and HS 2331 are listed; the last named has a modulation with a period that is also smaller than its .

3 X-ray and UV observations
The multi-wavelength Swift satellite (Gehrels et al. 2004) observed V842 Cen in July 2008; the two twin-snapshot observations are summarised in Table 2. The target was clearly seen by the X-ray telescope in Photon Counting mode (Burrows et al. 2005) in both observations. The UV-optical telescope (Roming et al. 2005) was operated in the blocked filter wheel position for the first observation, and with the uvw1 filter (central wavelength: 2600 Angstroms) in event mode for the same exposure time as the XRT in the second.
| 2008 Date of obs. | XRT exp. | XRT count rate | uvw1 |
|---|---|---|---|
| (UT) | (s) | (c/ks) | (mag) |
| Jul 11 14:03 - 16:05 | 2998 | ||
| Jul 20 10:07 - 13:49 | 2954 |
The data were reduced using version 2.9 of the Swift analysis software and calibration database. XRT grade 0-12 keV events from V842 Cen were extracted from a radius region around the source, with the background taken from a surrounding annulus; the count rates corrected for PSF losses and bad pixels are given in Table 2. Like the count rates, XRT spectra from the two observations were compared and found to be consistent. We used xpsec to perform unconstrained spectral fits to the total X-ray spectrum, fitting an optically thin plasma emission model (mekal) absorbed by cold gas (phabs); having just 35 source counts, we used Cash statistics in finding the best fit parameter values and their 90% confidence errors. These are cm-2, consistent with the reddening reported in Section 1, and keV; the best fit has C-stat for bins. The observed keV flux is erg cm-2 s-1, corresponding to a bolometric luminosity at 1 kpc of erg s-1, where the range accounts for the uncertanty in the fitted parameters. We used standard Fourier and period-folding techniques, but with the small number of X-ray counts, it is not surprising that we find no evidence for variability at the periods reported in this work.
The UVOT uvw1 magnitudes were calculated by running the Ftool uvotmaghist on the two sky images, using the standard source aperture of . These magnitudes were consistent, and the flux-average magnitude is reported in Table 2. Cleaned UVOT event lists were created following the standard steps in the UVOT Users’ Guide111http://swift.gsfc.nasa.gov/docs/swift/analysis/ and light-curves extracted using uvotevtlc; they show mild variability possibly like the quieter sections of the V-band light-curves of Figs. 1 and 2. We made fast Fourier transforms of the 1 s binned UVOT light-curves, but found no evidence of the 57 s period nor of the 350 s QPO; the two 1505 s and 1445 s light-curves separated by 2.9 hr do not allow a search for the longer periods. Folding the two lightcurves together at the 56.825 s period, we used sine wave fitting to derive a 90% confidence upper limit to the modulation amplitude of %. This can be compared to the 1150-2500 Angstrom continuum DQ Her spin period amplitudes of % and % measured by Silber et al. (1996).

4 Discussion
A variety of brightness modulations have been found in other nova remnants. Of stable oscillations the best known, of course, is that at 71.1 s found in DQ Her (Nova Herculis 1934) by Walker (1956). A similar case was later found – the 63.63 s in V533 Her (Nova Herculis 1963), but was only visible for a few years (Patterson 1979). More recently, several other nova remnants have been found to have stable short periodicities (e.g. Nova Per 1901, 351 s: Watson, King & Osborne 1985; Nova Sct 1975, 258 s: Woudt & Warner 2003). From the essential mono-periodicity (though often with orbital sidebands) of these examples, and their similarity to the more slowly rotating IPs (see Chapters 7 and 8 of Warner (1995)), the periodicities in all such systems are ascribed to rotation of magnetic white dwarf primaries.
V842 Cen has the shortest white dwarf rotation period currently known for a nova remnant, and the third shortest known solid body rotation for any CV white dwarf – the other two being the nova-like AE Aqr ( = 33.06 s) and the dwarf nova WZ Sge ( = 27.87 s) (Warner & Pretorius 2008). There are reasons for classifying the shortest period IPs into a separate subclass – the DQ Herculis class (see introduction to Chapter 8 of Warner (1995)), in which case V842 Cen is the first far southern hemisphere DQ Her star.
DNOs, oscillations of lower coherence and short period, common among high CVs such as dwarf novae in outburst and in nova-like variables, and DNO-related QPOs (for a review see Warner (2004)), have been found in only two nova remnants, namely RR Pic (Nova Pictoris 1925), where transient oscillations are seen in the range 20 – 40 s, with preference for s (Warner 1981; Schoembs & Stolz 1981) and GK Per, where s oscillations are related to the 351 s rotation of the primary (Hellier et al. 2004). A current explanation for DNOs is found in magnetic accretion from the inner regions of the accretion disc onto a low inertia, slipping equatorial accretion belt. If the primary has a field strong enough to prevent the formation of a slipping equatorial belt DNOs are not expected, leading to mutual exclusion of DNOs and solid body rotational signals (Warner 2004), which is as seen in V842 Cen.
General kilosecond QPOs, although common in nova-likes, are also found in only a few novae (e.g. BT Mon and V533 Her) – Warner (2004). But here again there is similarity between V842 Cen and TT Ari – the latter has QPOs extending over the range 900 – 1500 s (Kim et al. 2008).
The lack of observable modulation in the Swift data from V842 Cen is not constraining. However the bolometric X-ray luminosity of erg s-1 is significantly lower than the values for the IPs tabulated by Warner (1995) and the average quiescent erg s-1 derivable from Ezuka and Ishida (1999) when distance is accounted for. We note that DQ Her has a keV luminosity of erg s-1 (Mukai et al. 2003), but in this case the high system inclination is believed to block a direct view of the accretion regions. Because many IPs have complex X-ray absorption, and we do not have many counts in the X-ray spectrum of V842 Cen, it is possible that our simple spectral model underestimates its true luminosity (and maximum temperature). Even so, a relatively low accretion rate for this IP would appear to be a natural conclusion.
The spectroscopic evidence that V842 Cen could have a low (Section 1, above) is in conflict with the photometric results: a precessing disc, as deduced from the presence of superhumps, is a characteristic of a high system, especially if the orbital period is greater than 3 h (e.g. Murray et al 2000). However, a lessening , resulting from reduction of irradiation-driven mass loss as the white dwarf cools after eruption, would be expected, and this could be the reason for appearance of the rotation modulation between 2002 and 2008. Indeed, the almost universal absence of DNOs among nova remnants is probably caused by the post-eruption high crushing weak magnetospheres down to the surface of the primary. Only strong fields can make their presence known in the decades after eruption – these are the four nova remnants that are certain IPs, with another thirteen possibles (Mukai 2008).
Acknowledgments
We acknowledge Dr Claire Blackman for useful discussions about QPOs. We also acknowledge the referee, Dr Peter Wheatley, for helpful comments. PAW’s research is supported by the National Research Foundation and the University of Cape Town; BW’s research is supported by the University of Cape Town; JO and KP acknowledge the support of the STFC.
References
- [1] Andrea J., Drechsel H., Starrfield S., 1994, A&A, 291, 869
- [2] Burrows D.N., et al., 2005, Space Science Review, 120, 165
- [3] Downes R.A., Duerbeck H.W., 2000, AJ, 120, 2007
- [4] Duerbeck H.W., 1981, PASP, 93, 165
- [5] Ezuka, H., Ishida, M., 1999, ApJSS, 120, 277
- [6] Gehrels, N., et al., 2004, ApJ, 611, 1005
- [7] Gill C.D., O’Brien, T.J., 1998, MNRAS, 300, 221
- [8] González-Riestra R., Orio M., Gallagher J., 1998, A&AS, 129, 23
- [9] Hellier C., Harmer S., Beardmore A.P., 2004, MNRAS, 349, 710
- [10] Horne K., Welsh W.F., Wade R.A., 1993, ApJ, 410, 357
- [11] Iben I., 1992, ASP Conf. Ser. 30, 307
- [12] Kim Y., et al., 2008, A&A, in press
- [13] McNaught R.H., 1986, IAUC, 4274
- [14] Mukai, K., et al., 2003, ApJ, 594, 428
-
[15]
Mukai K., 2008,
http://asd.gsfc.nasa.gov/Koji.Mukai/iphome/catalog/alpha.html - [16] Murray J.R., Warner B., Wickramasinghe D.T., 2000, MNRAS, 315, 707
- [17] O’Donoghue D., 1995, Baltic Ast, 4, 517
- [18] Patterson J., 1979, ApJ, 233, L13
- [19] Robinson E.L., 1975, AJ, 80, 515
- [20] Roming P.W.A., et al., 2005, Space Science Review, 120, 95
- [21] Schmidtobreick L., Tappert C., Bianchini A., Mennickent R.E., 2005, A&A, 432, 199
- [22] Schoembs R., Stoltz B., 1981, IBVS, 1986, 1
- [23] Sekiguchi K., Feast M.W., Fairall A.P., Winkler H., 1989, MNRAS, 241, 311
- [24] Silber, A.D., et al., 1996, ApJ, 462, 428
- [25] Skillman D.T., et al., 1998, ApJ, 503, L67
- [26] Walker M.F., 1956, ApJ, 123, 68
- [27] Warner B., 1981, MNRAS, 195, 101
- [28] Warner B., 1986, MNRAS, 219, 347
- [29] Warner B., 1995, Cataclysmic Variable Stars, Cambridge Univ. Press, Cambridge
- [30] Warner B., 2002, Amer. Inst. Phys. Conf. Proc. 637, 3
- [31] Warner B., 2004, PASP, 116, 115
- [32] Warner B., Pretorius M.L., 2008, MNRAS, 383, 1469
- [33] Watson M.G., King A.R., Osborne J., 1985, MNRAS, 212, 917
- [34] Woudt P.A., Warner B., 2003, MNRAS, 340, 1011 (WW03)
- [35] Woudt P.A., Warner B., Pretorius M.L., 2004, MNRAS, 351, 1015