The second order phase transition in QCD phase diagram and a new approach for locating critical point using RHIC low energy scan data
Abstract
It is shown that the RHIC energy-scan experiments can serve as an effective tool for studying the system evolution along the first order phase transition line passing the critical point, which is a second order phase transition process. During this process the system structure changes while passing the critical point, and correspondingly, the transverse momentum of the final state particles gets an extra component. This phenomenon can provide useful information about the system structure in different phases and can serve as an effective signal for locating the critical point.
Experimental evidence for the long-expected new state of matter — quark-gluon plasma QGP [1] has been observed at the relativistic heavy ion collider RHIC in Brookheaven National Lab (BNL) [2]. It opens a new era for the study of the phase diagram of quantum chromodynamics QCD [3].
The first question is: of which order is the phase transition between hadron gas and QGP. This has been studied carefully [4]. It turns out that for the realistic case of 3 massive quarks, the transition at zero chemical potential is an analytic crossover [4][5]. On the other hand, at zero temperature the transition turns out to be of the first order [6]. These indicate that the first order phase transition line ends at a certain point, referred to as critical point [3] (temperature and baryon chemical potential ). At even lower and higher the transition is a smooth crossover. The first order phase transition line and the crossover-band [7] constitute the phase boundary between hadron gas and QGP.
As is well known, when a system evolves along the phase boundary, moving from the first order phase transition line to the crossover region, it experiences a second order phase transition. During this transition the system structure undergoes a qualitative change while passing the critical point. The aim of the present article is to discuss how to experimentally study such a second order phase transition and, in particular, how to examine the change in system-structure during this transition and how to locate the critical point.
At BNL the RHIC experiments have started a “low energy scan” project [8] to perform the collision of two nuclei A+A, e.g. Au+Au, at various energies lower than the top RHIC energy GeV. The primary goal of this project is to locate the critical point.
Many variables have been proposed to identify the critical point [9]. The basic idea of these methods is to study the A+A collisions at different energies separately and to see whether any one of them possess the peculiar property of critical point, e.g. abnormally large fluctuations of some variable(s), such as transverse momentum , K/ ratio, etc..
In the present article we will show that the same energy-scan data can be used in a different, more natural, way, i.e. instead of considering the A+A collisions at different energies separately, take the energy-scan data as a whole and use it to study the second order phase transition process when the system evolves along the first order phase transition line passing through the critical point and entering the crossover region.
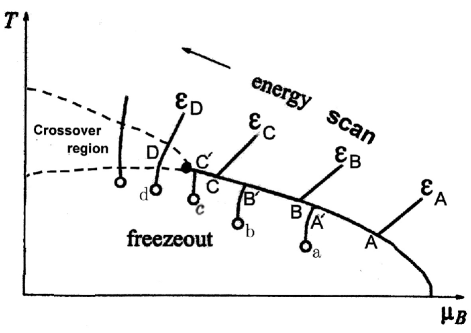
In Fig. 1 is shown a schematic plot for the evolution of the systems produced in the energy scan of heavy ion collisions A+A at various energies [10]. After thermalization the initial energy densities of the produced systems are , , , …. As the systems expand, temperature decreases and the systems arrive at the phase boundary , , in Fig. 1. At this time the systems are purely partonic and a first order phase transition starts. Since the systems are adiabatic, temperature increases due to the release of latent heat and the systems move up along the phase transition line 111In case of isothermal phase transition the temperatures and chemical potentials of the two phases will always keep equal to the critical values while the two phases co-exist during the first order transition. The whole transition process occurs at a single point on the - plane. In that case the latent heat released will be absorbed by an external heat-bath.. When the whole systems are converted to hadronic phase at the points , , , they depart the phase transition line, and freeze out to final state particles at the points , , . On the other hand, if the initial energy density is as high as , the system will pass through the crossover region , and freezes out at .
The systems at the points , , , , , , …in Fig. 1 are produced in A+A collisions at different . They are different systems. However, since they are assumed to have arrived thermal equilibrium, there is no difference whether they are produced in A+A collisions at different or they are coming from the evolution of a single system through exchanging heat and particle with an imaginary external heat- and particle-bath. In particular, we can take the viewpoint that when the system produced at energy evolves and arrives at the point , it does not depart the phase transition line, but continues to move along this line through exchanging heat and particle with an “external bath”, and eventually arrives at , , , , , and in this way accomplishes a second order phase transition process.
In general, during a second order phase transition process the system structure should undergo a qualitative change while passing the critical point. Then what is the qualitative structure-change when the system undergoes the above-mentioned second order phase transition process in QCD phase diagram? In other words, how is the system different in structure at the left and right sides of the critical point, i.e. at crossover and first order phase transition regions respectively? This problem has been studied in detail in Ref. [11]. Let us give here a brief review.
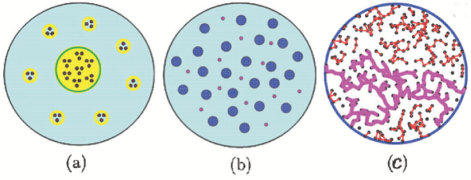
Usually the transition from hadron phase to QGP is assumed to proceed through the fusion of hadrons to a large region of free-moving quarks and gluons, and the latter is conventionally referred to as QGP-droplet, cf. Fig. 2(a). We refer to this kind of hadron aggregation as gas-like aggregation. It is the natural scheme for a first order phase transition, where a coexistence of hadronic and partonic phases with a phase boundary in between is expected in the intermediate stage. However, when this mechanism is applied to the analytic-crossover process [12, 13], there will be in the intermediate stage a mixture of colored partons and color-singlet hadrons in a gaseous state, cf. Fig. 2(b), which contradicts color-confinement and is, therefore, unacceptable. To solve this problem a new form of hadron aggregation — molecule-like aggregation (MAM) is proposed [11], where the quarks in adjacent hadrons are allowed to penetrate through the potential barrier between the hadrons and bond the hadrons to cluster. The hadrons in a cluster then become colored objects, which will be referred to as cells, and only the cluster as a whole is color-singlet. The 2-cell, 3-cell, …clusters are in fact a special kind of multi-quark hadrons, which is unallowed at zero temperature but appear at high temperature.
As temperature increases, the average size of cluster increases, and when an infinite cluster, which in a finite system is a cluster extending from one boundary to the other, is formed, we say that a new phase — QGP appears. The crossover process is then simply the formation and growth up of color-singlet clusters and no contradiction with color confinement any more, cf. Fig. 2(c).
The assumption on two kinds of hadron aggregation or MAM, is successful in providing a crossover scheme consistent with color confinement. To have an experimental check for this assumption is important. The RHIC energy-scan experiments can serve for this purpose.
According to MAM when the system moves along the first order phase transition line, passing through the critical point and entering the crossover region, i.e. moves along in Fig. 1, its structure undergoes the change from gas-like aggregation to molecule-like aggregation, i.e. the basic element of the system changes from single particle — single parton at the points , , ; and single hadron at the points , , and , , — to cluster. As a result the cells in clusters obtain a new vibration degree of freedom in comparison with the single particles in gas-like aggregation case,
The basic experimental observable in heavy ion collisions is the momentum distribution of final state particles. In particular, the first order moment of transverse momentum distribution, i..e. the average transverse momentum, versus the c.m. energy is usually used to characterize the excitation of the system. This is a slowly increasing smooth curve, refereed to as base line of excitation in the following discussion, which is coming from two origins: the random thermal motion and ordered collective flow. Note that even at the left of critical point, i.e. in the crossover region, the vibration degree of freedom does not contribute to the excitation base line, because the thermal excitation of vibration is frozen.
When the system departs the crossover region with the decreasing of temperature, the infinite cluster dissociates and the large clusters break up to smaller ones. At the freeze-out point only small clusters survive. Upon freeze out the small clusters break up to single cells — hadrons, turning the zero point vibration energy inside clusters to the excitation energy of hadrons. Thus when the system evolves along the first order phase transition line, passing through the critical point and entering the crossover region, the excitation gets an extra component, which is transformed from the zero point vibration energy inside clusters, i.e. we have
| (1) |
where and are the transverse momenta of the frozen-out hadrons coming from the transverse expansion of the system (radial flow) and from the thermal motion, respectively, while denotes the excitation components transformed from the zero point vibration inside clusters.
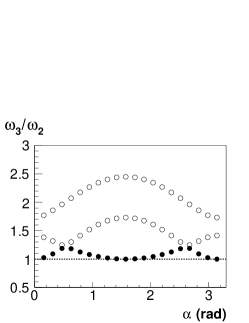
Let be the vibration frequency of a 2-cell cluster. A 3-cell cluster with equal length and strength of bonds and equal mass of cells has 3 vibration modes. The corresponding frequencies are shown in Fig. 3 [14]. For energy reason the realized mode is the lowest frequency one, shown in Fig. 3 as solid symbols. These frequencies are within 1 – 1.2 . We assume that at the freeze-out point all the cells posses a vibration frequency which takes value not far from . The momentum distribution corresponding to the zero-point vibration of this frequency is
| (2) |
where is the mass of the cell. The vibration component of average transverse momentum can be calculated from this distribution.
There are at present quite a number of published data for heavy ion collision at different energies. However, the colliding nuclei and the quality of data vary widely, and it is hard to compare the data from different experiments due to the different systematic errors. To check the above prediction the high quality energy-scan data with high statistics are expected.
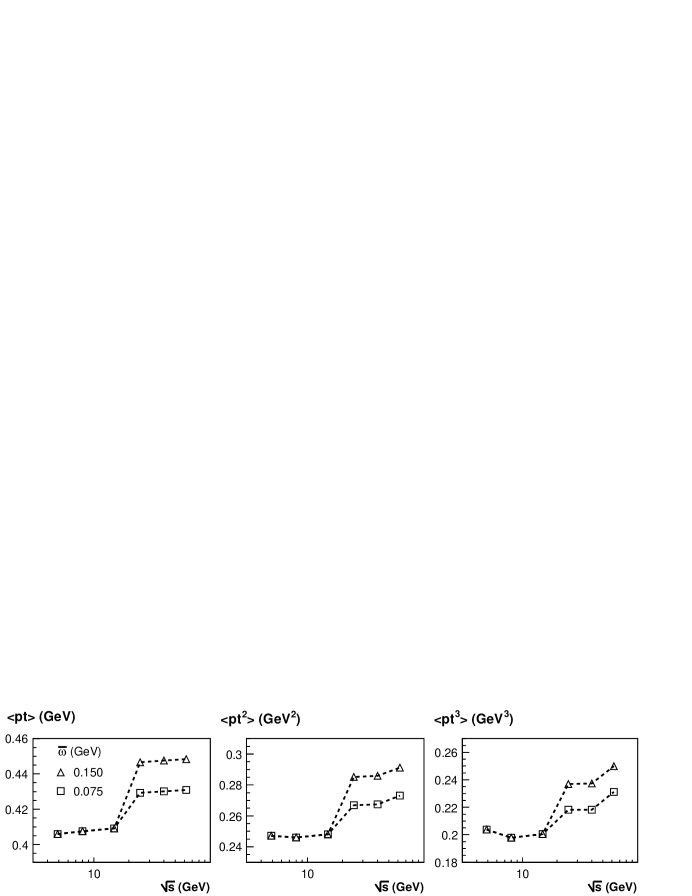
In order to get an idea about how large is the effect of we simulate the “radial flow plus thermal motion” base line of excitation through interpolating the experimentally fitted parameters and [15] of Au-Au collisions at 4.88 and 62.3 GeV. Assuming that the critical point is located in this energy region, e.g. at GeV, the resulting first, second and third order moments of transverse momentum are plotted in Fig’s. 4 for 4 different values of . In the calculation the mean mass of pion, kaon and proton, averaged according to the ratio of their yields, are used. The ordinates in Fig’s. 4 are, therefore, the transverse-momentum moments of the inclusive charged hadron.
It can be seen from Fig’s. 4 that a jump in moments at the critical point on top of the base line is clearly visible in all cases. For and 150 MeV the relative rise for the first, second and third order moments are 4.9, 7.6, 8.8 % and 9.2, 14.9, 18.2 %, respectively. This effect should be observable in a high quality data.
It can also be seen from Fig’s. 4 that the amount of moment-rising is sensitive to the value of . Therefore, if a moment rising is observed in the energy-scan experiments, then through fitting the data we can get the value of , and, wherefrom, obtain the information about the bond strength in the clusters, which is a piece of useful issue in the study of QCD phase structure.
Furthermore, the place of the -moment-rising can be used for locating the critical point in experiments. This method of locating critical point has two advantages in comparison with the commonly suggested signal of critical point [9] basing on the large fluctuations at this point.
1) From thermodynamic consideration it can be shown that some variable(s), e.g. energy density, will have large fluctuations at the critical point. When this is used to locate the critical point, one has to study the event-by-event fluctuations of some variable(s), e.g. the e-by-e fluctuations of transverse momentum , K/ ratio, etc.. However, since the number of particle in a single event is finite, these dynamical fluctuations are inevitably contaminated by the statistical ones. Various attempts have been made to eliminate the statistical fluctuations [16], but none of them are decisive. It is unclear whether such a kind of fluctuation-signal for critical point could survive after eliminating the statistical fluctuations. On the contrary, the moments used in the present approach are averaged over the whole event sample instead of event-by-event, and, therefore, are free from the contamination of statistical fluctuations.
2) It is obvious that in the first round the energy scan will be performed with large steps between different colliding energies. If it is not by occasion that some energy used in the first round just locates at the vicinity of the fluctuation peak, we will see nothing in the first round while measuring the fluctuations, and the subsequent scan has to be carried out in finer steps over the whole energy range. On the contrary, if the moments have a sudden rise when passing through the critical point, then already in the first round of energy scan we will be able to observe a rise of these moments, provided the statistics is high and the error bars are small. Most probably the critical point is located in the region of the moment-rising. Then the further scan could be concentrated in this region and the critical point, signaled by the abrupt jump of the moments, can be catched in this way.
In summary, it is argued that the RHIC energy-scan data taken as a whole can be used to study the system evolution along the first order phase transition line, passing the critical point and entering the crossover region. This is a second order phase transition process. During this process the system structure changes from gas-like to molecule-like, i.e. the basic element of the system changes from single hadron to cluster while passing the critical point. Correspondingly, the transverse momentum of the final state particles get an extra component coming from the zero-point vibration of clusters, which can be observed in experiments as an abrupt rise of -moments. This phenomenon can provide us useful information about the system structure in different phases and can serve as a signal for locating the critical point.
The proposed signal for critical point is encouraging but is not unique. In the experimental study for locating critical point, a combination of the signal proposed in the present article with other signals [9] will provide a more decisive conclusion.
Acknowledgement This work is supported by NSFC under projects No.10775056, 10835005 and 10847131. The authors thank F. Wang, N. Xu, Z.-B. Xu and X.-N. Wang for helpful discussions and comments.
References
References
- [1] T.D. Lee and G.C. Wick, Phys. Rev. D 9, 2291 (1974); T.D. Lee, Rev. Mod. Phys. 47, 267 (1975); E.V. Shuryak, Phys. Rept. 61, 71 (1980).
- [2] J. Adams et al. (STAR Collaboration), Nucl. Phys. A 757, 102 (2005); K. Adcox et al. (PHENIX Collaboration), Nucl. Phys. A 757, 184 (2005).
- [3] For recent reviews see, T. Schäfer, lecture given at HUGS 2005, arXiv:hep-ph/0509068; M. Stephanov, Prog. Theor. Phys. Suppl. 153, 139 (2004); Int. J. Mod. Phys. A 20, 4387 (2005).
- [4] F. R. Brown et al., Phys. Rev. Lett. 65, 2491 (1990)).
- [5] Y. Aoki et al., Nature (London) 443, 675 (2006).
- [6] M. A. Halasz et al., Phys. Rev. D 58, 096007 (1998).
- [7] Z. Fodor, arXiv:0712.2930[hep-lat].
- [8] G. S. F. Stephans, J. Phys. G 32, S447 (2006).
- [9] See, e.g., M. Stephanov, K. Rajagopal, and E. Shuryak, Phys. Rev. D 60, 114028 (1999) and the papers cited therein.
- [10] M. Stephanov, K. Rajagopal, and E. Shuryak, Phys. Rev. Lett. 81, 4816 (1998) and the papers cited therein.
- [11] Xu Mingmei, Yu Meiling and Liu Lianshou, Phys. Rev. Lett. 100, 092301 (2008).
- [12] M. Hofmann, M. Bleicher, S. Scherer, L. Neise, H. Stöcker and W. Greiner, Phys. Lett. B 478, 161 (2000).
- [13] Z. W. Lin, C.M. Ko, B.A. Li, B. Zhang and Subrata Pal, Phys. Rev. C 72, 064901 (2005); C.M. Ko, in 4th International Workshop on Critical Point and Onset of Deconfinement, Darmstadt, 2007 (unpublished).
- [14] L.D. Landau and E.M. Lifshitz, Course of theoretical physics (Volume 1, 3rd edition, Reed Educational and Professional Publishing Ltd., 1976), p. 73-74.
- [15] B. Abelev et al. (STAR Collaboration), arXiv:0808.2041 [nucl-ex]; C. Muntz (E802 Collaboration), arXiv:nucl-ex/9806002.
- [16] S.A. Voloshin, V. Koch and H.G. Ritter, Phys. Rev. C 60, 024901 (1999); K. Adcox et al. (PHENIX Collaboration), Phys. Rev. C 66, 024901 (2002); CERES Collaboration, Nucl.Phys. A 727, 97 (2003); Fu Jinghua and Liu Lianshou, Phys. Rev. C 68, 064904 (2003); Liu Lianshou and Fu Jinghua , Chin. Phys. Lett. 21, 1467 (2004); Xu Mingmei and Liu Lianshou, Int. J. Mod. Phys. A 21, 5241 (2006).