Linking pre– and proto–stellar objects in the intermediate-/high-mass star forming region IRAS 05345+3157 ††thanks: Based on observations carried out with the IRAM Plateau de Bure Interferometer. IRAM is supported by INSU/CNRS (France), MPG (Germany) and IGN (Spain). ††thanks: The Submillimeter Array is a joint project between the Smithsonian Astrophysical Observatory and the Academia Sinica Institute of Astronomy and Astrophysics, and is funded by the Smithsonian Institution and the Academia Sinica.
Abstract
Context. To better understand the initial conditions of the high-mass star formation process, it is crucial to study at high-angular resolution the morphology, the kinematics, and eventually the interactions of the coldest condensations associated with intermediate-/high-mass star forming regions.
Aims. The paper studies the cold condensations in the intermediate-/high-mass proto-cluster IRAS 05345+3157, focusing the attention on the interaction with the other objects in the cluster.
Methods. We have performed millimeter high-angular resolution observations, both in the continuum and several molecular lines, with the PdBI and the SMA. In a recent paper, we have already published part of these data. The main finding of that work was the detection of two cold and dense gaseous condensations, called N and S (masses and M⊙), characterised by high values of the deuterium fractionation ( in both cores) obtained from the column density ratio (N2D+)/(N2H+). In this paper, we present a full report of the observations, and a complete analysis of the data obtained.
Results. The millimeter maps reveal the presence of 3 cores inside the interferometers primary beam, called C1-a, C1-b and C2. None of them are associated with cores N and S. C1-b is very likely associated with a newly formed early-B ZAMS star embedded inside a hot-core, while C1-a is more likely associated with a class 0 intermediate-mass protostar. The nature of C2 is unclear. Both C1-a and C1-b are good candidates as driving sources of a powerful 12CO outflow, which strongly interacts with N, as demonstrated by the velocity gradient of the gas along this condensation. The N2H+ linewidths are between and 2 km s-1 in the region where the continuum cores are located, and smaller ( km s-1) towards N and S, indicating that the gas in the deuterated condensations is more quiescent than that associated with the continuum sources. This is consistent with the fact that they are still in the pre–stellar phase and hence the star formation process has not yet taken place in there.
Conclusions. The study of the gas kinematics across the source indicates a tight interaction between the deuterated condensations and the sources embedded in the millimeter cores. For the nature of N and S, we propose two scenarios: they can be low-mass pre–stellar condensations or ’seeds’ of future high-mass star(s). From these data however it is not possible to establish how the turbulence triggered by the neghbouring cluster of protostars can influence the evolution of the condensations.
Key Words.:
Stars: formation – Radio lines: ISM – ISM: individual (IRAS 05345+3157) – ISM: molecules1 Introduction
The initial conditions of the star formation process are still a matter of debate. Studies have begun to unveil the chemical and physical properties of starless low-mass cores on the verge of forming low-mass stars (Kuiper et al. 1996; Caselli et al. 2002a, 2002b; Tafalla et al. 2002, 2006), demonstrating that in the dense and cold nuclei of these cores, C-bearing molecular species such as CO and CS are strongly depleted (e.g. Caselli et al. 2002b; Tafalla et al. 2002), while N-bearing molecular ions such as N2D+ and N2H+ (Caselli et al. 2002a, 2002b; Crapsi et al. 2005) maintain large abundances in the gas phase, and their column density ratios reach values of or more, much higher than the cosmic [D/H] elemental abundance (, Oliveira et al. 2003).
The characterisation of the earliest stages of the formation process of high-mass stars is more difficult than for low-mass objects, given their shorter evolutionary timescales, larger distances, and strong interaction with their environments. Nevertheless, significant progress has been made by various authors who have performed extensive studies aimed at the identification of massive protostellar candidates, i.e. very young ( yr), massive (MM⊙) stellar objects which have not yet ionised the surrounding medium (Molinari et al. 1996; Sridharan et al. 2002; Fontani et al. 2005). On the other hand, the pre–protostellar stage, namely the phase in which a cold starless core evolves towards the onset of the formation of a high-mass protostar, has not yet been investigated in great detail, even though in the last few years an increasing effort has been devoted to this study (see e.g. Wang et al. 2006; Zhang et al. 2009; Beuther & Sridharan 2007).
Many ultracompact (UC) Hii regions are located in clusters (see e.g. Thompson et al. 2006), and it is common to find massive young stellar objects in different evolutionary stages in the same star forming region (Kurtz et al. 2000). Therefore, one expects to find even earlier phases of massive star formation in the vicinity of UC Hii regions and/or other “signposts” of massive star formation activity. With this in mind, several authors have recently searched for cold and dense spots in the neighbourhood of luminous IRAS point sources (Fontani et al. 2006), UC Hii regions (Pillai et al. 2007) and methanol masers (Hill et al. 2006). In particular, Fontani et al. (2006) have searched for N2D+ emission in the gas associated with 10 luminous IRAS sources with the IRAM-30m telescope, and detected deuterated gas in 7 out of the 10 sources observed.
The object of the present work is one of the sources studied by Fontani et al. (2006), which stands out for its very interesting characteristics: it is a high-mass (M⊙, Fontani et al. 2006) dusty clump, undetected in the MSX 8m band, located nearby the luminous IRAS point source 05345+3157 (″ to the N-E). The region is located at a distance of 1.8 kpc (Zhang et al. 2005), and its surface density ( gr cm-2) and mass-to-luminosity ratio () indicate that it is potentially a site of massive star formation (see Fig. 1 of Chakrabarti & McKee 2005). Hereafter, we will call our target I05345. Previous interferometric studies have reavealed a clumpy structure of the molecular gas in I05345 (Molinari et al. 2002). From IRAM-30m data, Fontani et al. (2006) have measured an average CO depletion factor (ratio between expected and observed CO abundance) of and an average deuterium fractionation (the column density ratio between a deuterated species and the corresponding one containing hydrogen) of , three orders of magnitude higher than the cosmic [D/H] abundance. These findings would indicate for the very first time the possible presence of a high-mass pre–stellar core (with K and cm-3 ), analogous to those detected in several low-mass star forming regions. However, the angular resolution was insufficient to determine whether we are dealing with a single high-mass core or instead with a sample of low-mass ones.
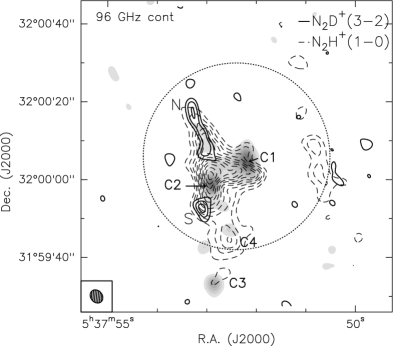
Therefore, we have recently mapped I05345 at high-angular resolution in the N2H+ (1–0) line with the IRAM Plateau de Bure Interferometer (PdBI), and in the N2H+ and N2D+ (3–2) lines with the Submillimeter Array (SMA), in order to derive a detailed map of the deuterium fractionation in the source. Simultaneously, we have obtained observations in the continuum at , and GHz with the two interferometers, as well as in several lines of other molecules. The preliminary results of these observations, focused mainly on the deuterium fractionation derived from the N2H+ and N2D+ data, have been published in a recent work (Fontani et al. 2008, hereafter paper I). For completeness, in Fig. 1 we summarise the main observational results of that work, by showing: (i) the 3 mm continuum observed with PdBI, which reveals the presence of 4 cores, one of which outside the interferometer primary beam. (ii) the distribution of the intensity of the N2H+ (1–0) line, which is extended and with a complex structure; (iii) the distribution of the N2D+ (3–2) line integrated emission, concentrated in two condensations, called N and S. The integrated emission of the N2H+ (3–2) line (not shown in Fig. 1) is compact, and detected towards the strongest continuum peak only. In paper I we have derived the masses of N and S, which are and M⊙, respectively. Also, from the N2D+ /N2H+ column density ratio we have obtained a deuterium fractionation of in both condensations, which are the typical values derived in low-mass pre–stellar cores.
In this work we present a full report of the observations presented in paper I, and a complete analysis of the data obtained. In Sect. 2 we describe the observations and the data reduction, while the results are presented in Sect. 3. In Sect. 4 we derive the main physical parameters, which are then discussed in Sect. 5. The main findings of this work are summarised in Sect. 6.
2 Observations and data reduction
2.1 Submillimeter Array observations
Observations of N2D+ (3–2) (at 231321 MHz) and N2H+ (3–2) (at 279511.7 MHz) towards I05345 were carried out with the SMA (Ho et al. 2004) in the compact configuration on 30 January and 21 February 2007, respectively. The correlator was configured to observe the continuum emission and several other molecular lines simultaneously (see Table 1). The phase centre was the nominal position of the sub-mm peak detected with the JCMT (Fontani et al. 2006), namely R.A.(J2000)=05h37m52.4s and Dec.(J2000)=32∘00′06′′, and the local standard of rest velocity is km s-1. For gain calibrations, observations of I05345 were alternated with the quasars 3C111 and J0530+135. Quasar 3C279 and Callisto were used for passband and flux calibration, respectively. The SMA data were calibrated with the MIR package (Qi 2005), and imaged with MIRIAD (Sault et al. 1995). Channel maps were created with natural weighting, attaining a resolution of: 3.′′73.′′0 for the N2D+ (3–2) channel map; 3.′′02.′′8 for the 225 GHz continuum image; 2.′′72.′′0 for the N2H+ (3–2) channel map; 1.′′91.′′2 for the 284 GHz continuum image. At the assumed distance of 1.8 kpc, these values translate into spatial resolutions of and pc at 225 GHz and 284 GHz, respectively (i.e. 5000 and 2000 A.U., respectively). The 3 level in the 225 and 284 GHz continuum images is 0.006 and 0.018 Jy beam-1, respectively.
The spectral resolution in velocity for the N2D+ and N2H+ (3–2) was 0.53 and 0.44 km s-1, respectively. All the lines observed are listed in Table 1: in Cols. 1 and 2 we give the transitions observed and the line rest frequency, respectively; Col. 3 gives the spectral resolution; Col. 4 reports on the detection (Y) or non-detection (N) of the transition, and the 3 level in the channel maps of the detected transitions is given in Col. 5.
| Transition | Spec. Resol. | Detection | 3 | |
|---|---|---|---|---|
| (GHz) | (km s-1) | (Jy beam-1) | ||
| SMA | ||||
| C18O (2–1) | 219.560 | 0.55 | Y | 0.18 |
| HNCO (10–9) | 219.798 | 0.55 | N | |
| H2C13O (31,2–21,1) | 219.909 | 0.55 | N | |
| SO (56–45) | 219.949 | 0.55 | Y | 0.12 |
| CH3OH (80,3–71,3) | 220.079 | 0.55 | Y | 0.15 |
| HCOOCH3 (17–16) | 220.167 | 0.55 | N | |
| 13CO (2–1) | 220.399 | 0.55 | Y | 0.16 |
| CH3CN (12–11) | 220.539 – 220.747b | 0.55 | Y | 0.15 |
| HC5N (83–82) | 220.937 | 0.55 | N | |
| CH3OH (8-1,8–70,7) | 229.759 | 0.53 | Y | 0.18 |
| CH3OH (32,4–41,4) | 230.027 | 0.53 | N | |
| 12CO (2–1) | 230.538 | 1.0 | Y | 0.15 |
| OCS (19–18) | 231.062 | 0.50 | Y | 0.21 |
| 13CS (5–4) | 231.220 | 0.50 | Y | 0.21 |
| CH3OH (102,2–93,2) | 231.286 | 0.50 | N | |
| N2D+ (3–2) | 231.321 | 0.52 | Y | 0.21 |
| CH3OH (91,9–80,8) | 278.305 | 0.44 | N | |
| N2H+ (3–2) | 279.512 | 0.44 | Y | 1.0 |
| OCS (23–22) | 279.685 | 0.44 | N | |
| DCO+ (4–3) | 288.144 | 0.44 | N | |
| DCN (4–3) | 288.664 | 0.44 | N | |
| C34S (6–5) | 289.209 | 0.44 | N | |
| CH3OH (6–5) | 289.307 – 290.939c | 0.44 | N | |
| SiS (16–15) | 290.380 | 0.44 | N | |
| PdBI | ||||
| N2H+ (1–0) | 93.173 | 0.25 | Y | 0.03 |
a: for the detected transitions only
b: minimum and maximum frequencies corresponding to the components K=7 and K=0, respectively
c: minimum and maximum frequencies corresponding to the components () and (), respectively
2.2 Plateau de Bure Interferometer observations
We observed the N2H+ (1–0) line at 93173.7725 MHz towards I05345 with the PdBI on 11 and 20 August 2006, in the D configuration, and on 3 April 2007 in the C configuration. In Table 1, the spectral resolution in velocity is given. We used the same phase reference and velocities as for the SMA observations. The nearby point sources 0507+179 and 0552+398 were used as phase calibrators, while bandpass and flux scale were calibrated from observations of 3C345 and MWC349, respectively. For continuum measurements, we placed two 320 MHz correlator units in the band when making the observations in D configuration, and six 320 MHz correlator units in C configuration. The N2H+ lines were excluded in averaging these units to produce the final continuum image (at MHz). The synthesised beam size of the N2H+ channel map was 3.′′23.′′4, while that of the continuum was 3.′′13.′′2 , which translates into a spatial resolution of pc. The 3 level in the continuum image is Jy beam-1. We stress that the observations of the N2H+ (1–0) and N2D+ (3–2) lines have approximately the same angular resolution. The data have been reduced with the GILDAS software, developed at IRAM and the Observatoire de Grenoble.
2.3 Combining SMA and NRAO data for 12CO (2–1)
The problem of the missing short spacing information on the SMA data of the 12CO (2–1) line can be solved combining the SMA data with the peviously published 12CO (2–1) map from the NRAO-12m telescope (Zhang et al. 2005). For observing details on the single-dish observations we refer to the paper by Zhang et al. (2005). The single-dish data were converted to visibilities in the MIRIAD package with the task UVMODEL. The interferometer and single-dish data were then processed together. The synthesised beam of the combined data is 2.87′′3.60′′ (PA 42°). For more details on the method adopted see e.g. Zhang et al. (2007).
2.4 Data reduction
The N2H+ (1–0), (3–2), and N2D+ (3–2) rotational transitions have hyperfine structures. To take this into account, we fitted the lines using METHOD HFS of the CLASS program, which is part of the GAG software developed at IRAM and the Observatoire de Grenoble. This method assumes that all the hyperfine components have the same excitation temperature and width, and that their separation is fixed to the laboratory value. The method also provides an estimate of the total optical depth of the lines, based on the intensity ratio of the different hyperfine components. For the rest frequencies of the N2H+ and N2D+ lines, we have used the laboratory values given in Crapsi et al. (2005). We have not applied the corrections given in Pagani et al. (2008), since these are well below the spectral resolution of our observations.
3 Results
3.1 Continuum maps
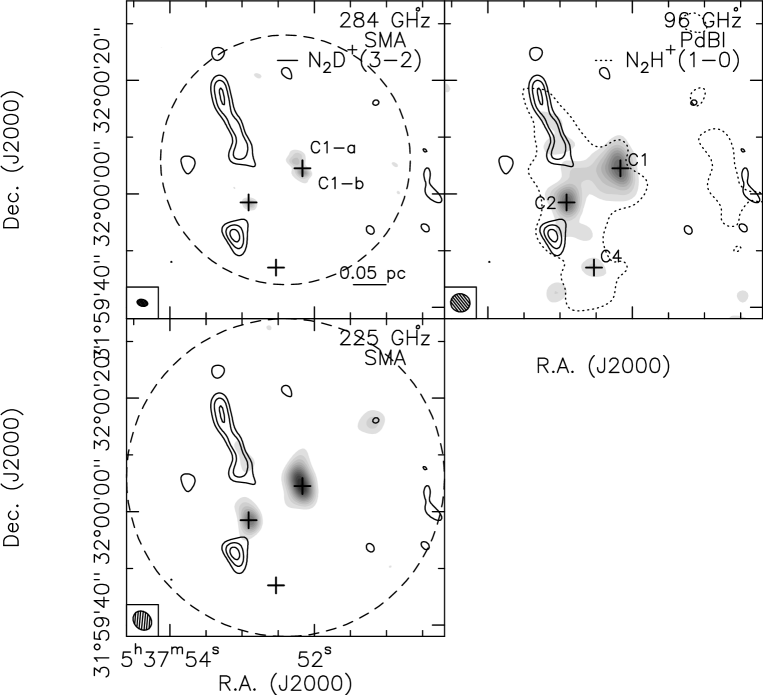
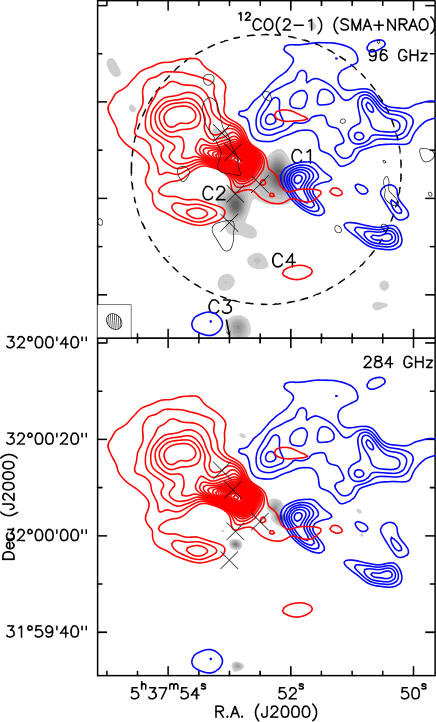
The 284 and 225 GHz continuum images obtained with the SMA are shown in top and bottom left panels of Fig. 2, respectively. For a complete comparison among the three continuum maps, in Fig. 2 we also show the continuum emission at 96 GHz, already presented in Fig. 1.
At 284 GHz, three main compact cores are detected inside the SMA primary beam (44′′), two of them close to the map centre and the other one is ′′ S–E of the map centre. We will call the central condensations C1-a and C1-b, respectively, because they are located at the position of source C1 in the 96 GHz image, while the eastern one exactly matches the emission peak of core C2. Among the other 96 GHz continuum sources shown in Fig 1, we clearly detect C3 outside the interferometer primary beam (not shown in Fig. 2), while C4 is undetected.
At 225 GHz, the continuum sources C1-a and C1-b are blended into C1 as in the 96 GHz image (Fig. 1), and C2 is clearly detected as well. As for the 284 GHz image, C4 is undetected while C3 is detected but not shown because outside the primary beam, corresponding to the interferometer field of view. There is a faint emission ′′ to the NE of C1-a and C1-b, but we decided not to consider this as a real source because it is detected at 6 in this image only, and quite close to the edge of the interferometer primary beam. In both images we also plot the 3 level of the two deuterated cores N and S shown in Fig. 1.
Because C3 and C4 are outside and on the edge of the primary beam, respectively, we decided not to discuss further these sources in the following.
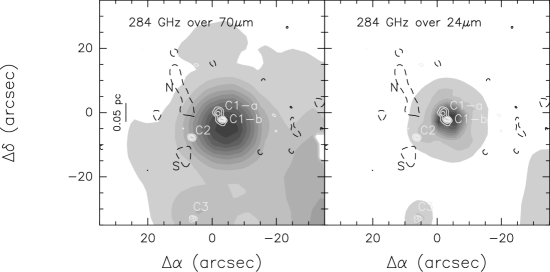
Spitzer Post-Basic Calibrated Data (PBCD) at 24 and 70 m were obtained from the Spitzer Archive. The data were taken in Photometry/Super Resolution mode as part of program 20635 (R. Klein, PI). Observations at 24 microns were obtained on 7 October 2005 (AORKEY 14944768), with an integration time of 99 s, and at 70 microns on 2 April 2006 (AORKEY 14945024) with an integration time of 76 s (using the Fine Scale mode). At present no IRAC observations have been made. The left and right panels of Fig. 3 show the Spitzer MIPS continuum images at 70 m and 24 m. In both images, two peaks roughly coincident with the submillimeter continuum sources C1 and C3 are detected. At 70 m, an extended emission is detected towards C2, S and the southern portion of N, but we believe that it is just due to the low angular resolution of the map (′′), which do not allow to disentangle the contibution of the different sources. The 24 m continuum emission shows two peaks spatially coincident to the 70m ones, but they are both more centrally peaked than at 70 m, and have smaller extension, probably due to the better angular resolution (′′ at 24 m). A faint emission is detected towards C2, at the edge of the main emission peak. No emission is detected towards N and S at this wavelength.
3.2 Molecular line emission.
In paper I we have shown and discussed the distribution of the integrated intensity of the N2D+ and N2H+ lines (see also Fig. 1). However, as said in Sect. 2.1, several transitions of other species have been observed and detected simultaneously to the N2D+ and N2H+ ones. In this Section, we complete the analysis started in paper I and show a full report of the observations obtained.
3.2.1 Integrated emission map of the optically thin component of the N2H+ (1–0) line
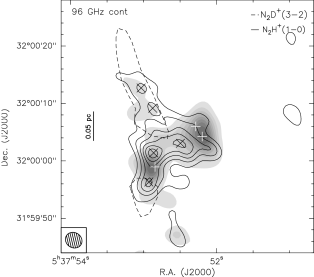
The integrated intensity of the main group of hyperfine components of the N2H+ (1–0) line has been shown in Fig. 1. As already discussed in Sect. 1, the emission is extended and presents several bumps which are not resolved into separated emission peaks. This may be the real shape of the emission in this tracer, or it can be due to other reasons, such as an insufficient angular resolution, or opacity effects. To better understand this, in Fig. 4 we show the distribution of the integrated intensity of the hyperfine component only, which is well separated from the other components and it is expected to be optically thin: from the fitting procedure described in Sect. 2.4, we obtain an optical depth for this component of . Fig. 4 shows that the extension of the integrated intensity of this component is similar to that shown in Fig. 1, but in this case we do detect five emission peaks. This suggests that, since the angular resolution is the same, the lack of well separated intensity peaks in Fig. 1 is probably due to optical depth effects.
The main emission peak is located ′′ north of C2, while the others are located about ′′ east of C1, and ′′ south of C2, respectively, and two fainter peaks (detected at ) are seen towards core N. None of the millimeter sources coincide with the five N2H+ emission peaks. These results indicate that the source can host other dense cores which are not detected in the millimeter continuum observations, probably because they are too cold.
3.2.2 Integrated emission map of the 12CO (2–1) line wings
Single-dish observations of the source in the 12CO (2–1) line have been performed by Zhang et al. (2005), with a ′′ angular resolution. They detected a massive outflow in the non-Gaussian line wings, the orientation of which is approximately in the WE direction, but the angular resolution was not sufficient to detect neither the outflow center nor the detailed morphology of the outflow itself. The observations reported in this work significantly improve the angular resolution of the previous ones, allowing us to better determine the outflow shape and identify its origin.
In Fig. 5, we show the map of the integrated intensity in the 12CO (2–1) line wings, derived from channel maps obtained combining SMA and NRAO data, as described in Sect. 2.3. The blue- and red-shifted emissions have been averaged in the velocity intervals (–46.4, –26) km s-1 and (–9.2, 6.4) km s-1, respectively. The outflow axis is predominantly oriented in the WE direction, with redshifted gas in the east and blueshifted gas in the west. The lobes are clearly separated and have approximately a biconical shape. The outflow center is near the position of the continuum source C1, and the exciting source can be either C1-a and C1-b. The source coincident with the most western peak of the N2H+ (1–0) line integrated emission can also contribute to the observed emission, but less likely than the continuum sources, due to the fact that there are no other signs of protostellar activity associated with it. The blueshifted gas shows a fainter secondary peak to the north of the map. From geometrical considerations, this northern blue-shifted emission might be driven by a source within N, rather than C1-a or C1-b. However, as we will further discuss later, the sources eventually embedded within N are probably in the pre–stellar phase, i.e. prior to the main accretion phase in which the outflow is expected to form, so that this solution seems to us very unlikely.
The outflow length, from end-to-end, is approximately 35′′ (if we do not consider the secondary peaks of the blueshifted emission), corresponding to pc at a distance of 1.8 kpc. The semi-opening angle is between about 30 and 40, and the spatial separation of the lobes suggests that the inclination angle with respect to the line of sight is likely to be very close to the plane of the sky (see also Cabrit & Bertout 2000).
In Table 2 we give the line parameters for the calculation of the outflow properties, namely: the velocity range of the blue- and red- wings, and (Cols. 1 and 2, respectively), the integrated intensity of 12CO (2–1) in the wings, (blue) and (red) (Cols. 3 and 4; is the main beam brigthness temperature), and the maximum velocity of the wings, and (Cols. 5 and 6), defined as the difference between the maximum velocity of the blue- and red- wings and the systemic velocity (i.e. km s-1). The values listed in Cols. 3 and 4 are averaged values over the blue and the red lobes, respectively.
| (blue) | (red) | ||||
| (km s-1 ) | (km s-1 ) | (K km s-1 ) | (K km s-1 ) | (km s-1 ) | (km s-1 ) |
| –46.4, –26 | –9.2, 6.4 | 1329.3 | 1663.4 | 28 | 24.8 |
3.2.3 Integrated intensity of other lines
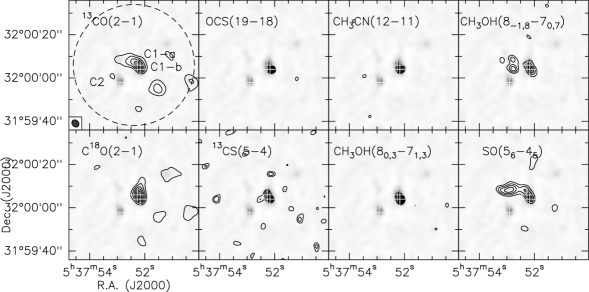
In Fig. 6 we show the distribution of the integrated intensity of all the detected transitions listed in Table 1, averaged over the channels with signal, but 12CO (2–1) that has been already discussed.
The integrated intensity of the 13CO (2–1) line peaks at the position of C1, but it shows an elongated shape towards the north-east, suggesting that some of the emission comes from the outflow. On the other hand, the C18O (2–1) line emission is less extended and it seems to arise from a common gaseous envelope in which C1-a and C1-b are embedded. No significant emission of this line is detected towards the 12CO outflow lobes. A similar distribution is seen in the integrated emission of 13CS (5–4) and, a bit less, in CH3OH (80,3–71,3), showing that these transitions trace the same gas.
The integrated intensity of the two high excitation lines OCS (19–18) and CH3CN (12–11) clearly shows the presence of a compact hot-core centered on source C1-b. In both tracers, the hot core is unresolved, so that its diameter has an upper limit of approximately 3′′, i.e. pc at the given distance. The hot-core nature of this condensation is confirmed by the gas temperature of K that we will derive in Sect. 4.1.
For the CH3OH (8-1,8–70,7) and SO (5) line, the emission looks clumpy, with a main spot corresponding to the position of C1, and another prominent spot coincident with the red-shifted 12CO emission, and several fainter spots north and west of C1 which do not coincide with none of the other tracers observed. The strong emission of SO (5) in the red lobe of the 12CO outflow is consistent with previous studies, in which it has been found that SO abundance is enhanced in outflows (Bachiller et al. 2001, Viti et al. 2003), and it has been clearly detected in other massive outflows studied at high-angular reoslution (see e.g. the case study of AFGL 5142, Zhang et al. 2007).
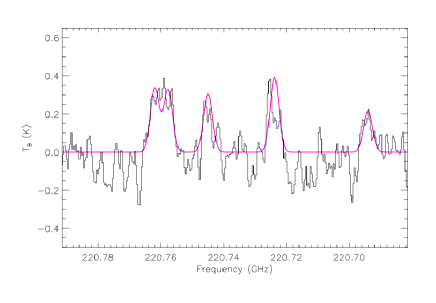
On the other hand, the CH3OH (8-1,8–70,7) line is believed to be a Class I methanol maser line, and it has been detected at low-angular resolution in several high-mass star forming regions (see e.g. Slysh et al. 2002). Recently, the SMA has imaged several masers in this line towards the source DR21(OH) (Bourke, priv. comm.). Class I methanol masers are often located offset from the position of hot cores or HII regions, where Class II and other masers, such as those of water and OH, are found. They are believed to be collisionally excited, probably where a powerful outflow impacts the surrounding quiescent material (see e.g. Sandell et al. 2003). However, high-angular resolution observations have shown that in some cases they can be found in close proximity of HII regions and water masers (Kurtz et al. 2004). The map shown in Fig. 6 clearly show that the (8-1,8–70,7) line comes from both the hot core and the red lobe of the outflow, indicating that it is originated by shocked gas, and the spatial extent is similar to that of SO, even though the SO emission is more prominent in the outflow than that of CH3OH. To better understand the nature of the CH3OH (8-1,8–70,7) line, in Fig. 7 we show the spectra of this line towards two positions at an offset of (–3′′, –2′′) and (+5′′, –1.5′′) from the map centre. These two positions correspond to the main emission peaks of the averaged map, and roughly coincide with C1 and with the inner part of the red lobe of the 12CO outflow, respectively (see Fig. 6). We clearly see that the line in the outflow is much narrower than the one observed towards core C1 ( km s-1 and km s-1, respectively). The broad line seen towards C1 is likely thermal, while the narrow one observed towards the red lobe of the 12CO outflow could come from a single maser spot, even though the flux density is not very high ( Jy) and could also be thermal as well.

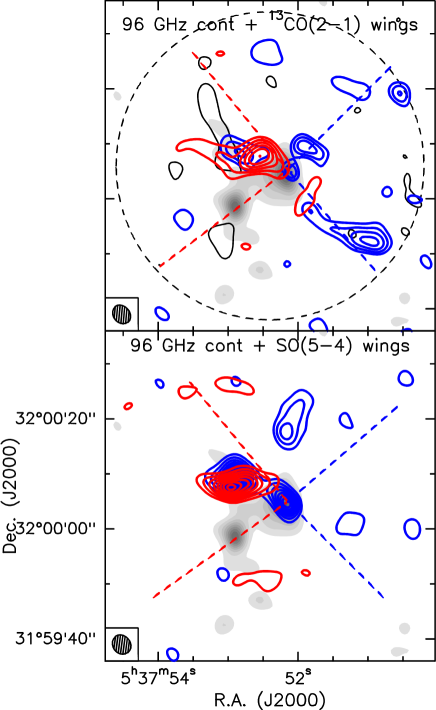
Finally, to better highlight the emission of 13CO and SO in the outflow, in Fig. 8 we show the integrated intensity maps of the blue- and red-shifted emission of the 13CO (2–1) and SO (5) lines. The blue-shifted emission of 13CO seems to trace the cavity created by the blue lobe of the 12CO outflow, while the red-shifted emission follows the inner part of the 12CO red lobe (see upper panel of Fig. 8). For SO (5), we find a similar result for the red-shifted emission, while the blue-shifted emission of this line does not follow that of 12CO, but it arises mostly from core C1 and from the 12CO red lobe. This strange feature could be explained by the presence of another outflow not detected in 12CO, centered roughly in between core N and core C1. A northern bump in the blue-shifted emission is also detected, located at the position of the northern blue-shifted emission seen in Fig. 5.
4 Derivation of the physical parameters
4.1 Temperature of core C1-b from CH3CN
Figure 9 shows the CH3CN (12–11) spectrum at the peak position of the emission map shown in Fig. 6. CH3CN is a symmetric-top molecule whose rotational levels are described by two quantum numbers: J, associated with the total angular momentum, and K, its projection on the symmetry axis. Such a structure entails that for each radiative transition, , lines with can be seen (for a detailed description see Townes & Schawlow 1975). In our observations the bandwidth covers up to the component for the (12–11) transition. However, we detected only lines up to K=4, for which the energy of the upper level is 184 K. In order to compute the line parameters, we have performed Gaussian fits to the observed spectrum assuming that all the K components arise from the same gas. Hence, they have the same LSR velocity and line width. We fixed the line separation in the spectrum to the laboratory value and derive a line width by fitting the spectrum of all the K components. Then, under the assumption of LTE conditions, we compute the CH3CN spectrum using the gas temperature, the CH3CN density, the source size as input parameters, and a line width fixed to the observed value (Qiu 2009, private communication). This approach does not assume optically thin emission in CH3CN, as does in the Boltzmann analysis (see e.g. Kuiper et al. 1984; Bergin et al. 1994). The best fit to the CH3CN spectrum shown in Fig. 9 yields a range of kinetic temperatures from 150 - 250 K. These values are comparable to typical temperatures found in hot molecular cores surrounding a newly formed massive star (see e.g. Kurtz et al. 2000).
4.2 Physical parameters from dust emission
| GHz | ||||||||
| Source | Peak position | Diameter | ||||||
| R.A.(J2000) | Dec.(J2000) | |||||||
| 05h37m | (′′) | (pc) | (mJy) | (M⊙) | ( cm-3) | ( cm-2) | ||
| C1∗ | 52s.17 | +3200′ 04.′′5 | 9.08 | 0.08 | 11 | 27 | 2.1 | 5.2 |
| C2 | 52s.91 | +3159′ 58.′′5 | 6.35 | 0.06 | 6 | 15 | 2.8 | 5.2 |
| GHz | ||||||||
| Source | Peak position | Diameter | ||||||
| R.A.(J2000) | Dec.(J2000) | |||||||
| 05h37m | (′′) | (pc) | (mJy) | (M⊙) | ( cm-3) | ( cm-2) | ||
| C1∗ | 52s.19 | +3200′ 05 | 7.3 | 0.06 | 150 | 12 | 1.4 | 3.0 |
| C2 | 52s.90 | +3159′ 58.′′5 | 5.3 | 0.05 | 60 | 4.7 | 1.2 | 2.0 |
| GHz | ||||||||
| Source | Peak position | Diameter | ||||||
| R.A.(J2000) | Dec.(J2000) | |||||||
| 05h37m | (′′) | (pc) | (mJy) | (M⊙) | ( cm-3) | ( cm-2) | ||
| C1-b | 52s.17 | +3200′ 04 | 1.8 | 0.016 | 160 | 5.2; 0.6† | 8.5; 1.0 † | 7.6; 0.9† |
| C1-a | 52s.27 | +3200′ 06 | 2.1 | 0.018 | 115 | 3.6 | 6.6 | 5.7 |
| C2 | 52s.90 | +3159′ 58 | 1.5 | 0.013 | 90 | 2.9 | 10.9 | 7.4 |
∗ = C1-a + C1-b
† = computed from the CH3CN temperature of 200 K
The physical parameters derived from the millimeter continuum images presented in Sect. 3.1 are listed in Table 3: the position of the emission peak, in R.A. (J2000) and Dec. (J2000), of C1 (resolved into C1-a and C1-b at 284 GHz) and C2 are listed in Cols. 2 and 3, respectively; the deconvolved angular () and linear () diameters are given in Cols. 4 and 5. Assuming that the emission has a Gaussian profile, we have derived the angular diameter of the sources deconvolving the observed FWHM with a Gaussian corresponding to the synthesised beam of the interferometer. The observed FWHM has been measured as the geometrical mean of major and minor axes of the contour at half of the intensity peak. The linear diameters have been computed using a source distance of 1.8 kpc (Zhang et al. 2005).
In Cols. 6 of Table 3 we also give the flux density, , derived integrating over the 3 level in each core. Col. 7 shows the gas masses obtained from : assuming constant gas-to-dust ratio, optically thin and isothermal conditions, the total gas+dust mass is given by:
| (1) |
In Eq. (1), is the distance, is the dust opacity coefficient, derived according to (where GHz and cm2 g-1, which implies a gas-to-dust ratio of 100, Kramer et al. 1998), and is the Planck function calculated at the dust temperature . For this latter, since we do not have a direct estimate (except for C1-b), we have assumed a ’reasonable’ value of 30 K (see e.g. Molinari et al. 2000). For C1-b, for which we also have a direct temperature measurement from CH3CN (see Sect. 4.1), we give two estimates: one assuming K and the other assuming the value derived from the CH3CN spectrum, i.e. K. For the dust grain emissivity index, we assumed (see e.g. Hill et al. 2006). From the 3 level in the continuum images, we have also derived that we are sensitive to point-like sources with masses of 0.6, 0.2 and 0.01M⊙ at 284, 225 and 96 GHz, respectively (assuming K). We also estimate a column density sensitivity of , and cm-2 at the three frequencies mentioned above.
In Cols. 8 and 9 of Table 3, we also list the average H2 volume and column densities. The H2 average volume densities have been computed assuming spherical cores, then the column densities have been derived by multiplying the volume densities for the core diameters. We have used as angular diameters those obtained deconvolving the 3 levels in the continuum images, and not those listed in Table 3 because the continuum fluxes have been derived integrating the emission within the 3 contours. All volume densities are of the order of cm-3, while the column densities are of the order of cm-2, which are typical values found in cores associated with intermediate-/high-mass forming stars, and are higher than the critical value of 1 gr cm-2 required to form a massive star at core centre (Krumholz et al. 2008), assuming that the gas is totally made of H2.
The mass of C2, estimated to be 11.8, 4.7 and M⊙ at 96, 225 and 284 GHz, indicates that the core probably hosts an intermediate-mass object. The mass of C1 is 27 and 11.8 M⊙ from the 96 and 225 GHz continuum emission, and when it is resolved in two components, C1-a and C1-b, in the 284 GHz image, the masses of the components are 3.8 and 5.2 M⊙, respectively. These values are typical of cores associated with intermediate-mass protostellar objects (see e.g. Beltràn et al. 2008). For C1-b, adopting the temperature of 200 K from CH3CN, we even obtain 0.6 M⊙. However, as we will discuss better in Sect. 5.1, the source embedded in core C1-b is likely an early-B newly formed star. Therefore, the gas mass derived from the millimeter continuum represents for this source the mass of the circumstellar material only, and not that of the central star.
Additionally, for all sources these mass estimates, especially those derived from the 284 GHz continuum, are very uncertain because affected by several problems. First, both the dust temperature and assumed are very uncertain: is expected to be between 1 and 2 in high-mass star forming regions (see e.g. Hill et al. 2006 and references therein), while the dust temperature can vary considerably from a source to another (see e.g. Molinari et al. 2000; Sridharan et al. 2002). For example, assuming the gas temperature derived from NH3 observations, that is K (Jijina et al. 1999), with we get 7.9 and 10.9 M⊙ for C1-a and C1-b, respectively, and 8.8 and 12.2 assuming K and (Mathis & Wiffen 1989). Second, the 284 GHz image is more affected than the others by the problem of the missing flux, so that the core masses derived from this image are representative of the circumstellar material very close to the central object only, while those from the 225 and 96 GHz continuum are more representative of the whole envelope. To estimate the amount of flux filtered out beacuse of missing short spacing information, we have compared the flux measured with the single-dish SCUBA map at 850 m (Fontani et al. 2006) to that measured in the 284 GHz map: the peak flux of the single-dish map is Jy beam-1. Assuming a spectral index of 4, the peak intensity at 1 mm (i.e. 284 GHz) is 1.04 Jy beam-1. After smoothing the interferometric map at the SCUBA angular resolution of ′′, the flux density in the area corresponding to the SCUBA beam is 0.11 Jy beam-1, which means that we are recovering only of the total flux. Therefore, the masses derived from the 284 GHz continuum maps have to be considered as lower limits for the circumstellar masses. On the other hand, at 96 GHz, the expected flux is 0.011 Jy beam-1 while the value measured from the PdBI map is 0.0075 Jy beam-1, so that at this frequency we are recovering 68 of the total flux.
4.3 Physical parameters from N2H+ and N2D+.
4.3.1 Deuterium fractionation.
For completeness, in Table 4, we give the N2H+ and N2D+ total column densities, (N2H+) and (N2D+), and the Deuterium fractionation, , that we have derived in paper I. (N2H+), (N2D+) and = (N2D+)/(N2H+), derived for N and S, are listed in Cols. 2, 3 and 4, respectively, of the same Table. For more details on the methods used as well as in the assumptions made, see Sect. 3.1 of paper I. As already discussed, in both condensations, is , which is comparable to the values of found in low-mass pre–stellar cores by Crapsi et al. (2005), following the same method. These values are also comparable to those derived by Pillai et al. (2007) in infrared-dark clouds from deuterated ammonia. However, their observations are related to the very cold, pc-scale molecular envelope, and not to compact sub-pc scale cores.
| source | |||||
|---|---|---|---|---|---|
| (cm-2) | (cm-2) | (pc) | () | ||
| N | 1.9(0.6) | 2.1(0.3) | 0.11(0.04) | 0.09 | 8.7 |
| S | 1.5(0.5) | 1.6(0.3) | 0.11(0.04) | 0.05 | 2.5 |
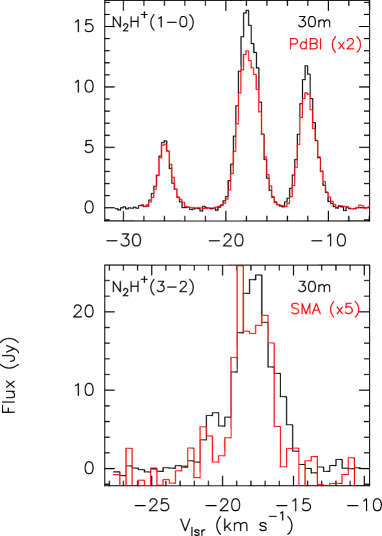
We could not derive the column densities of N and S from the N2H+ (3–2) line because this is undetected towards the two molecular condensations, as shown in Fig. 1 of paper I. Such a different distribution of the integrated intensity with respect to that of the N2H+ (1–0) line is probably due to the extended emission being filtered out differently by the two interferometers. To compute the amount of the missing flux, we have compared our interferometric spectra with the single-dish spectra obtained with the IRAM-30m telescope (see Fontani et al. 2006). We have resampled the single-dish spectra of N2H+ (1–0) and (3–2) to the same resolution in velocity as the interferometric spectra. The superposition of the spectra is shown in Fig. 10: In the N2H+ (1–0) line, the flux measured by the PdBI is times less than that measured with the IRAM-30m telescope, while in the N2H+ (3–2) line the flux measured with the SMA is only one fifth of that measured with the 30m antenna. This indicates that the extended emission is much more resolved in the SMA map of the (3–2) line than in the PdBI map of the (1–0) line.
4.3.2 Velocity field.
From the molecular lines observed one can derive information about the velocity field in the source. In particular, the peak velocity, , of the lines gives information on ordered motions of the gas (rotation, inward or outward motions), while the line widths, provide information on the gas turbulent motions. In this section, we show the results obtained from the N2H+ (1–0) line, for which the spectra are not affected by central dips as those of 12CO and its isotopologues. Also, this tracer is fairly well detected towards both the continuum cores and the deuterated ones, so that it allows us to investigate both ordered and turbulent motions across the whole source.
To derive and , we have adopted the following procedure: from the channel maps of the N2H+ (1–0) line, we have extracted a spectrum from each pixel inside the 3 level of the integrated emission (pixel size ′′′′), and then fitted these spectra as described in Sect. 2.4.
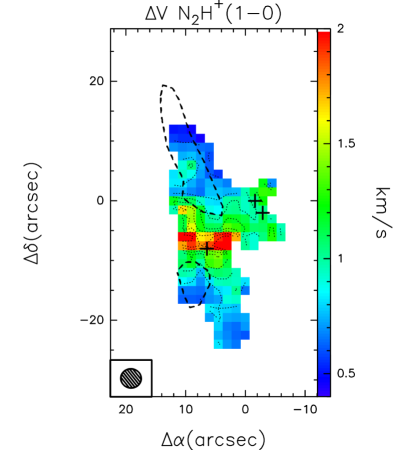
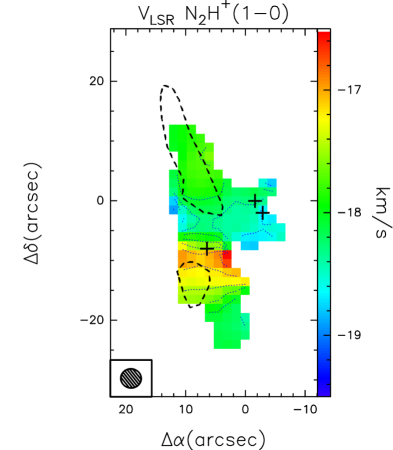
In Fig 11 we show the maps of (left panel), and (right panel) of the N2H+ (1–0) line. From the left panel, one can see that the line widths are clearly broader than km s-1 in the region where the continuum cores C1 and C2 and the N2H+ (1–0) main peaks are located. On the other hand, the gas is more quiescent around this central region, and towards the position of N and S ( between and 1 km s-1). These results indicate that in the continuum cores, as well as in the N2H+ main peaks, the star formation process is actively taking place, while in the deuterated cores the gas is more quiescent because they are still in the pre–stellar phase. Interestingly, the plot in the right panel of Fig. 11 indicates that in the region where the turbulence is higher the gas is also red-shifted with respect to the systemic velocity, while no clear trend is seen in the other portions of the source, in which the gas velocity is quite close to the systemic one. This is probably caused by the interaction with the red lobe of the 12CO outflow, which is expanding in that portion of the cluster.
In Sect. 5.2, we will discuss in some more details this interaction, and how and vary in the deuterated cores N and S, by using also the N2D+ (3–2) line.
4.4 Outflow parameters from 12CO line wings
| 12CO (2–1) | |||
| parameter | no corr. | ||
| (cm-2) | 7.7 | ||
| (cm-2) | 9.7 | ||
| () | 10.7 | ||
| () | 10.7 | ||
| () | 21.4 | ||
| (M⊙ km s-1) | 565 | 1038 | 3256 |
| ( ergs) | 3 | 10.1 | 99 |
| ( yr) | 11.8 | 7.65 | 2.08 |
| ( yr-1) | 1.9 | 2.8 | 10 |
| (km s-1 yr-1) | 5 | 14 | 157 |
| () | 210 | 1089 | 39470 |
In Table 5, the characteristics of the flow are given. Col. 1 lists the computed parameters which are: the H2 column density of the blue- and red-lobe, and ; the mass of the blue- and red-lobe, and , and the total mass, ; the momentum, ; the energy, ; the dynamical timescale, ; the mass entrainment rate, ; the mechanical force, ; the mechanical luminosity, .
The H2 column densities in both the blue and red lobe, and , have been derived from the 12CO (2–1) line integrated emission in the wings according to the standard relations (see e.g. Rohlfs & Wilson 2004):
| (2) |
| (3) |
In Eq. (2), is the inverse relative abundance of CO (assumed to be 104, Frerking et al. 1982), , and are the column density, the statistical weight and the energy (in K) of the upper level (i.e. ), respectively, is the partition function and the excitation temperature. For this latter, we have assumed the dust temperature, i.e. 30 K, assuming coupling between gas and dust. In Eq. (3), is the Boltzmann constant, the dipole moment (0.11 Debye for CO), the line rest frequency, the optical depth and is the integrated intensity in the line wings. The values listed in Table 5 have been derived assuming optically thin emission, i.e. . By comparing the 12CO and 13CO emission in the wings, we have found that this assumption is correct for our data.
All the other parameters given in Table 5 have been derived according to Eqs. (2) - (8) of Leurini et al. (2006), which take into account for correction for the flow inclination angle, , with respect to the line-of-sight. The parameters are given for no correction for the inclination angle, for (the mean inclination angle given by Cabrit & Bertout 2000), and for an extreme value of . Since the outflow orientation looks close to the plane of the sky, we will consider the values computed for and as lower and upper limits, respectively. In this range, the flow parameters (outflow mass, momentum, energy, mechanical force and mechanical luminosity) are consistent with the results obtained for outflows associated with high-mass YSOs observed at high-angular resolution (e.g. Beuther et al. 2004, 2006).
We will better discuss the nature of the exciting source of the CO outflow in Sect. 5.1.
5 Discussion
5.1 Nature of the continuum sources
The maps shown in Sect. 3.1 and the parameters derived in Sect. 4.2 allow us to discuss the nature of the millimeter continuum cores C1-b, C1-a and C2.
C1-b probably hosts a very young early-B ZAMS star. This is indicated by several pieces of evidence: First, Molinari et al. (2002) have detected towards I05345 a cm-continuum source whose position roughly corresponds to that of C1-b, and the Lyman continuum derived from their observations suggests that the embedded object is a newly formed B2–B3 ZAMS star. Second, the source is embedded in a hot-core, as demonstrated by the kinetic temperature derived from CH3CN (12–11) in Sect. 4.1, and by the presence of other high-excitation lines (see Fig. 6), and it lies where the main peak of the mid-infrared 24 m continuum emission is detected (see Fig. 3). Third, it is close to the center of the outflow lobes detected in 12CO (2–1) (Fig. 5), even though a significant contribution to the observed blue- and red-shifted emission can arise from C1-a and, less likely, from another source not seen in the continuum image, located at the position of the western emission peak of N2H+ (see Fig. 5). As discussed in Sect. 4.2, even though the masses derived form the millimeter continuum are just 5.2 and 0.6 M⊙, these measurements represent the mass of the circumstellar gas only, and thus they do not contrast with the previous findings.
The source embedded in C1-a is probably a very young intermediate-mass protostar. This is indicated by: the core location, at the centre of the 12CO outflow lobes, which suggests that the object embedded in the core is one of the main sources driving the powerful outflow; the core gas mass listed in Table 3; the non-detection of the core in the centimeter continuum (Molinari et al. 2002), indicating an evolutionary stage prior to the formation of an HII region. Based on these findings, we believe that the source embedded in C1-a is an intermediate-mass protostar still in the main accretion phase (i.e. a Class 0 object).
The nature of the source embedded in C2 is unclear. The core mass (see Table 3) and the non-detection in the 24 m image suggest that it can be an intermediate-mass embedded protostar. The source is not associated with a detectable outflow, which however could be an indication that the embedded source is extremely young. Interestingly, one can notice from Fig. 4 that C2 is in the middle of a filamentary structure extended in the N-S direction which also contains the deuterated cores N and S, and four of the five peaks of the N2H+ (1–0) integrated emission. This may indicate that this portion of the source host the youngest low- and intermediate-mass objects of the proto-cluster, and it is consistent with theoretical models that predict that filamentary structures are common morphologies of molecular clouds in several classes of dynamical formation models (e.g. van Loo 2007).
5.1.1 A proto-Trapezium system?
From the positions given in Table 3, we derive that the projected linear separation among the three continuum sources goes from pc between C1-a and C1-b, to pc between C1-a and C2, i.e. from to 14000 A.U., at the given distance. Looking at the 284 and 225 GHz images in Fig. 2, one could also argue the possible presence of a fourth continuum unresolved source to the NW of C1-a. This is suggested by the elongated shape of C1-a in this direction, while the synthesised beam of the SMA at 284 GHz is elongated in NE - SW direction. Assuming spherical symmetry, the stellar density in this region is thus proto-stars pc-3, while it is proto-stars pc-3 assuming the three resolved sources only. These values are consistent with the stellar density measured in the Trapezium cluster in Orion, estimated to be of the order of 104 stars pc-3, and derived assuming the lower-mass stars in the cluster as well. This suggests that the stellar density of proto-stars pc-3 is a lower limit, and that perhaps the three young intermediate-/high-mass (proto-)stars embedded into C1-a, C1-b and C2 (plus possibly the unresolved one to the NW of C1-a) represents a Trapezium-like system in the making.
Similar multiple systems of forming intermediate-/high-mass stars have been discovered recently through high-angular resolution observations (see e.g. Beuther et al. 2007b; Rodon et al. 2008), although these systems are denser than the one in I05345 (more than stars pc-3). Neverthless, these stellar densities are much lower than the value of stars pc-3 needed for the formation of high-mass stars through merging of several lower-mass stars at the center of rich clusters (see e.g. Bonnell et al. 1998), but comparable to the value sufficient to produce binary induced mergers (Bonnell & Bate 2005).
5.2 Nature of the deuterated cores
In paper I, we discussed the nature of the deuterated cores based on the dust continuum emission and the deuterium fractionation derived from the column density ratio (N2D+)/(N2H+). We derived the mass of the cores following two approaches: from the virial theorem, and assuming an average abundance of N2H+. For completeness, in Col. 6 of Table 4 we list the main results obtained from the second approach in paper I. These values, together with a (Col. 4 of Table 4), suggested that both cores are in the pre–stellar phase but at present they are not massive. On the other hand, as discussed in Sect. 3.3 of paper I, the average spectra of the N2H+ (1–0) and N2D+ (3–2) lines in both N and S show lines broader than those typically observed in low-mass pre–stellar cores.
We proposed two possible scenarios for the nature of the two N2D+ condensations: (i) they are quiescent low-mass starless cores, and therefore they are going to form low-mass stars (in particular, N is likely to harbor several unresolved cores); (ii) they are condensations still in dynamic evolution, which can be changing their mass and shape, undergoing either fragmentation or accretion from the parental cloud. In particular, the second scenario is suggested by the predictions of the ’competitive accretion models’, which predict formation of massive stars in a clustered environment through dynamical interaction among several ’seeds’ of forming (proto-)stars (see e.g. Zinnecker & Yorke 2007 for a review).
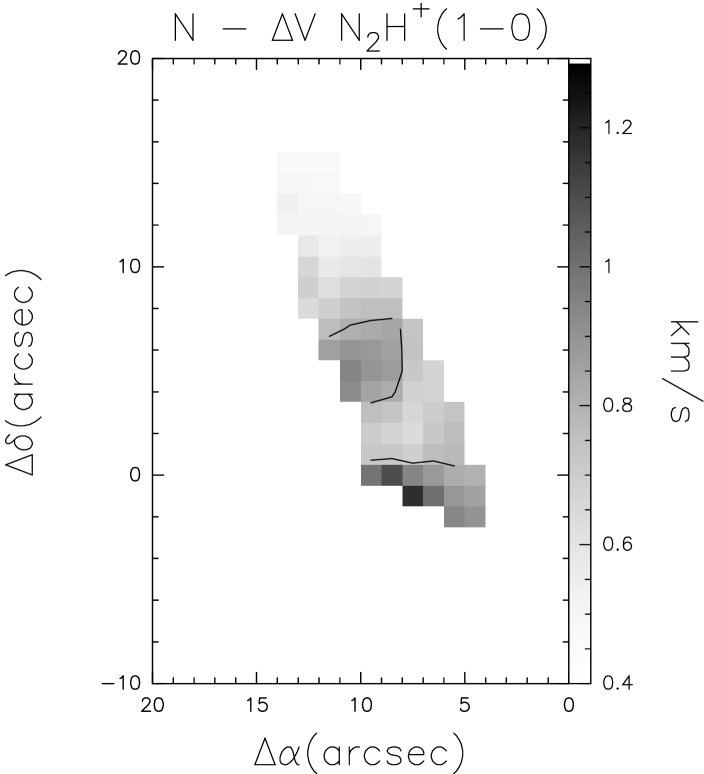
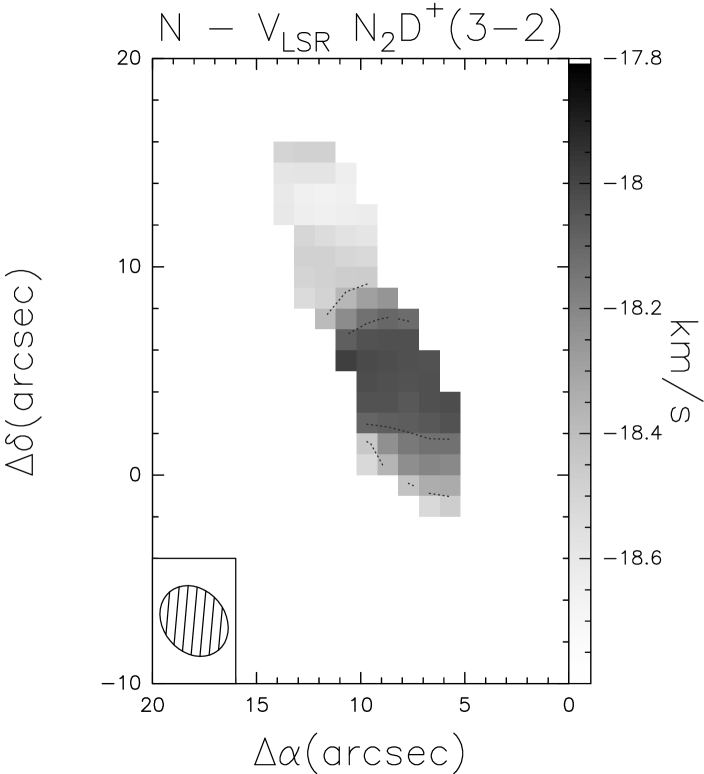
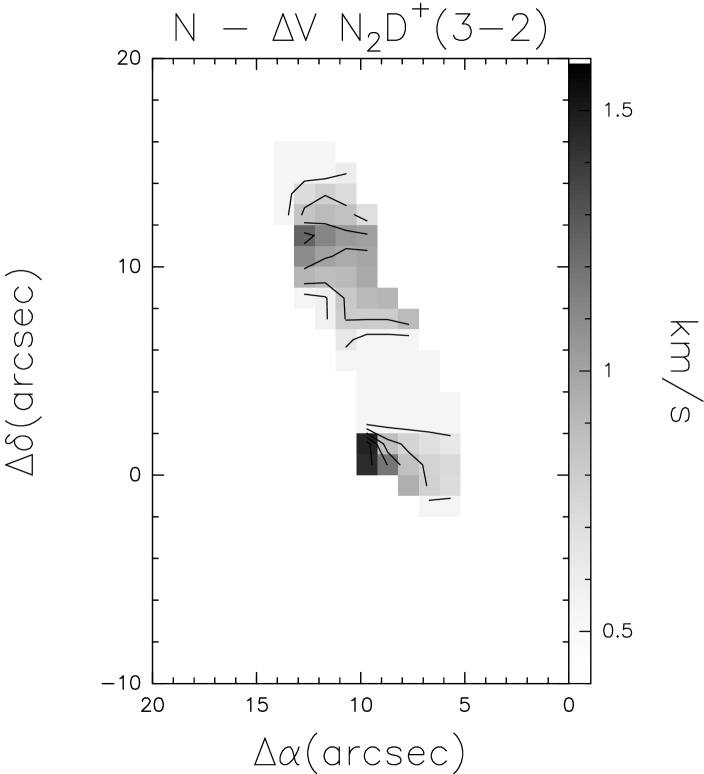
To better understand the nature of the two condensations, a detailed analysis of the gas kinematics is certainly very helpful. For this reason, here we investigate in more detail the gas kinematics in N and S by using as diagnostics the peak velocity and widths of the N2H+ (1–0) and N2D+ (3–2) lines, following the same approach described in Sect. 4.3.2.
5.2.1 Condensation N
In the two left panels of Fig. 12 we show the maps of and , respectively, obtained for N from the N2H+ (1–0) line. The same plots derived from N2D+ (3–2) are shown in the two right panels. One can see in the first place that the velocity field in this core is quite complex. The line width of the N2H+ (1–0) line are slighly larger in the southern region of the core, while that of the N2D+ (3–2) looks larger in the northern and, less prominently, in the south-eastern portion of the core. For both species, the values range from to km s-1, and are on average 3–4 times larger than those found in low-mass pre–stellar cores (see e.g. Caselli et al. 2002a for the case of L1544, Crapsi et al. 2005). However, for the N2D+ (3–2) line, in the positions where km s-1, these values can be influenced by the poor spectral resolution of km s-1 (see Table 1). Therefore, it is possible that linewidths smaller than 0.5 km s-1 are present but not observable with the adopted spectral resolution. The peak velocity of both N2H+ and N2D+ lines are between and km s-1, i.e. close to the systemic velocity, but the gas in the southern region of the core looks slightly red-shifted with respect to the northern one. Also, from Fig. 5 one can notice that the red lobe of the 12CO outflow, likely driven by C1-b, arises from a region spatially coincident with the southern portion of core N, and possibly interacts with it: the gas in the red-shifted lobe of the outflow probably flows behind the core, dragging on part of the southern gas of N. In this way, one can explain the observed red-shift of the N2H+ and N2D+ lines in the southern portion of N. This could also be interpreted as being due to the presence of unserolved low-mass cores at a different velocity, and the N2H+ emission peaks shown in Fig. 4 is consistent with this interpretation. In this case, the observed broad lines are just due to the superposition of the different cores. However, this seems very unlikely since the red-shifted gas in the southern portion of the core is spatially coincident with the bulk of the red lobe of the 12CO outflow. So that we believe that the observed red-shifted emission and broad lines in the southern portion of N are both due to the interaction with the ouflow.
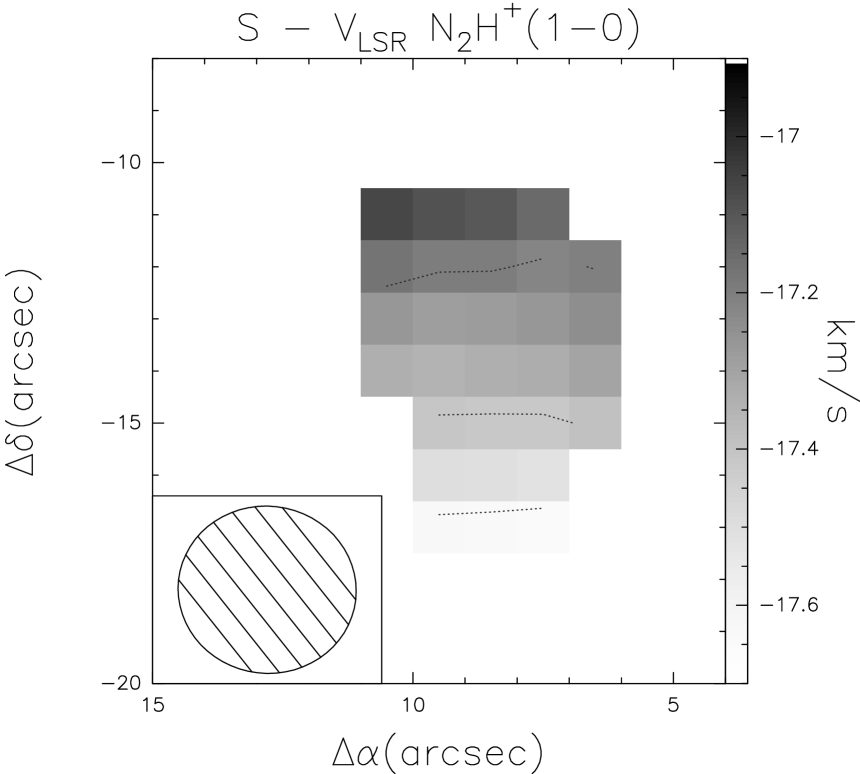
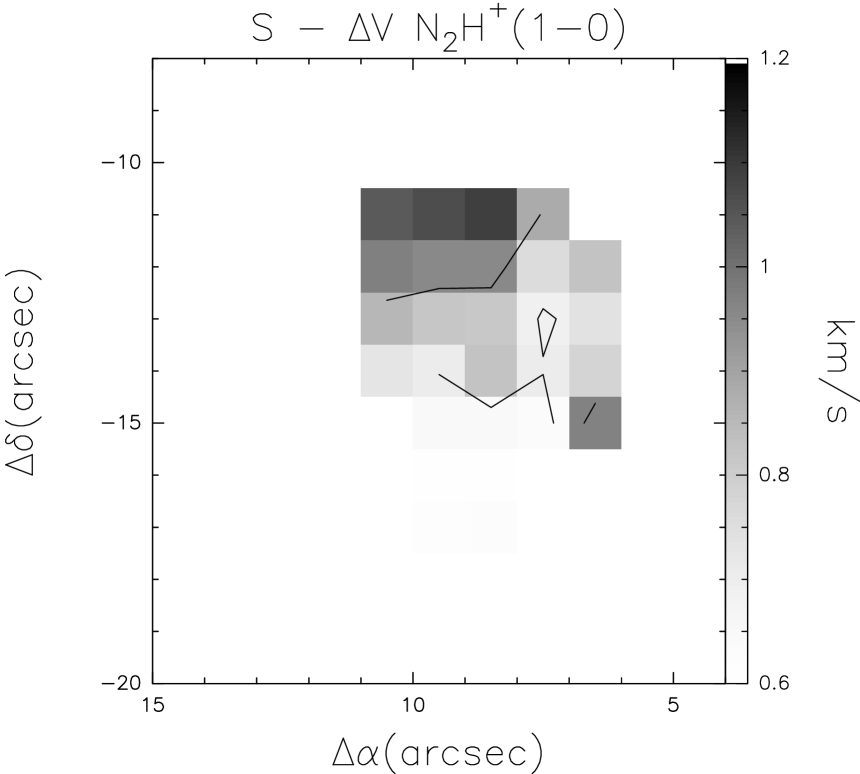
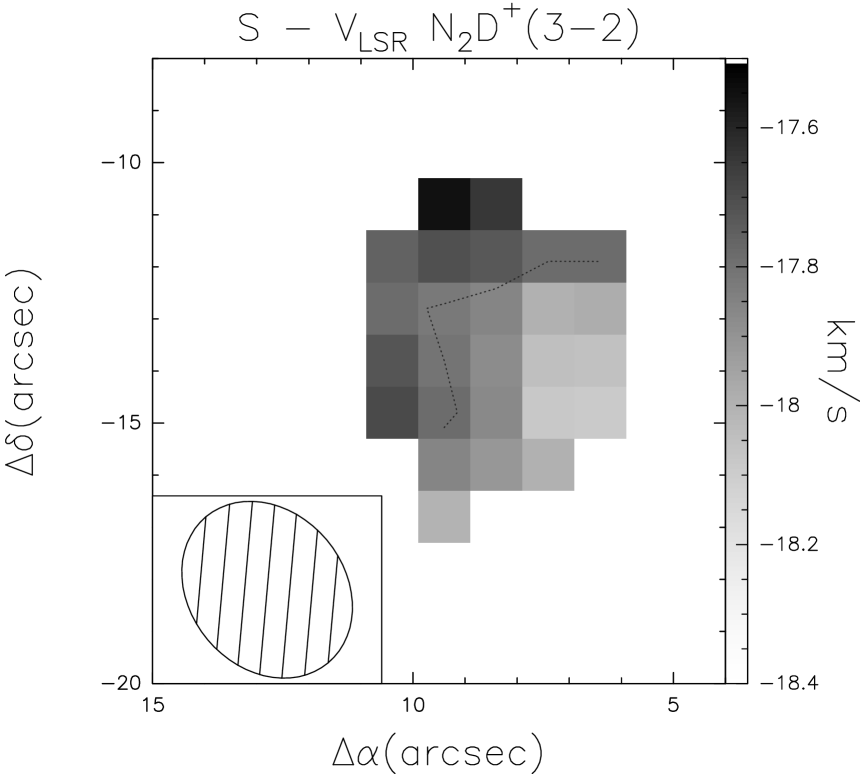
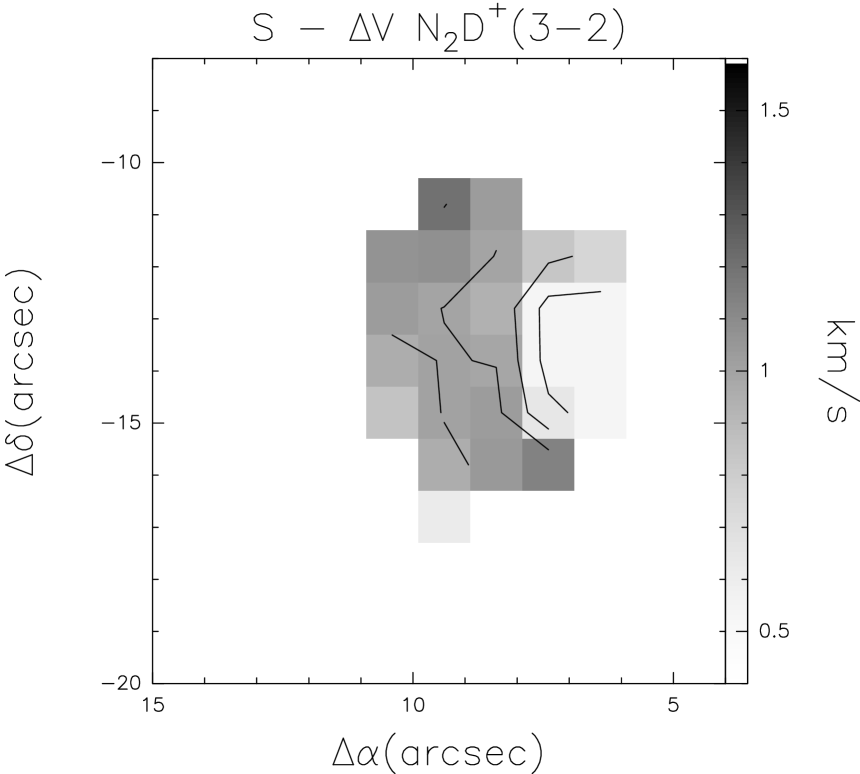
5.2.2 Condensation S
In Fig. 13 we show the same maps as in Fig. 12 for core S. The peak velocity of both the N2H+ (1–0) and N2D+ (3–2) lines look red-shifted towards the north of the core (which appears to be more shifted to the north-east in N2D+), suggestive of a rotation motion. A disk-like structure has been observed in the low-mass pre–stellar core L1544, and it is expected to be caused by the ambipolar diffusion mechanism (Ciolek & Basu 2000; Caselli et al. 2002a). However, L1544 looks also flatter than what is seen in core S, which shows a spherical shape. This can be due to different orientation with respect to the line of sight and to the worse angular resolution of our data, since Caselli et al. (2002a) obtained observations with linear resolution a factor of better than ours. Interestingly, of both N2H+ and N2D+ are larger towards the north-eastern part of the core, so that the red-shifted gas appears to be also more turbulent. As for N, this is suggestive of an interaction of the core with the red lobe of the 12CO outflow, the southern edge of which touches the upper side of core S (see the upper panel of Fig. 5).
In summary, the shape and the mass of this core indicate that it is a low-mass pre–stellar core, but the high turbulence and the red-shifted gas revealed in the northern part of the core (probably triggered by the neighbouring 12CO outflow) can influence the evolution of the core itself.
5.2.3 General conclusion on the nature of N and S
The main finding of the analysis performed above is that both cores are characterised by a probable interaction with the red lobe of the 12CO outflow. This can trigger turbulence in the cores themselves and can influence their evolution. In theoretical models of clustered star formation, turbulence (which in this case is generated by already formed protostars) can create density modifications across the cloud, originating several dense and cold ’seeds’, which subsequently can accrete backgound gas that was initially not associated with the ’accretion domain’ of the seed itself (see e.g. Bonnell et al. 2004, and McKee & Tan 2003). In this scenario, the two condensations can become more massive and form pre–stellar cores of higher mass. Alternatively, the interaction with the other cluster members, in particular with the powerful 12CO outflow, could also cause the fragmentation of the condensations.
5.3 Comparison with other star forming regions
5.3.1 Intermediate-/high-mass
The analysis made in Sects. 5.2 and 5.1 indicates that in I05345 there are objects with masses between and M⊙, and in different evolutionary stages: pre–stellar core candidates, intermediate-mass class 0 protostars, and a newly formed early-B ZAMS star. In recent years, many star forming regions harboring intermediate- and high-mass young stellar objecs have been investigated at high-angular resolution, and several of these regions show a complex structure as seen in I05345. However, only in very few of them, evidence of the presence of pre–stellar core candidates has been found.
Among the studies performed so far, I05345 appears to have the strongest similarities with the high-mass protocluster associated with IRAS 20343+4129. Palau et al. (2007) have observed this cluster with the SMA in the sub-mm continuum and in 12CO (2–1). Since the synthesised beam and the source distance are ′′ and 1.4 kpc, respectively, their observations have linear resolution comparable to our ones. They have found two intermediate- to high-mass young stellar objects, one of which is driving a molecular outflow, and the other one is driving an expanding cavity. Interestingly, the gas at the edge of the cavity seems to be compressed into several dense cores, detected in the millimeter continuum only. Palau et al. (2007) propose that these are potential starless cores representing a future generation of stars. In this scenario, the formation of new stars in the cluster is caused by the interaction between the highest mass objects (which are expected to form first at cluster center), and the residual circumstellar (circum-cluster) material as in I05345.
Leurini et al. (2007) have investigated at high-angular resolution the high-mass star forming region IRAS 05358+3543, and found 4 massive millimeter cores. One of these seems to be in the pre–stellar phase, being very cold ( K) and with a large reservoir of material ( M⊙). However, the core does not show any interaction with the other cluster members, and the authors suggest that it could be also a very embedded massive protostar.
5.3.2 Low-mass
Several well-studied low-mass star forming regions show filamentary structures similar to that seen in I05345, and clustered star formation.
In the -Ophiuchi molecular cloud complex, the large majority of low-mass millimeter cores associated with both pre– and proto–stellar objects are found to be distributed into filaments (see e.g. Nutter et al. 2006, André et al. 2007). In particular, the structure of one of these filaments, Oph A, closely resembles that of core N. André et al. (2007) have used N2H+ (1–0) to perform a detailed study of the kinematics in Oph A, and their results are different from ours: first, they derive an average line width (thermal + non-thermal component) of km s-1, which is yet more than 2 times smaller than that measured in our deuterated cores, even though in the N2D+ lines we are limited by a spectral resolution of 0.5 km s-1, and we are at the limit of our resolution towards some parts of the deuterated cores . Second, they do not find any evidence of interactions between the different cores, so that there is not feedback from protostellar activity. Similar morphologies have been obtained observing N2H+ (1–0) towards the Perseus molecular cloud by Kirk et al. (2007), in which there seem to be a minimal contribution of turbulence in the observed line widths.
These results clearly indicate that pre–stellar cores in low-mass star forming regions are commonly found in filaments similarly to what we have found in I05345, but they are much less turbulent and less interacting with the other cluster members than those studied in this work. Therefore, as suggested in Sect. 5.2, in the condensations associated with I05345 the nearby intermediate- and high-mass young objects likely play an important role in triggering turbulence and, eventually, in causing either the growth or the dispersion of the gas in these cores.
6 Summary and conclusions
We have presented a full report of the observations partially analysed by Fontani et al. (2008 - paper I) towards the intermediate-/high-mass star forming region IRAS 05345+3157. The observations have been performed with the PdBI and SMA in the following molecular transitions: N2H+ (1–0) with PdBI, N2H+ (3–2) and N2D+ (3–2), both with the SMA. At the frequencies of these lines, we have simultaneously observed the continuum emission, as well as other rotational transitions as 12CO (2–1), 13CO (2–1), C18O (2–1) and few other high excitation lines of less abundant species. In paper I, the main finding presented was the detection of two molecular condensations (called N and S) showing high values of deuterium fractionation (), derived from the column density ratio (N2D+)/(N2H+).
In this work, the following main results have been obtained:
-
•
The continuum emission at 96 and 225 GHz reveals two main cores, C1 and C2, and C1 is resolved into two components in the image at 284 GHz, called C1-a and C1-b. C1 is coincident with a prominent mid-infrared emission detetcted in the Spitzer MIPS images at 24 and 70 m, which is only barely detected towards C2.
-
•
The integrated intensity of the optically thin component of the N2H+ (1–0) line shows an extended distribution with 5 emission peaks. Two of them fall inside condensation N, another one at the edge of condensation S, while none of them overlaps with the continuum sources.
-
•
The integrated emission in the 12CO (2–1) line wings reveals the presence of a powerful bipolar outflow oriented roughly in the WE direction. From the outflow geometry, the sources C1-a and C1-b are the best candidates for powering the outflow. Assuming a unique source driving the outflow, its parameters are consistent with an engine which is a high-mass young stellar object.
-
•
The N2H+ (1–0) line widths are between 1 and 2 km s-1 in a region that spatially corresponds to that where the continuum cores are located, while they are significantly smaller (between 0.5 and 1.5 km s-1) in the deuterated cores.
-
•
Based on previous observations and on the results presented in this work, we can conclude that C1-b very likely harbors a newly formed early-B star embedded inside a hot-core, and C1-a harbors an intermediate-mass class 0 protostar. The nature of C2 is unclear but it could be a very embedded intermediate-mass protostar. If we consider the system of these three continuum sources and roughly assume a spherical symmetry, we deduce a star density of stars pc -3, consistent with the stellar density of the Trapezium cluster and much lower than the value required to form massive stars through collisions of low-mass ones.
-
•
The nature of the deuterated cores has been discussed using mainly the information on the gas kinematics that one can derive from the lines of N2H+ and N2D+. Core S is likely a single low-mass pre–stellar core, and the velocity of both the N2H+ and N2D+ lines indicate a rotation motion roughly in the N-S direction. This motion and the high turbulence measured at the northern edge of the core is likely due to dynamical interaction with the red lobe of the 12CO powerful outflow. The nature of core N is less clear. Two scenarios are possible: it can be a filament of unresolved low-mass pre–stellar cores, similarly to Oph A, and in this case the high values of the N2H+ and N2D+ line widths are just due to the superposition of the several unresolved cores. Alternatively, it can be a single object still in dynamic evolution, which actively interact with the red lobe of the 12CO outflow. In this case, the triggered trubulence can cause either the growth or the fragmentation of the core itself.
From these observations, it is not at all clear how the interaction with the other cluster members can make the condensations evolve towards the formation of low- or high-mass objects. Only higher resolution kinematic studies of the large scale gas around these condensations, and the comparison of these results with hydrodynamic evolution models, will help to understand the core evolution and provide important constraints on the dynamical evolution of intermediate-/high-mass star forming regions.
Acknowledgments. First of all, many thanks to the anonymous referee for his/her useful comments and suggestions. It is a pleasure to thank the staff of the Smithsonian Astrophysical Observatory for the SMA observations. We also thank the IRAM staff and Riccardo Cesaroni for their help in the calibration of the PdBI data. FF is deeply grateful to Marc Audard, Carla Baldovin and Andres Carmona for useful discussion, and to Keping Qiu for fitting the CH3CN spectrum. PC thanks Jonathan Tan for useful discussions on protocluster dynamics. FF acknowledges support by Swiss National Science Foundation grant (PP002 – 110504). TB acknowledges support from US National Science Foundation grant (0708158).
References
- André et al. (2007) André, Ph., Belloche, A., Motte, F., Peretto, N, 2007, A&A, 472, 519
- Bachiller et al. (2001) Bachiller, R., Perez Gutierrez, M., Kumar, M. S. N., Tafalla, M. 2001, A&A, 372, 899
- Beltràn et al. (2008) Beltràn, M.T., Estalella, R., Girart, J.M., Ho, P.T.P., Anglada, G. 2008, A&A, 481, 93
- Bergin et al. (1994) Bergin, E. A., Goldsmith, P. F., Snell, R. L., Ungerechts, H. 1994, ApJ, 431, 674
- Beuther & Sridharan (2007) Beuther, H. & Sridharan, T.K. 2007, ApJ, 668, 348
- Beuther at al. (2002) Beuther, H., Schilke, P., Sridharan, T.K. et al. 2002, A&A, 383, 892
- Beuther et al. (2004) Beuther, H., Schilke, P. & Gueth, F. 2004, ApJ, 608, 330
- Beuther et al. (2006) Beuther, H., Zhang, Q., Sridharan, T.K., Lee, C.-F., Zapata, L.A. 2006, A&A, 454, 221
- Beuther et al. (2007a) Beuther, H., Churchwell, E.B., McKee, C.F., Tan, J.C. 2007a, Protostars and Planets V, p. 165
- Beuther et al. (2007b) Beuther, H., Zhang, Q., Bergin, E.A. et al. 2007b, A&A, 468, 1045
- Bonnell & Bate (2005) Bonnell, I.A., Bate, M.R. 2005, MNRAS, 362, 915
- Bonnell et al. (2004) Bonnell, I.A., Vine, S.G., Bate, M.R. 2004, MNRAS, 349, 735
- Bonnell et al. (1998) Bonnell, I.A., Bate, M.R., Zinnecker, H. 1998, MNRAS 298, 93
- Cabrit & Bertout (1986) Cabrit, S. & Bertout, C. 1986, ApJ, 307, 313
- Caselli et al. (1995) Caselli, P., Myers, P.C., Thaddeus, P. 1995, ApJ, 455L, 77 ApJ, 523, L165
- Caselli et al. (2002a) Caselli, P., Walmsley C.M., Zucconi, A. et al. 2002a, ApJ, 565, 331
- Caselli et al. (2002b) Caselli, P., Walmsley C.M., Zucconi, A. et al. 2002b, ApJ, 565, 344
- Chakrabarti & McKee (2005) Chakrabarti, S. & McKee, C.F. 2005, 631, 792
- Ciolek & Basu (2000) Ciolek, G.E. & Basu, S. 2000, ApJ, 529, 925
- Crapsi et al. (2005) Crapsi, A., Caselli, P., Walmsley, C.M., et al. 2005, ApJ, 619, 379
- Fontani et al. (2005) Fontani, F., Beltran, M.T., Brand, J. et al. 2005, A&A, 432, 921
- Fontani et al. (2006) Fontani, F., Caselli, P., Crapsi, A., et al. 2006, A&A, 460, 709
- Fontani et al. (2008) Fontani, F., Caselli, P., Bourke, T.L., Cesaroni, R., Brand, J. 2008, A&A, 477, L45
- Frerking et al. (1982) Frerking, M.A., Langer, W.D. & Wilson, R.W. 1982, ApJ, 262, 590
- Hill et al. (2006) Hill, T., Thompson, M.A., Burton, M.G. et al. 2006, MNRAS, 368, 1223
- Ho et al. (2004) Ho, P.T.P., Moran, J.M. & Lo K.Y. 2004, ApJ, 616, L1
- Kirk et al. (2007) Kirk, H., Johnstone, D., Tafalla, M. 2007, ApJ, 668, 1042
- Kramer et al. (1998) Kramer, C., Alves, J., Lada, C., et al. 1998, A&A, 329, L33
- Krumholz et al. (2008) Krumholz, M.R., McKee, C.F. 2008, Nature, 451, 1082
- Kuiper et al. (1984) Kuiper, T. B. H., Rodriguez-Kuiper, E. N., Dickinson, D. F. 1984, ApJ, 276, 211
- Kurtz et al. (2000) Kurtz, S., Cesaroni, R., Churchwell, E., Hofner, P., Walmsley, C.M. 2000, Protostars and Planets IV, p. 299
- Kurtz et al. (2004) Kurtz, S., Hofner, P., Alvarez, C.V. 2004, ApJS, 155, 149
- Jijina et al. (1999) Jijina, J., Myers, P.C., Adams, F.C. 1999, ApJS, 125, 161
- Kuiper et al. (1996) Kuiper, T.B.H., Langer, W.D., & Velusamy, T. 1996, ApJ, 468, 761
- Leurini et al. (2007) Leurini, S., Beuther, H., Schilke, P. et al. 2007, A&A, 475, 925
- Leurini et al. (2006) Leurini, S., Schilke, P., Parise, B. et al. 2006, A&A, 454, L83
- Mathis & Wiffen (1989) Mathis J.S., Whiffen G., 1989, ApJ, 341, 808
- McKee & Tan (2003) McKee, C.F. & Tan J.C. 2003, ApJ, 585, 850
- McKee & Tan (2002) McKee, C.F. & Tan J.C. 2002, Nature, 416, 59
- Molinari et al. (1996) Molinari, S., Brand, J., Cesaroni, R., Palla, F. 1996, A&A, 308, 573
- Molinari et al. (2000) Molinari, S., Brand, J., Cesaroni, R., Palla, F. 2000, A&A, 355, 617
- Molinari et al. (2002) Molinari, S., Testi, L. Rodriguez, L.F., Zhang, Q. 2002, ApJ, 570, 758
- Nutter et al. (2006) Nutter, D., Ward-Thompson, D., André, P. 2006, MNRAS, 368, 1833
- Oliveira et al. (2003) Oliveira, C. M., Hébrard, G., Howk, J. C., et al. 2003, ApJ, 587, 235
- Pagani et al. (2008) Pagani, L., Daniel, F., Dubernet, M.L. 2008, A&A, arXiv:0811.3289v1
- Palau et al. (2007) Palau, A., Estalella, R., Ho, P.T.P., Beuther, H., Beltrán, M.T. 2007, A&A, 474, 911
- Pillai et al. (2007) Pillai, T., Wyrowski, F., Hatchell, J., Gibb, A.G., Thompson, M.A. 2007, A&A, 467, 207
- Qi (2005) Qi, C. 2005, The MIR Cookbook (http://cfa-www.harvard.edu/ cqi/mircook.html)
- Roberts & Millar (2007) Roberts, H. & Millar, T.J.007, A&A, 471, 849
- Rodon et al. (2008) Rodon, J.A., Beuther, H., Megeath, S.T., van der Tak, F.F.S. 2008, A&A, 490, 213
- Rohlfs & Wilson (2004) Rohlfs, K & Wilson, T.L. 2004, 4th rev. and enl. ed., by K. Rohlfs and T.L. Wilson. Berlin: Springer, 2004
- Sandell et al. (2003) Sandell, G., Wright, M., Forster, J. R. 2003, ApJ, 590, 45
- Sault et al (1995) Sault, R.J., Teuben, P.J. & Wright, M.C.H. 1995, ASPC, 77, 433
- Slysh et al. (2002) Slysh, V.I., Kalenskii, S.V., ValT̀ts, I.E. 2002, ARep, 46, 49
- Sridharan et al. (2002) Sridharan, T.K., Beuther, H., Schilke, P., Menten, K.M., Wyrowski, F. 2002, ApJ, 566, 931
- Tafalla et al. (2002) Tafalla, M., Myers, P.C., Caselli, P., Walmsley, C.M., Comito, C. 2002, ApJ, 569, 815
- Tafalla et al. (2006) Tafalla, M., Santiago, J., Myers, et al. 2006, A&A, 455, 577
- Townes & Schawlow (1975) Townes, C.H., & Schawlow, A.L. 1975, Microwave spectroscopy (Dover, New York)
- van Loo et al. (2007) van Loo, S., Falle, S.A.E.G., Hartquist, T.W., Moore, T.J.T. 2007, A&A, 471, 213
- Viti et al. (2003) Viti, S., Girart, J. M., Garrod, R., Williams, D. A., Estalella, R. 2003, A&A, 399, 187
- Thompson et al. (2006) Thompson, M.A., Hatchell, J., Walsh, A.J., MacDonald, G.H., Millar, T.J. 2006, A&A, 453, 1003
- Wang et al. (2006) Wang, Y., Zhang, Q., Rathborne, J.M., Jackson, J., Wu, Y. 2006, ApJ, 651, L125
- Zhang et al. (2009) Zhang, Q., Wang, Y., Pillai, T., Rathborne, J. 2009, arXiv:0902.0647
- Zhang et al. (2007) Zhang, Q., Hunter, T.R., Beuther, H. et al. 2007, ApJ, 658, 1152
- Zhang et al. (2005) Zhang, Q., Hunter, T.R., Brand, J. et al. 2005, ApJ, 625, 864
- Zinnecker & Yorke (2007) Zinnecker, H. & Yorke, H.W. 2007, ARA&A, 45, 481