Scl-dE1 GC1: An Extended Globular Cluster in a Low-Luminosity Dwarf Elliptical Galaxy111Based on observations made with the NASA/ESA Hubble Space Telescope, obtained at the Space Telescope Science Institute, which is operated by the Association of Universities for Research in Astronomy, Inc., under NASA contract NAS 5-26555. These observations are associated with program GO-10503.
Abstract
We report the discovery from Hubble Space Telescope ACS images of an extended globular cluster, denoted by Scl-dE1 GC1, in the Sculptor Group dwarf Elliptical galaxy Scl-dE1 (Sc22). The distance of the dE is determined as 4.3 0.25 Mpc from the magnitude of the tip of the red giant branch in the color-magnitude diagram. At this distance the half-light radius of Scl-dE1 GC1 is 22pc, placing it among the largest clusters known, particularly for globular clusters associated with dwarf galaxies. The absolute magnitude of Scl-dE1 GC1 is MV = –6.7 and, to within the photometric uncertainties of the data, the cluster stellar population appears indistinguishable from that of the dE. We suggest that there may be two modes of globular cluster formation in dwarf galaxies, a “normal” mode with half-light radii of typically 3 pc, and an “extended” mode with half-light radii of 10 pc or more.
1 Introduction
Globular clusters have generally been regarded as occupying distinctly different regions from dwarf galaxies in the multi-dimensional space formed from parameters such as central surface brightness, scale length, and total luminosity, mass or velocity dispersion. Recent discoveries, however, have blurred the previous clear-cut separation. For example, among the newly discovered dwarf galaxy satellites of the Milky Way, there are systems such as Willman 1 (Willman et al., 2005), Segue 1 (Belokurov et al., 2007) and Boötes II (Walsh, Jerjen & Willman, 2007) which have very low luminosities and small scale lengths that overlap with those of globular clusters (e.g. Gilmore et al., 2007; Martin, de Jong & Rix, 2008, and the references therein). Equally, there is increasing recognition of the existence of extended globular clusters with comparatively large scale lengths; the M31 clusters discussed in Huxor et al. (2005) and Mackey et al. (2006), and the M33 extended star cluster M33-EC1 (Stonkutė et al., 2008) being prime examples. Note that we argue that extended globular clusters such as these are distinct from the diffuse stellar clusters discussed in Peng et al. (2006), which have notably red (metal-rich) colors and which are spatially associated with galactic disks (Peng et al., 2006). Similarly, we also regard extended globular clusters as distinct from the “faint fuzzies”, low luminosity (MV –7), large (half-light radii between 7 and 15 pc) star clusters that are spatially and kinematically associated with the disks of lenticular galaxies (cf. Brodie & Larsen, 2002).
The origin of the extended globular clusters is not well understood. They are apparently comparatively rare objects, at least in luminous galaxies. For example, Gómez & Woodley (2007) indicate that in NGC 5128, extended clusters (defined as clusters with half-light radii, rh, exceeding 8 pc) make up only 2.4% of their sample. Similarly, in the catalog of Milky Way globular cluster parameters (Harris, 1996, 2003 Feb version), 9% of clusters have rh exceeding 10 pc. As has been known for some time (e.g. van den Bergh & Mackey, 2004, Fig. 3), the majority of these extended clusters are found at large Galactocentric radii. The results for four other spirals (M81, M83, NGC 6946, and M101) show similar small fractions of extended clusters (Chandar, Whitmore & Lee, 2004), but intriguingly, in M51 24% (8 of 34) of the cluster candidates have rh 10 pc (Chandar, Whitmore & Lee, 2004). Extended globular clusters are also known to occur in dwarf galaxies, for example, the Reticulum cluster in the LMC, Arp 2 in the Sagittarius dwarf, and cluster #1 in Fornax all have rh exceeding 10 pc (e.g. van den Bergh & Mackey, 2004).
Clearly to understand the formation processes for these extended clusters, and particularly to investigate any dependence on environment or host galaxy type, structural parameters for larger samples of such clusters are needed. In this context, as already implicitly assumed, the appropriate structural parameter for comparisons of clusters in different dynamical environments is the half-light, or effective, radius of a cluster, as it is generally regarded as being minimally affected by dynamical processes (e.g. Aarseth & Heggie, 1998).
In this paper we report the discovery on deep HST ACS images of an extended globular cluster in the dwarf Elliptical galaxy Scl-dE1 (Sc22), the first such cluster identified in a low luminosity dE. Scl-dE1 (Sc22) is a member of the Sculptor “Group”, a loose aggregation of galaxies that shows considerable extension along the line-of-sight (Jerjen, Freeman & Binggeli, 1998; Karachentsev et al., 2003). In the following section we describe the observations, while 3 discusses the color-magnitude diagram (CMD) of the dE and its distance from the -mag of the tip of the red giant branch. The surface brightness profile of the globular cluster and associated parameters is also derived. The results are discussed in 4 in the context of globular clusters in galactic systems.
2 Observations
As part of GO program 10503, deep images of Scl-dE1 (Sc22) were obtained with the ACS instrument onboard HST in the (wide-) and (wide-) filters. Each observation consisted of a standard 4 point dither pattern with exposures of 1120 s (split into two to allow cosmic ray rejection) at each pointing. The images were processed through the standard ACS data reduction pipeline and combined into single images for each filter using the MULTIDRIZZLE task. Subsequent analysis used these combined frames.
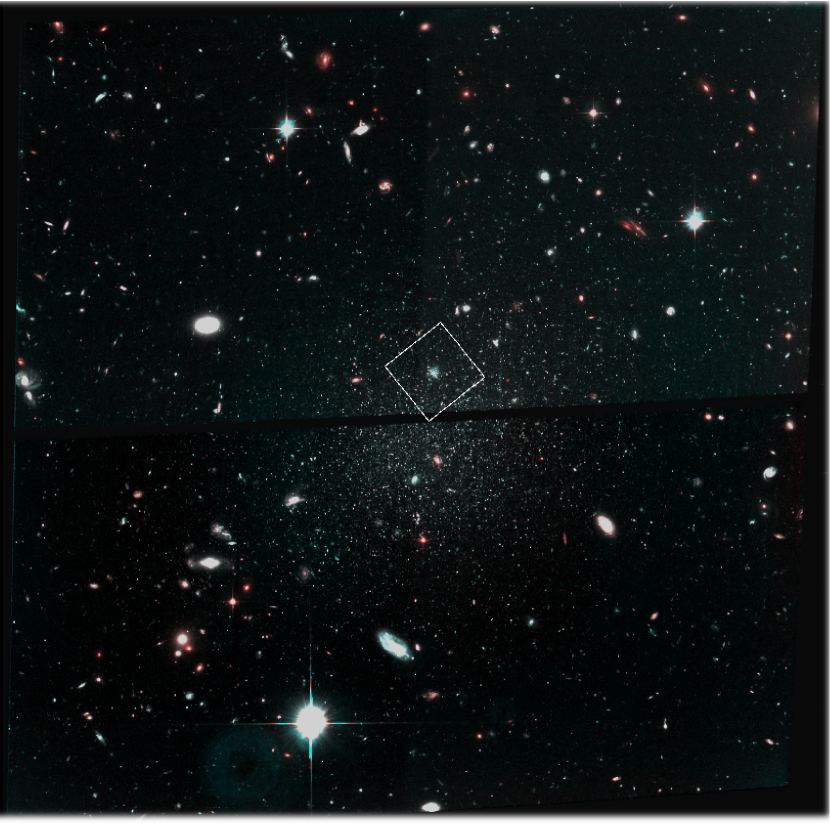
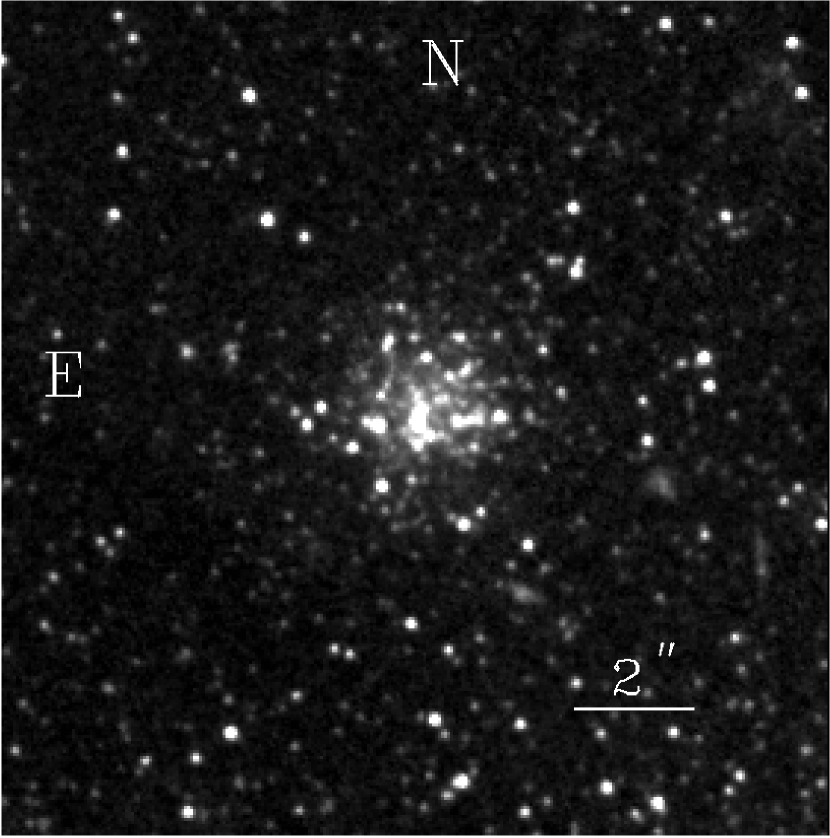
Based on relatively short exposure HST WFPC2 ‘snapshot’ images, Sharina, Puzia & Makarov (2005) listed three candidate globular clusters in Scl-dE1 (Sc22). Inspection of these candidates on our deeper ACS images, however, reveals that all three candidates are background galaxies. Nevertheless, an additional globular cluster candidate is readily visible on the ACS frames222The candidate is visible on the WPC2 snapshot image, but was considered to be most likely a background cluster of galaxies, given the large apparent size., approximately 20 NE of the center of the dE. We refer to this candidate as Scl-dE1 GC1. A color image of the dwarf galaxy made from the and frames, with the cluster candidate identified, is shown in the upper panel of Fig. 1. The lower panel shows an enlargement of the vicinity of the cluster, which is clearly resolved into stars.
3 Analysis
3.1 Color-magnitude diagrams
The first step in the analysis was to determine a CMD for the stellar population of Scl-dE1 (Sc22). The stand-alone version of Stetson’s DAOPHOT/ALLSTAR package (Stetson, 1987, 1994) was employed to carry out the photometric reductions on a pair of and frames. For each frame typically 20-30 of the brighter stars were used to generate the PSF. After the first ALLSTAR run, the subtracted frame was searched for stars missed in the first FIND pass, which were then added into the input list and ALLSTAR run again. This process was repeated for a third time to ensure the maximum number of stars were measured. Aperture photometry was then carried out on the PSF stars to determine the correction from the PSF magnitudes to aperture magnitudes inside a 10pix (0.5) radius aperture. The calibration procedures outlined in Sirianni et al. (2005) were then used to convert the photometry to the ACS VEGAMAG system. Objects with discrepant CHI or SHARP parameters, or magnitude errors, relative to mean values for their measured magnitudes, were deleted from the photometry lists. The cleaned lists for the and images were then matched and the photometry converted to Johnson-Cousins and magnitudes using the transformations in Sirianni et al. (2005). For a typical red giant at 25 and 1.3, the photometric uncertainties are approximately 0.04 and 0.06 mag for and . The systematic uncertainties that affect the overall zero points of the photometry are, for and respectively, 0.015 and 0.03 mag from the uncertainty in the aperture corrections, and 0.02 and 0.025 mag from the uncertainties in the transformations given by Sirianni et al. (2005).
The resulting CMD for the dE is shown in the upper panel of Fig. 2. Detailed discussion of the stellar population of Scl-dE1 (Sc22) will be included in a subsequent paper. Here we note only that the stellar population appears to be dominated by old, metal-poor stars, as expected given the morphological classification of this dwarf and its apparent lack of neutral hydrogen (cf. Bouchard et al., 2005). An -band luminosity function generated from the data of the upper panel of Fig. 2 reveals that the tip of the red giant branch (TRGB) is at = 24.15 0.12, where the error includes contributions from the uncertainty in locating the actual tip given the number of stars involved and the photometric errors, as well from the zero point and aperture correction uncertainties. Rizzi et al. (2007, see also ()) discuss the calibration of the absolute magnitude of the TRGB and give M = –4.05 0.02 at = 1.6, corresponding to [Fe/H] –1.5 for an old stellar population. This value is remarkably close to the original calibration of Da Costa & Armandroff (1990) which gives M = –4.02 for the same parameters. Adopting M = –4.05, then gives (m–M)I = 28.20 which, for a reddening E(B–V) = 0.015 (Schlegel, Finkbeiner & Davis, 1998) and AI=1.86 E(B–V), yields a distance for Scl-dE1 (Sc22) of 4.3 0.25 Mpc. This value is consistent with that, 4.2 0.45 Mpc, given by Karachentsev et al. (2003) from the -mag of the TRGB in a CMD based on HST snapshot images.
With the distance determined, we can estimate the mean metallicity of Scl-dE1 (Sc22) by comparing the mean color of the red giant branch with those of Galactic globular clusters. Using the calibration given in Caldwell et al. (1998) for , the dereddened color of the giant branch at MI = –3.5, the mean metal abundance of Scl-dE1 (Sc22) is [Fe/H] = –1.73 0.17, where the uncertainty includes the statistical error in the mean color, the aperture correction and photometric transformation uncertainties, the uncertainty in the distance and the uncertainty in the calibration. This mean abundance is again consistent with that, [Fe/H] = –1.5 0.3, given by Karachentsev et al. (2003).

In the lower panel of Fig. 2 we show the photometry for stars selected to lie within a radius of 50 pix (2.5) from the center of the candidate globular cluster. The relatively small number of stars in this CMD preclude any definite conclusions regarding the stellar population of the cluster, but it is clearly not significantly different from that of the field population of the dE, i.e. it is also old and metal-poor, supporting the interpretation of the cluster as a definite globular cluster. A first order estimate of the mean abundance of Scl-dE1 GC1 can be obtained by interpolating the colors of the stars brighter than = 26 in the lower panel of Fig. 2 within the frame of the Galactic globular cluster giant branches depicted. This yields [Fe/H] –1.7 0.3 dex, again not notably different from the dE population as a whole. This lack of any clear metallicity difference between the cluster and field stars is similar to the situation in the dwarf irregular galaxy WLM where the metallicity of the single luminous globular cluster is similar to that of the old RGB stars (e.g. Dolphin, 2000).
3.2 Surface photometry of Scl-dE1 GC1
A surface brightness profile of the globular cluster was generated by carrying out aperture photometry with a series of apertures of increasing size centered on the cluster on the and frames. The initial estimate of the cluster center was determined by eye and then refined via application of the centroiding technique in the IRAF apphot routine. The uncertainty in the cluster center position is of order 2 pix (0.1) in each co-ordinate. The background was determined from the signal in an annulus centered on the cluster, with inner and outer radii of 60 and 120 pixels (3–6). A plot of the (background subtracted) concentric aperture magnitudes against aperture radius then readily leads to an estimate of the total magnitude for the cluster. After conversion to the -bands, we find = 21.55 0.05 and = 1.02 0.02 for Scl-dE1 GC1, where the error includes the uncertainty in the background determination. For the distance modulus and reddening given above, this corresponds to MV = –6.67 0.13, where the dominant error is the uncertainty in the distance modulus. Scl-dE1 GC1 is thus somewhat fainter than the peak of the globular cluster luminosity function in dE systems (MV = –7.3, Miller & Lotz (2007)), but not substantially so given that the 1- width of the function is 1 mag (Miller & Lotz, 2007). The color of 1.00 0.02 (measurement error only) is somewhat redder than might be expected for the mean metallicity estimate derived above: for example, the relation given in Barmby et al. (2000) would predict = 0.89 0.03 for [Fe/H] –1.7 0.2 dex. However, given that the relatively low luminosity of the cluster results in a sizable statistical uncertainty in the measured color, and given the uncertainty in the abundance estimate, this difference does not seem particularly significant.
Once the integrated magnitude profile and its asymptote are established, it is straightforward to fix the value of rh, the radius containing half the total light. For the -band data, we find rh = 1.06 0.05, or 22.0 1.5 pc for Scl-dE1 GC1, where the latter uncertainty includes the distance uncertainty. This is an exceptionally large value: for example, in the Harris (1996) catalog (2003 Feb version) for Milky Way globular clusters, only Pal 14 with rh=24.6 pc exceeds this value, with the next three largest clusters being Pal 5 (rh=19.9 pc), NGC 2419 (17.8 pc) and Pal 3 (17.7 pc). We shall return to this point in the following section.
The concentric aperture photometry can be readily turned into a surface brightness profile using standard techniques, e.g. Da Costa (1979). The resulting profile is shown in Fig. 3, where the error bars are the sampling errors, i.e. the uncertainty resulting from the finite number of stars contributing to the light in each annulus. They are calculated following Illingworth & Illingworth (1976). Shown also in the figure is a fit of a King (1962) analytic profile with parameters central surface brightness = 23.1 mag/arcsec2, core radius rc = 1.0 (21.2 pc), and a concentration index = log(rt/rc)=0.65. Given the uncertainty in the individual points, this profile is an adequate representation of the data. The parameters for Scl-dE1 GC1 are summarized in Table 3.2.

| Parameters of Scl-dE1 GC1 | |
|---|---|
| Position (J2000) | 00 23 52.69, –24 41 58.0 |
| Distance from galaxy center | 20 NE (415 pc) |
| (m–M)0 | 28.17 0.12 (4.3 0.25 Mpc) |
| MV | –6.67 0.13 |
| 1.00 0.02 | |
| (mag/arcsec2) | 23.1 0.4 |
| c | 0.65 0.1 |
| rc | 1.0 ( pc) |
| rh | 1.06 ( pc) |
| Fe/H | –1.7 0.3 (from RGB) |
4 Discussion
The specific frequency SN, i.e. the number of globular clusters in a galaxy per unit luminosity, is known to increase with decreasing luminosity in both nucleated and non-nucleated dE galaxies, and to be higher in nucleated systems (e.g. Miller & Lotz, 2007). With its one globular cluster and an absolute visual magnitude MV –11.5, the non-nucleated dE Scl-dE1 (Sc22) has SN 25. This is a large but not exceptional value: Miller & Lotz (2007) list two Virgo cluster non-nucleated dEs with MV –13 and SN 20, while the Fornax dwarf Spheroidal galaxy, with its five globular clusters, has SN 26. Nevertheless, Scl-dE1 (Sc22) is one of the lowest luminosity dEs known to possess a globular cluster – for example, in Georgiev et al. (2008), the lowest luminosity dEs with globular cluster candidates listed are the M81 group object IKN with MV –11.5, and the Cen A group dSph [KK2000] 55 (KKS 55), which has MV –11.2.
Turning now to the large size of Scl-dE1 GC1, in the left panel of Fig. 4 we compare our results to (log rh, MV) values for globular clusters in a number of different galactic systems. The sources of the data are: Milky Way globular clusters, (Harris, 1996, 2003 Feb version); Koposov clusters and Whiting 1, (Koposov et al., 2007); LMC clusters (van den Bergh & Mackey, 2004); SMC clusters (Glatt et al., 2008b); Fornax dSph clusters, (van den Bergh & Mackey, 2004); M33-EC1, (Stonkutė et al., 2008); M31 clusters, (Barmby et al., 2007); M31 extended clusters, (Mackey et al., 2006); NGC 205 clusters, (Barmby et al., 2007); NGC 147 and NGC 185 clusters, (Sharina & Puzia, 2008); WLM globular cluster (Stephens, Catelan & Contreras, 2006); and NGC 5128 clusters, (Gómez et al., 2006; McLaughlin et al., 2008, Appendix). With the exception of Whiting 1, which has an age of 6.5 Gyr (Carraro, Zinn & Moni Bidin, 2007), and the SMC clusters Lindsay 1, Kron 3, NGC 339, NGC 416 and Lindsay 38, which have ages of 7.5, 6.5, 6, 6 and 6.5 Gyr, respectively, (Glatt et al., 2008a), all the clusters plotted are “old” objects, i.e. ages exceeding 10 Gyr.
Shown also on the plot are (log rh, MV) values for three recently discovered very low-luminosity dwarf galaxies, Willman 1, Segue 1 and Bootes II, with the data taken from Martin, de Jong & Rix (2008). These dwarf galaxies have rh values comparable with those of the largest globular clusters, but the clusters are more luminous. More luminous dwarf galaxies than those plotted have larger rh values and lie to the right of the “Shapley line” from van den Bergh (2008), which is shown as the dashed line and which (empirically) appears to separate globular clusters from dwarf galaxies. A constant effective surface brightness of 27.0 mag per arcsec2 is also shown as the dotted line. This line also separates the dwarf galaxies and globular clusters, at least for the dwarf galaxies with rh values less than 100 pc. The right panel repeats the data but is restricted solely to globular clusters in dwarf systems (LMC, SMC, Sgr, Fornax, NGC 147, 185, 205 and WLM in addition to Scl-dE1).

It is immediately apparent from these plots that Scl-dE1 GC1 is an unusual object: there are only a small number of globular clusters of comparable size and only the extended clusters found in M31 (Mackey et al., 2006) definitely exceed it in size. Nevertheless, Scl-dE1 GC1 remains a factor of 10 smaller than dwarf galaxy companions to the Milky Way such as Boo I, Her and UMa I, which have comparable luminosities to the cluster (Martin, de Jong & Rix, 2008). The separation between star clusters and dwarf galaxies at fixed size (clusters are brighter) or fixed luminosity (clusters are smaller) remains in place.
Are there any clues to the origin of Scl-dE1 GC1? Stellar systems are subject to a number of dynamical processes that can lead to their disruption. For example, 2-body relaxation processes can lead to disruption of a cluster on a timescale of 30–50, where is the 2-body relaxation time computed at the half-mass radius (e.g. Gnedin & Ostriker, 1997). We show as dot-dash lines in Fig. 4 the relation between log rh and MV for the case where 20 (upper line) and 40 (lower line) are equated with a Hubble time of 12 Gyr. Clusters lying below these ‘survival lines’ are strongly affected by this process. In calculating these lines we have assumed a constant mass-to-light ratio of 1.6 in solar units, an average stellar mass of 0.35M☉ and a coulomb factor ln() equal to ln(0.02 N)(cf. Gnedin & Ostriker, 1997; Georgiev et al., 2008). This disruption process is clearly unimportant for Scl-dE1 GC1.
For Galactic globular clusters, the tidal gravitational shocks that occur when the cluster passes through the disk of the Galaxy, or passes close to the Galactic bulge, can contribute at least as much as 2-body relaxation to cluster disruption (e.g. Gnedin, Lee & Ostriker, 1999). The disruption timescale from gravitational shocks is proportional to the mass of the cluster divided by (e.g. Gnedin, Lee & Ostriker, 1999), so that large low-mass clusters are particularly at risk from this disruption mechanism. This will be especially the case for clusters with small Galactocentric radii. Indeed, while the fact that the extended globular clusters in the Milky Way halo are predominantly at large Galactocentric radii is sometimes used to argue that these clusters are accreted objects (e.g. Mackey & Gilmore, 2004; van den Bergh & Mackey, 2004), it is actually the low density environment at these large distances, where they are not subject to substantial tidal shock effects, that has ensured their survival. It is not surprising then that the M31 extended clusters are also outer objects with projected galactocentric distances kpc (Mackey et al., 2006) and that the most extended LMC cluster (Reticulum) lies in the extreme outskirts of the LMC (cf. van den Bergh & Mackey, 2004). The extended M33 cluster M33-EC1 also lies well beyond the disk of M33, at a projected distance of 12.5 kpc from the center of the galaxy (Stonkutė et al., 2008). Moreover, in the NGC 5128 samples used here (see above), globular clusters with rh exceeding 10 pc are found at all projected radii from the center of the galaxy beyond 5 kpc, but are apparently notably more frequent beyond Rp = 25 kpc (cf. Fig. 9 of Gómez et al., 2006). Thus a relatively benign gravitational environment would seem to be a prerequisite for the occurrence of extended star clusters, and that is the case for Scl-dE1 GC1. Regardless of whether Scl-dE1 (Sc22) contains a dark halo or not, the density profile of this (non-nucleated) dwarf is smoothly varying (e.g. Jerjen, Binggeli & Freeman, 2000), and it is presumably this consequent lack of substantial tidal effects that allowed such a large cluster as Scl-dE1 GC1 to form and survive.
Further, although there are undoubtedly significant selection effects governing the distribution of points in the right panel of Fig. 4, there is a hint that the distribution of log rh values for the globular clusters in these dwarf galaxies, which are predominantly Local Group systems, is bimodal. There are apparent peaks in the distribution at 0.48 (3 pc) and 1.0 (10 pc), and a dearth of clusters at log rh 0.75 (5.5 pc). In the upper left panel of Fig. 5 we repeat the data from the right panel of Fig. 4 (sans Whiting 1) and in the lower panel left show the distribution of log rh values for these 50 clusters that results from application of the adaptive kernel estimator discussed in Vio et al. (1994). The distribution is indeed bimodal: there are peaks in the distribution at log rh 0.48 and log rh 0.94, and if log rh = 0.75 is used as the dividing line, there is a 1.5 to 1 split between the two populations. We interpret this as indicating there may be two modes of cluster formation, with the less common ‘extended cluster’ mode being relatively more frequent in the gravitationally smoother environment of dwarf galaxies compared to larger galaxies. Such a scenario is consistent with the cluster formation processes discussed in Elmegreen (2008).
The recent results of Georgiev et al. (2008) provide an independent means to investigate our suggestion. These authors have used archival HST/ACS images to investigate the globular cluster populations of 68 dwarf galaxies with distances less than 12 Mpc. No Local Group dwarfs (nor Scl-dE1) are included in their sample. We show in the upper right panel of Fig. 5, the location of 126 globular cluster candidates in the (log r, MV) plane from the Georgiev et al. (2008) data set, noting that the vast majority of these clusters are not resolved into stars. The clusters were chosen to have 0.7 1.1 and MV –11 to select old globular clusters of similar characteristics to those of the Local Group (plus Scl-dE1) dwarf systems. This sample comes from the globular cluster systems of 24 dIrrs, 2 dSphs, 2 dEs and 4 Sm galaxies. Clearly it includes a number of extended clusters, such as cluster 3 in the M81 group dSph IKN, which has rh = 14.8 0.8 pc, cluster 2 in the Cen A/M83 group dSph/I NGC 5237, which has rh = 15.1 0.2 pc, and cluster 10 in the field Sm NGC 4605, which has rh = 19.2 0.3 pc (Georgiev et al., 2008). The lower right panel of Fig. 5 shows the inferred log rh distribution for these 126 clusters, again using an adaptive kernel estimator. This distribution shows a peak at log rh 0.48 (3 pc), essentially the same value as the lower log rh peak for the Local Group sample. There is also a less prominent peak at log rh 0.84, which is at a somewhat lower value than the location of the second peak in the distribution in the left panel of the figure. If we split our Georgiev et al. (2008) sample at log rh = 0.75 as above, the numbers of clusters below and above this limit are in the ratio 2.9 to 1, which is substantially more than for the Local Group (plus Scl-dE1) sample. This difference may be due in part to selection effects as Georgiev et al. (2008) note the more extended clusters suffer from stronger incompleteness. Nevertheless, the distribution in the lower right panel of Fig. 5 is not unimodal: a K-S test indicates that there is a less than 10% probability that the sample of Georgiev et al. (2008) clusters shown is drawn from a gaussian in log rh with mean 0.5 and = 0.25 dex, values which provide an adequate representation of the distribution of log rh values equal to and less than the peak value. Thus our suggestion of the possibility of two modes of cluster formation in dwarf galaxies is by no means ruled out by the Georgiev et al. (2008) data set.
Similarly, while explicitly excluding potential extended globular clusters by eliminating cluster candidates with rh 10 pc, the study of globular cluster sizes in Virgo early-type galaxies of Jordán et al. (2005) nevertheless finds that the (surface brightness corrected) mean half-light radius for globular cluster systems increases with decreasing galaxy luminosity. Inspection of their Fig. 10 suggests this effect is not due to a shift in the main peak of the distribution at rh 2.7 pc, but rather results from an increased fraction of larger clusters for less luminous (bluer) galaxies (Jordán et al., 2005).

We note that the proposed bimodal cluster size distribution would not be expected to be as evident in the size distribution of globular clusters in luminous galaxies (cf. the left panel of Fig. 4 and the discussion in §1) because tidal and other dynamical effects act more strongly to modify the distribution of globular cluster sizes in larger galaxies. Consequently, the extended clusters seen in large galaxies may well indeed be accreted objects, having formed in (now disrupted) dwarf systems. In this scenario Scl-dE1 (Sc22) and the dIrr WLM make an interesting comparison: both have a single globular cluster, but from the different proposed modes: in Scl-dE1 (Sc22) the cluster is extended while in WLM it is relatively compact.
References
- Aarseth & Heggie (1998) Aarseth, S.J., & Heggie, D.C. 1998, MNRAS, 297, 794
- Barmby et al. (2000) Barmby, P., Huchra, J.P., Brodie, J.P., Forber, D.A., Schroder, L.L., & Grillmair, P.J. 2000, ApJ, 119, 727
- Barmby et al. (2007) Barmby, P., McLaughlin, D.E., Harris, W.E., Harris, G.L.H., & Forbes, D.A. 2007, AJ, 133, 2764
- Belokurov et al. (2007) Belokurov, V., et al. 2007, ApJ, 654, 897
- Bouchard et al. (2005) Bouchard, A., Jerjen, H., Da Costa, G.S., & Ott, J. 2005, AJ, 130, 2058
- Brodie & Larsen (2002) Brodie, J.P., & Larsen, S.S. 2002, AJ, 124, 1410
- Caldwell et al. (1998) Caldwell, N., Armandroff, T.E., Da Costa, G.S., & Seitzer, P. 1998, AJ, 115, 535
- Carraro, Zinn & Moni Bidin (2007) Carraro, G., Zinn, R., & Moni Bidin, C. 2007, A&A, 466, 181
- Chandar, Whitmore & Lee (2004) Chandar, R., Whitmore, B., & Lee, M.G. 2004, ApJ, 611, 220
- Da Costa (1979) Da Costa, G.S. 1979, AJ, 84, 505
- Da Costa & Armandroff (1990) Da Costa, G.S., & Armandroff, T.E. 1990, AJ, 100, 162
- Dolphin (2000) Dolphin, A.E. 2000, ApJ, 531, 804
- Elmegreen (2008) Elmegreen, B.G. 2008, ApJ, 672, 1006
- Georgiev et al. (2008) Georgiev, I.Y., Puzia, T.H., Hilker, M., & Goudfrooij, P. 2008, MNRAS, in press (arXiv:0810.3660v1)
- Gilmore et al. (2007) Gilmore, G., Wilkinson, M.I., Wyse, R.F.G., Kleyna, J.T., Koch, A., Evans, N.W, & Grebel, E.K. 2007, ApJ, 663, 948
- Glatt et al. (2008a) Glatt, K., Grebel, E.K., Sabbi, E., Gallagher, J. S. III, Nota, A., Sirianni, M., Clementini, G., Tosi, M., Harbeck, D., Koch, A., Kayser, A., & Da Costa, G. 2008a, AJ, 136, 1703
- Glatt et al. (2008b) Glatt, K., Grebel, E.K., Gallagher, J. S. III, Nota, A., Sabbi. E., Sirianni, M., Clementini, G., Da Costa, G., Tosi, M., Harbeck, D., Koch, A., & Kayser, A. 2008b, AJ, submitted
- Gnedin & Ostriker (1997) Gnedin, O.Y., & Ostriker, J.P. 1997, ApJ, 474, 223
- Gnedin, Lee & Ostriker (1999) Gnedin, O.Y., Lee, H.M., & Ostriker, J.P. 1999, ApJ, 522, 935
- Gómez et al. (2006) Gómez, M., Geisler, D., Harris, W.E., Richtler, T., Harris, G.L.H., & Woodley, K.A. 2006, A&A, 447, 877
- Gómez & Woodley (2007) Gómez, M., & Woodley, K.A. 2007, ApJ, 670, L105
- Harris (1996) Harris, W.E. 1996, AJ, 112, 1487
- Huxor et al. (2005) Huxor, A.P., Tanvir, N.R., Irwin, M.J., Ibata, R., Collett, J.L., Ferguson, A.M.N., Bridges, T., & Lewis, G.F. 2005, MNRAS, 360, 1007
- Illingworth & Illingworth (1976) Illingworth, G., & Illingworth, W. 1976, ApJS, 30, 227
- Jerjen, Binggeli & Freeman (2000) Jerjen, H., Binggeli, B., & Freeman, K.C. 2000, AJ, 119, 593
- Jerjen, Freeman & Binggeli (1998) Jerjen, H., Freeman, K.C., & Binggeli, B. 1998, AJ, 116, 2873
- Jordán et al. (2005) Jordán, A., Côté, P., Blakeslee, J.P., Ferrarese, L., McLaughlin, D.E., Mei, S., Peng, E.W., Tonry, J.L., Merritt, D., Milosavljević, Sarazin, C.L., Sivakoff, G.R., & West, M.J. 2005, ApJ, 634, 1002
- Karachentsev et al. (2003) Karachentsev, I.D., Grebel, E.K., Sharina, M.E., Dolphin, A.E., Geisler, D., Guhathakurta, P., Hodge, P.W., Karachentseva, V.E., Sarajedini, A., & Seitzer, P. 2003, A&A, 404, 93
- King (1962) King, I. 1962, AJ, 67, 471
- Koposov et al. (2007) Koposov, S., de Jong, J.T.A., Belokurov, V., Rix, H.-W., Zucker, D.B., Evans, N.W., Gilmore, G., Irwin, M.J., & Bell, E.F. 2007, ApJ, 669, 337
- Mackey & Gilmore (2004) Mackey, A.D., & Gilmore, G.F. 2004, MNRAS, 355, 504
- Mackey et al. (2006) Mackey, A.D., Huxor, A., Ferguson, A.M.N., Tanvir, N.R., Irwin, M., Ibata, R., Bridges, T., Johnson, R.A., & Lewis, G. 2006, ApJ, 653, L105
- Martin, de Jong & Rix (2008) Martin, N.F., de Jong, J.T.A., & Rix, H.-W. 2008, ApJ, 684, 1075
- McLaughlin et al. (2008) McLaughlin, D.E., Barmby, P., Harris, W.E., Forbes, D.A, & Harris, G.L.H. 2008, MNRAS, 384, 563
- Miller & Lotz (2007) Miller, B.W., & Lotz, J.M. 2007, ApJ, 670, 1074
- Peng et al. (2006) Peng, E.W., Côté, P., Jordán, A., Blakeslee, J.P., Ferrarese, L., Mei, S., West, M.J., Merritt, D., Milosavljevíc, M., & Tonry, J.L. 2006, ApJ, 639, 838
- Rizzi et al. (2007) Rizzi, L., Tully, R.B., Makarov, D., Markarova, L., Dolphin, A.E., Sakai, S., & Shaya, E. 2007, ApJ, 661, 815
- Schlegel, Finkbeiner & Davis (1998) Schlegel, D.J., Finkbeiner, D.P., & Davis, M. 1998, ApJ, 500, 525
- Sharina & Puzia (2008) Sharina, M.E., & Puzia, T.H. 2008, in prep.
- Sharina, Puzia & Makarov (2005) Sharina, M.E., Puzia, T.H., & Mararov, D.I. 2005, A&A, 442, 85
- Sirianni et al. (2005) Sirianni, M., Jee, M.J., Benìtez, N., Blakeslee, J.P., Martel, A.R., Meurer, G., Clampin, M., De Marchi, G., Ford, H.C., Gilliland, R., Hartig, G.F., Illingworth, G.D., Mack, J., & McCann, W.J. 2005, PASP, 117, 1049
- Stephens, Catelan & Contreras (2006) Stephens, A.W., Catelan, M., & Contreras, R.P. 2006, AJ, 131, 1426
- Stetson (1987) Stetson, P.B. 1987, PASP, 99, 191
- Stetson (1994) Stetson, P.B. 1994, PASP, 106, 250
- Stonkutė et al. (2008) Stonkutė, R., Vansevičius, V., Arimoto, N., Hasegawa, T., Narbutis, D., Tamura, N., Jablonka, P., Ohta, K., & Yamada, Y. 2008, AJ, 135, 1482
- Tammann, Sandage & Reindl (2008) Tammann, G.A., Sandage, A., & Reindl, B. 2008, ApJ, 679, 52
- van den Bergh (2008) van den Bergh, S. 2008, MNRAS, 390, L51
- van den Bergh & Mackey (2004) van den Bergh, S., & Mackey, A.D. 2004, MNRAS, 354, 713
- Vio et al. (1994) Vio, R., Fasano, G., Lazzarin, M., & Lessi, O. 1994, A&A, 289, 640
- Walsh, Jerjen & Willman (2007) Walsh, S., Jerjen, H., & Willman, B. 2007, ApJ, 662, L83
- Willman et al. (2005) Willman, B., Blanton, M.R., West, A.A., Dalcanton, J.J., Hogg, D.W., Schneider, D.P., Wherry, N., Yanny, B., & Brinkmann, J. 2005, AJ, 129, 2692