Elemental Abundances in the X-Ray Gas of Early-Type Galaxies with XMM and Chandra Observations
Abstract
The source of hot gas in elliptical galaxies is thought to be due to stellar mass loss, with contributions from supernova events and possibly from infall from a surrounding environment. This picture predicts supersolar values for the metallicity of the gas toward the inner part of the galaxy, which can be tested by measuring the gas phase abundances. We use high-quality data for 10 nearby early-type galaxy from XMM-Newton, featuring both the EPIC and the Reflection Grating Spectrometer, where the strongest emission lines are detected with little blending; some Chandra data are also used. We find excellent consistency in the elemental abundances between the different XMM instruments and good consistency with Chandra. Differences in abundances with aperture size and model complexity are examined, but large differences rarely occur. For a two-temperature thermal model plus a point source contribution, the median Fe and O abundances are 0.86 and 0.44 of the Solar value, while Si and Mg abundances are similar to that for Fe. This is similar to stellar abundances for these galaxies but supernovae were expected to enhance the gas phase abundances considerably, which is not observed.
1 Introduction
Early-type galaxies possess an interstellar medium that is dominated by hot gas (3-10 106 K), although the mass of gas can vary widely between systems. The origin of the hot gas is not entirely a settled issue, but it is probably the result of mass loss from stars within the galaxy as well as infall onto the galaxy, especially when it lies in a galaxy group. The abundances of this gas reflect its history and can potentially inform us as to the number of Type I and Type II supernova that must have been present. There have been a number of surprises in the abundance measurements, such as that the abundance is lower than initially predicted for gas shed from stars and enhanced by supernovae (e.g., Arimoto et al. 1997). Also, the values for the gas abundances have varied considerably, for different models applied to the same galaxy, and between galaxies, so a uniform picture has been slow to emerge.
There are a variety of issues that face investigators when determining abundances within early-type galaxies (or other systems with thermal gas). There is the problem of instrumental calibration, which can be notoriously difficult, despite dedicated efforts by the scientific staff. It is often several years after launch of a mission before most of the important calibration issues are understood. As the calibrations for XMM and Chandra have matured, this is a good time to examine the spectra of similar objects and compare the results.
Another issue is that the derived metallicities are sensitive to the number of spectral components used in a model. This was pointed out by Trinchieri et al. (1994), among others, who showed that when a single-temperature thermal model was applied to the luminous emission from an elliptical galaxy, the derived metallicity was significantly lower than when a two-temperature model was used. Often, the 2 is acceptable for both models, so without further information, it is difficult to identify the correct model. The problem is one of resolution, both spatially and spectrally. On one hand, the temperature can vary within a galaxy, so by analyzing projected emission, there are multiple temperature components. Also, there are point sources, mainly due to low-mass X-ray binaries, and these provide a hard continuum that must be accounted for. Even with Chandra, not all of the individual point sources can be excluded, although their collective spectra are fairly constant from galaxy to galaxy (Irwin et al., 2003), so modeling of this component is tractable. Spectrally, one could identify the need for various spectral components if it were possible to measure lines of various ionization states for the same element. ROSAT did not have sufficient spectral resolution nor bandpass coverage to constrain many of the important parameters nor did it have the spatial resolution to remove point sources. The ASCA satellite could measure the high energy contribution from the X-ray binaries, but had very poor spatial resolution and there were calibration issues at the important low-energy part of the detector.
Some of these issues are resolved by using Chandra and XMM observations. The Chandra data have excellent spatial resolution, so most point sources can be excluded, and the combination of spectral resolution and calibration is superior to its predecessors. In comparison, XMM has poorer spatial resolution but more collecting area and a relatively high dispersion grating spectrum is obtained for all on-axis targets.
There is a range of results that seems puzzling, as both high and low metallicities are found in optically similar galaxies. Individual XMM observations show a similar range of behavior, with subsolar abundances (referenced to Anders & Grevesse 1989), as in NGC 6251 (Sambruna et al., 2004), NGC 3585, 4494 and 5322 (O’Sullivan & Ponman, 2004), near-solar values, as in NGC 4649 (Randall et al., 2006), through the supersolar values seen in NGC 507 (Kim & Fabbiano, 2004). Similarly, individual Chandra obervations of galaxies can be of near solar metallicity, such as in NGC 1316 (Kim & Fabbiano, 2003) or NGC 4649 (Randall et al., 2004), but other galaxies can show quite low abundances, such as NGC 1291 (Irwin et al., 2002). Two surveys of galaxies with Chandra also show a range metallicities, but with no meaningful correlation between the stellar metallicities and the metallicities of the X-ray emitting gas (Athey, 2007; Humphrey & Buote, 2006).
If there is a consistent trend, it is with the ratios of some of the elements, such as in the XMM observation of NGC 4649, where the light elements (N, C, O, Ca; this is dominated by O) are 0.22 of the Solar value, Fe is 0.7 Solar, while the combination of Ne, Mg, Si, S, Ar, Al, Na, and Ni is 1.7 times the Solar value (Randall et al., 2006). These results of O being low relative to Fe are very common, as are the relatively higher values of Mg and Si. Such ratios may be in conflict with expectations from supernovae (Humphrey & Buote, 2006).
The above studies either have been in-depth investigations of a single galaxy with a single instrument (often with different models and approaches), or a study of several galaxies with a single instrument, but there has not been a comparison of results across instruments. One of our objectives is to analyze several galaxies using both Chandra and XMM data and applying the same models to both data sets. This helps to address whether there are serious calibration differences between instruments that might yield misleading results. Also, there has been little use of the Reflection Grating Spectrograph (RGS) data from XMM, which has the highest spectral resolution and where individual strong spectral lines can be detected and identified. With advances in how to model extended sources observed with the RGS, these spectra become extremely useful and we present these for several bright sources. Finally, we examine the differences in the abundances that result when different instrumental backgrounds are adopted.
2 Sample Selection and Data Reduction
2.1 Sample Selection
The sample is based on the work of Brown & Bregman (1998), who obtained a complete sample of 34 early-type galaxies which were optically selected and flux-limited. We selected 10 sources in their sample which were observed by XMM-Newton, and are bright enough to use both of the data of the European Photon Imaging Camera (EPIC) and the Reflection Grating Spectrometer (RGS). This is mainly determined by the quality of the RGS spectra, which were included in our sample by presenting enough emission line features in the preview spectra. Several of these galaxies also have high-quality Chandra data, which were used to determine abundances as well. The observations that were used in this paper are given in Table 1.
2.2 Chandra ACIS Data Processing
Chandra observations of NGC 4649, NGC 4472, and NGC 1399 were obtained from the HEASARC online archive (http://heasarc.gsfc.nasa.gov/docs/archive.html). The data for each observation were processed in a uniform manner following the Chandra data reduction threads using ciao v3.4. Times of high background were removed from the data, and all images created were corrected for exposure and vignetting. Point sources were identified and subsequently removed using “Mexican-Hat” wavelet detection routine wavdetect in ciao on the 0.3–6.0 keV band image. For each galaxy, we extracted spectra from a region 1′ in diameter centered on the nucleus of the galaxy (the same region as was used with XMM-Newton data for these galaxies). Background spectra were extracted from a region near the edge of the S3 chip for each galaxy. While the chosen background region may contain extended emission from the galaxy (which typically fills the entire S3 chip), it only represents 1% of the total emission in the 1′ diameter aperture, so precise treatment of the background is unnecessary. The spectra were grouped such that each spectral bin contained at least 25 counts.
2.3 XMM-Newton EPIC data reduction
The EPIC and RGS data of the 10 sources were processed with standard procedures using XMM-Newton Science Analysis System (SAS, Version 7.0.0).
For the EPIC data, high background periods (counts rate 0.35 cnt s-1 for MOS CCDs and 1 cnt s-1 for PN CCD) were removed by examining light curves of events with photon energy greater than 10 keV and , which is very sensitive to the X-ray flares. Photon events with were retained for the MOS cameras while were retained for the PN camera. We chose the photon events in the energy range 0.3-7.0 keV for the MOS and 0.4-7.0 keV for the PN to eliminate the calibration uncertainty at the lower energy band (0.3 keV for MOS and 0.4 keV for PN) and the uncertainty at the high energy band (7.0 keV) due to very low photon counts.
Two different source regions were extracted from the cleaned event lists. The regions are 1 and 4 in diameter, centered at the peak of the source X-ray emission, which is also the optical center of the galaxy. The reason for this is that the smaller region will be more uniform than the larger region, when radial gradients exist in the gas, such as temperture gradient. The larger region is representative of the average properties of the entire galaxy, so this analysis might be useful for comparisons with more distant galaxies. The larger diameter region will sample a broader variation of gas properties, such as in temperature and abundance, so by comparing the spectral fitting results from the two regions, we can assess the implied variations.
We subtract the background regions on the same observation fields, which are a few arc-minutes away from the central sources and contain little hot gas emission from the central sources; point sources were excluded. The background regions are larger than the source regions to compensate the vignetting effect on the edge, and are circular regions with diameters of 1.67 and 5.83 for source region of 1 and 4, respectively. Redistribution matrix files (RMF), which contain the instrumental responses, and ancillary response files (ARF), which contain the effective area of the detector, were generated with SAS. The spectra were grouped so that each energy bin contains a minimum of 25 counts, appropriate for fitting.
2.4 XMM-Newton RGS data reduction
For the RGS data, high background periods were screened by examining the light curve of CCD9 (excluding the source region), which is the most sensitive CCD to be affected by the background flares. The screening criteria is the same as employed by Tamura et al. (2003), because we are using the same template RGS background. Events were selected in the energy range of 0.33 – 2.48 keV (5 – 38 Å), and the first order spectra of RGS1 and RGS2 were extracted.
The RGS is a slitless spectrograph with a field of view of 5′ in the cross-dispersion direction and 1° in dispersion direction (covering the whole diameter of MOS field of view). The RGS1 and RGS2 are perpendicular to each other and therefore sample different projected spatial regions of the galaxies. The size of the extended emission can be inferred from the their EPIC images, and we can fit the suface brightness distribution with a “beta” model, , where and rc 0.2′. Although some of these galaxies are detectable in X-rays to 5′ the flux is concentrated. Based on the surface brightness distribution, we defined two source extraction regions in the cross-dispersion direction. For a cross-dispersion width of 1′ (to be compared with 1′ diameter regions), 90% of the flux is extracted, while in our larger extraction width of 3.5′, 99% of the flux is extracted. These extraction regions are somewhat different than the circular apertures used to analyze the EPIC data, which is a consideration in the spectral fitting process. If there is a gradient in spectral properties, the narrower extraction width will suffer less spectral blending. The advantage of the spectrum with the larger extraction width is higher S/N, provided that the source remains brighter than the background.
When extracting a spectrum, a background must be removed and the standard procedure is to use a local background, defined as a region in the same CCD, after excluding sources. However, some of these galaxies fill the field of view of the RGS CCDs, so there is no emission-free background region that can be used. Therefore, we used a background from other observations. For our observations, we used the RGS template background (Tamura et al., 2003), combined with several other blank sky observations. The background is selected with the same region on RGS CCDs of the template as the source region. Another advantage of this method is that the background is better defined than a local background due to the very long exposure times of the background fields.
Following screening and background subtraction, the RGS spectra were binned so that each energy bin contain a minimum of 25 counts, making the data appropriate for fitting.
3 Spectral Fitting Techniques and Results
3.1 Spectral Fitting Techniques
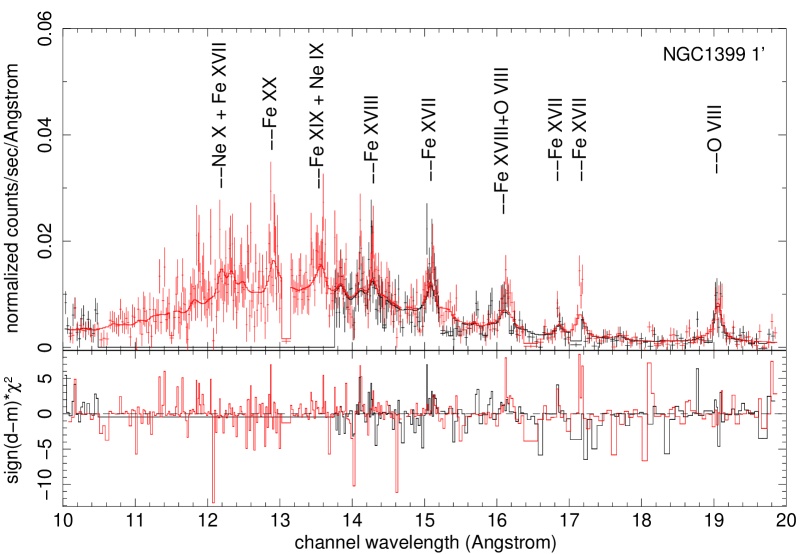
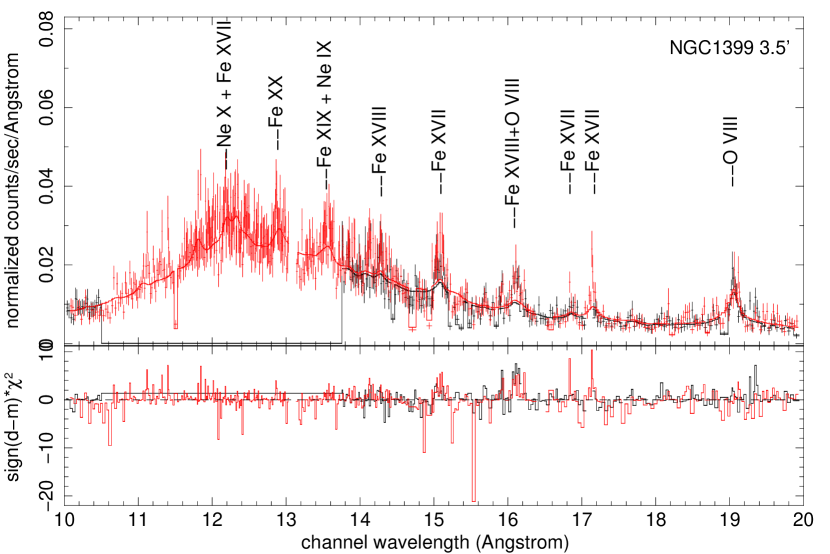
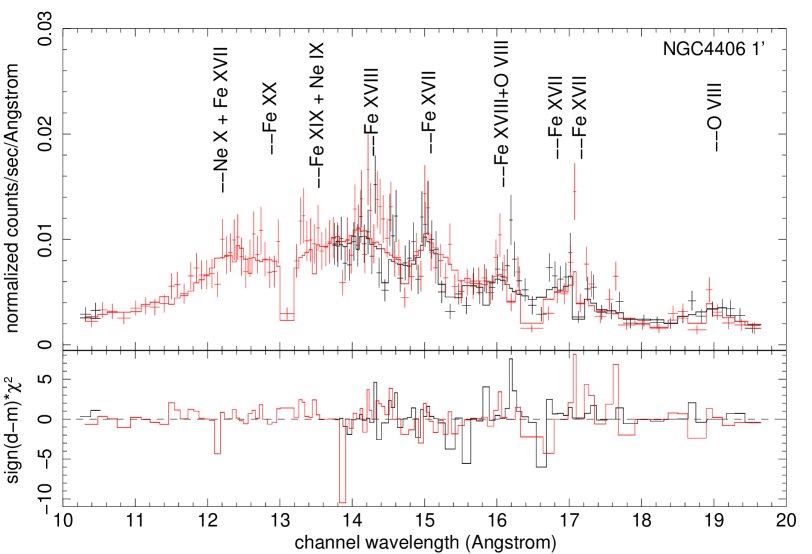
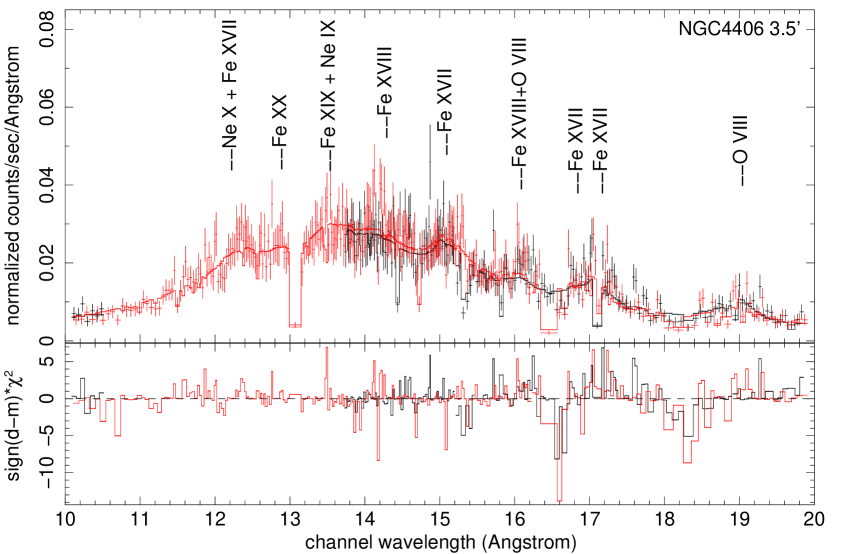
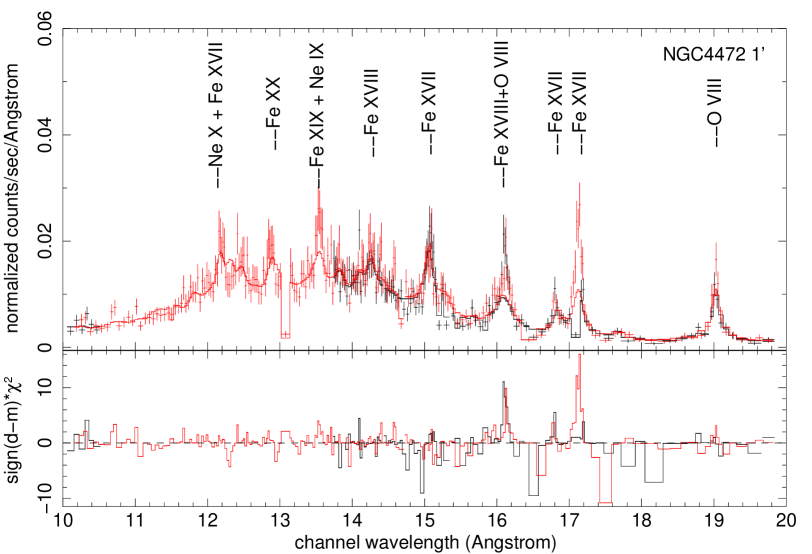
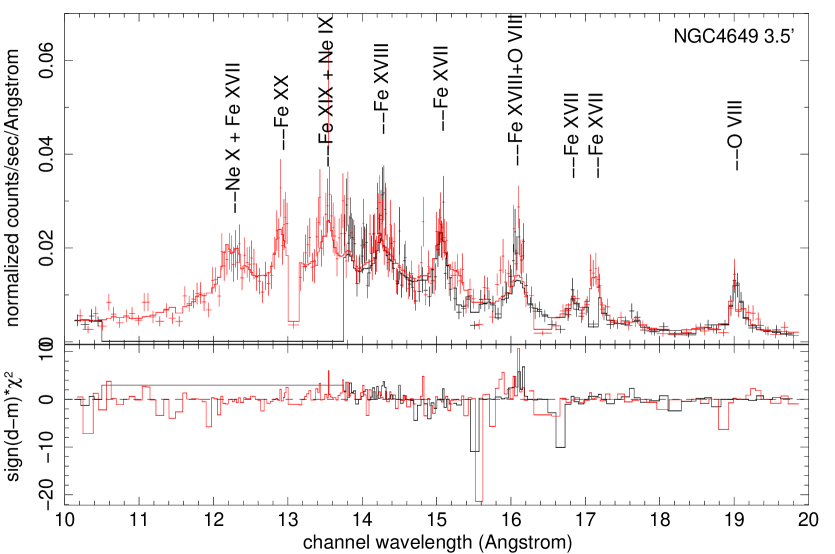
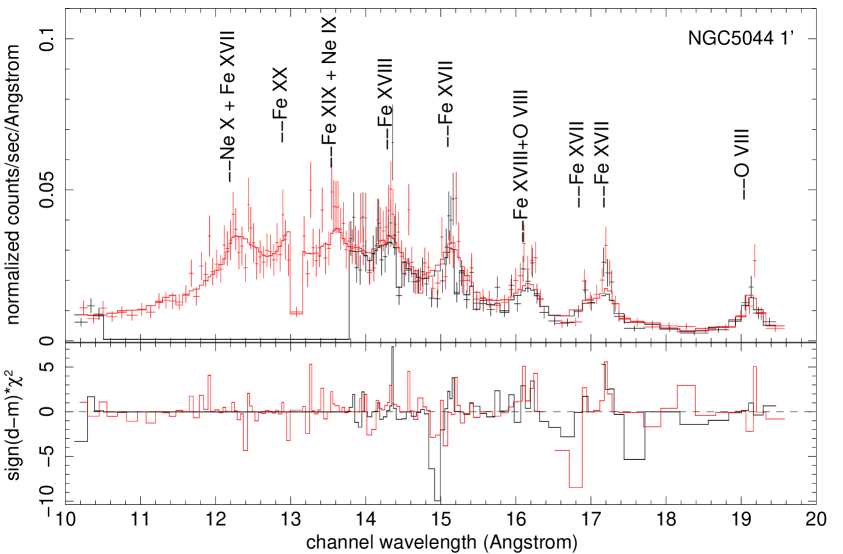
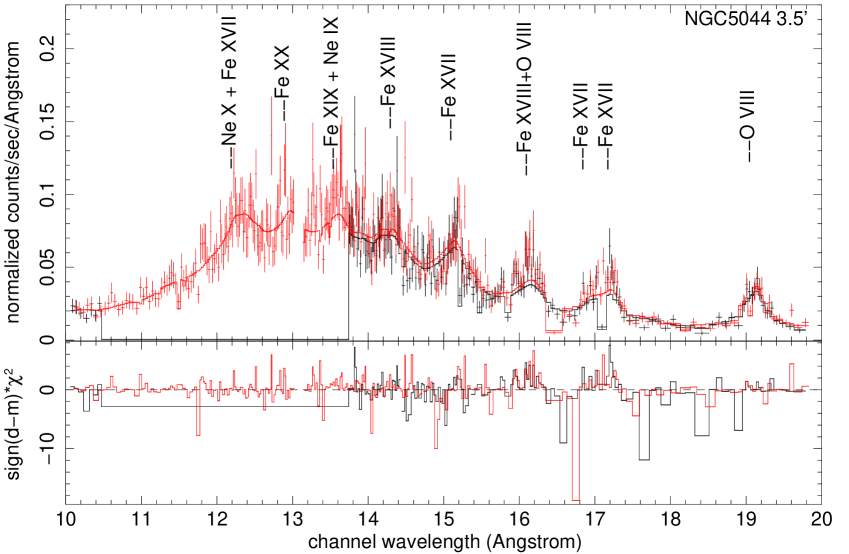
Originally, we anticipated using the RGS spectral fits to yield unambiguous abundance results, as individual lines are resolved from OVIII (19 Å) and highly ionized Fe, such as FeXVII (15, 17 Å) and FeXVIII (16 Å) (see Fig. 1), whereas they are badly blended in the EPIC data. These RGS data provide clear identification of the line strengths and the absence of certain important lines, such as the OVII triplet (20.6-21.1 Å). However, the absolute abundance is a ratio of the line fluxes to the continuum fluxes, and this is less well determined in the RGS data (compared to the EPIC data) for two reasons. The first is that the S/N is poorer in the RGS data due to fewer photons. The second point is that there is a power-law continuum contribution from LMXBs, which can be constrained at high energies from the higher S/N EPIC data. This power-law component cannot be properly constrained with the RGS data because of lower S/N and because the instrument has no response above 2.5 keV, where the power-law is most distinct. Therefore, we found it useful to consider the EPIC and RGS spectral fits separately as well as jointly. All spectral fitting was performed within XSPEC (Version 11.3.2).
As discussed below, there is good consistency when fitting the EPIC instruments separately, so we permfom a simultaneous fit of a single model to the MOS1, MOS2, and the PN data with their normalizations free to fit. For the thermal emission from thermal gas, we used the Astrophysical Plasma Emission code (APEC, Smith et al. 2001), which models optically-thin emission from an isothermal plasma of some abundances (vapec). The optically-thin assumption should be appropriate in most cases, although Xu et al. (2002) demonstrate that optical depth effects occur in the strongest Fe XVII lines for the galaxy NGC 4636. Variations in temperature are accomodated by introducing two vapec models with different temperatures but same set of abundances. For the fits, we fix the X-ray absorbing column at the Galactic HI value (Dickey & Lockman, 1990), and we fit for the temperture, the abundances of Fe, O, Si, and Mg, and the normalization. When the data had sufficiently high S/N, we also fit for Ne, Ni, and S, otherwise, they were tied to Fe with the ratios given by the Solar values. All other elemental abundances were tied to Fe, except for He, which was set at the Solar value. The abundances are referenced to the Solar values, which are defined here by the values of Grevesse & Sauval (1998). In many earlier works, the Solar abundances of Anders & Grevesse (1989) were used, which have higher concentrations of O and Fe by 26% and 48%. Using the newer Solar abunandances, the relative abunances are raised.
When fitting for the power-law component, most point sources are unresolved, unlike the situation for the Chandra observations. Based on Chandra observations of point sources in early-type galaxies, the summed x-ray point source spectra can be represented by a power law model with an average photon index of 1.56 (Irwin et al., 2002). This component dominates mainly the hard x-ray band ( 2 keV), but also contributes some emission to the soft x-ray band ( 2 keV). In the models, the contribution from this model is implemented by including a power-law component, with a fixed photon index of = 1.56 and a free normalization; this component adds one free parameter. From our tests, we find nearly the same value for the power-law normalization when we only consider data above 3 keV (and no thermal component) or when we fit the entire energy range of the spectrum, using a power-law and a vapec component.
The procedure for fitting the Chandra spectra are similar except that most of the point sources are excluded from the spectral fits. Still, there remains the contribution from unresolved point sources, so we included a power-law component, with fixed to 1.56, along with the themal component (vapec) and a Galactic absorption term (wabs).
For the fits to the RGS data, there are a few other considerations, the most important being the broadening of the lines along the dispersion direction due to the extended nature of the emission. A correction for this can be made if the spatial distribution of the emission is known, and for this purpose, we used the EPIC MOS1 image (equivalently, the other images could have been used). Using this image, the broadening correction is implemented by the task rgsxsrc within XSPEC. In the first set of fits to the RGS data, we fix the ratio of the luminosities from the thermal plasma component (vapec) to the power-law component (powerlaw) at the value given by the fits to the EPIC data. For the thermal plasma model, we use the RGS data to fit for the temperature, the normalization, and the abundances for O and Fe, which are the element abundances that are best constrained by the RGS data. Abundances for Mg and Si are determined whenever possible, otherwise they are tied to Fe. In addition, lines are detected from Ne and N for some sources, but the S/N is not sufficient for useful determinations, so the abundances of N, Ne, S, and Ni are tied to Fe.
3.2 Comparison of ACIS-S and EPIC Spectral Fits for Bright Sources
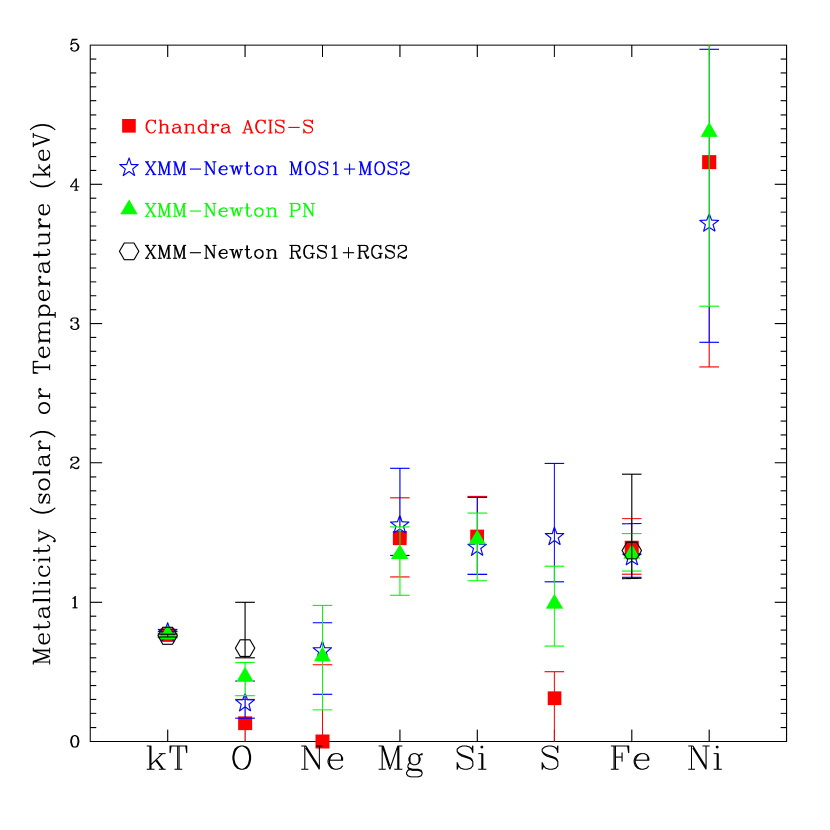
In the comparison between the four imaging devices (see Fig. 2), the results for the inner 1′ diameter of NGC 4649 were fairly consistent, especially between the different EPIC instruments. Using the model described above, best fits were obtained separately for the ACIS-S3 data, the PN data, the combined MOS1+MOS2 data, and the combined RGS1+RGS2 data. This galaxy is an important case because the temperature gradient is small and there is no evidence for a multi-temperature gaseous medium. We find that the temperatures were nearly identical for all detectors, but there were differences in the abundances of O and S between the XMM EPIC instruments and the Chandra ACIS-S detector. The S abundance obtained from the ACIS data is 75% lower than that derived from the EPIC data, and the 90% error bars do not overlap. However, the two abundance measurement differ at the 1.8 level, so this is not a major discrepancy. A similar, but slightly greater discrepancy exist for the O abundance, where the EPIC value is about 2 above the ACIS value. Aside from these differences, the abundances follow rather closely for the different instruments in that, relative to Solar values, O is the least abundant element, followed by Ne. Relative to oxygen, iron has a significantly higher abundance, with Mg and Si a bit higher yet, and then Ni is much higher than the other elements.
3.3 Comparison of the RGS and EPIC Results
We considered one-temperature models in both the central 1′ (for both EPIC and RGS data) and more extended 4′ diameter regions (for EPIC)/3.5′ regions (for RGS), as well as two-temperature models (2T thereafter), shown in Tables 2-3. For the single temperature fits (Table 2), we give both the EPIC (MOS + PN) and the RGS results, and aside from the temperature and abundances, we list the degrees of freedom in the fit (dof), the reduced , and the luminosities from the power law component (Power) and from the thermal component in the 0.33 – 2.48 keV band (in units of 1040 erg s-1). The final column is the ratio of the thermal to the power-law luminosities. For the fit to the RGS data, we forced this ratio to be the same value as for the EPIC fit. In Table 3, we fit all the EPIC data and some good quality RGS data, but with a two-temperature thermal model, so there are two additional columns, for the second temperature, and for the luminosity from the second thermal component. The ratio of the luminosities is the sum of the two thermal components divided by the power-law component. There are two rows per instrument in each table, for the 1′ (for both EPIC and RGS) and the 4′ (for EPIC)/3.5′ (for RGS) diameter regions.
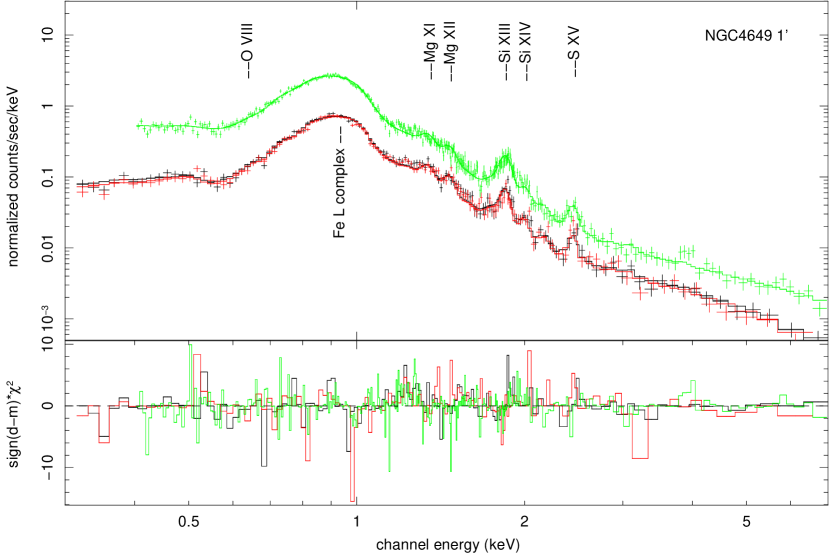
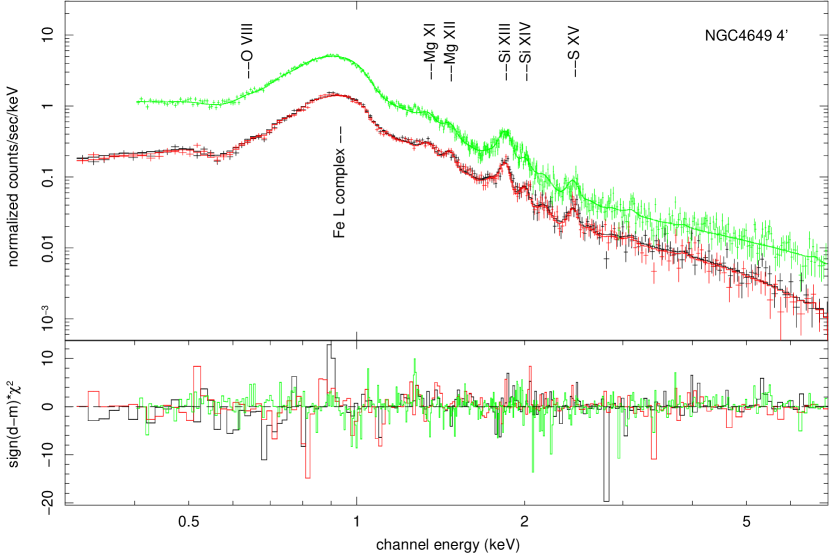
When fitting a model to the data, only photon statistics define the standard deviation per point. In addition, there are systematic uncertainties in the calibration of the instrument as well as instrumental artifacts, not all of which are known or excluded from spectral fits. There is no way of including accurately such effects in the spectral fitting, but we can identify the way in which the will be affected. The resulting will be larger than if there were no systematic effects. Furthermore, these systematic effects do not change as the source becomes brighter, but brighter sources have more photons and therefore lower uncertainties due to photon statistics. Therefore, systematic errors in valid spectral fits will lead to significantly higher reduced and fits that formally would be rejected. This can lead to one rejecting spectral fits to all of the best data sets. Consequently, we have inspected every spectral fit and there are several that appear to be good fits but would formally be rejected. In Fig. 3 we show such an example of the best fit model (2T model) to the EPIC spectra of NGC 4649, which has unacceptable reduced values (1.350 for 1′ region and 1.417 for 4′ region) but shows no significant deviations between best-fit model and data.
For the single-temperature fits within the central 1′ (Table 2), formally acceptable values (not ruled out above the 99% confidence level) are found for three objects with fits to the EPIC data (NGC 720, NGC 4552, and NGC 5044) and two objects with fits to the RGS data (NGC 720 and IC 1459, although NGC 720 has the fewest RGS photons of any source). Of the sources with a large number of photons, which can be inferred from the number of degrees of freedom, the fit to NGC 4406, NGC 4649, and NGC 5044 appear to be good, while there are clear problems with the fits to NGC 1399, NGC 4636, and NGC 4472. The galaxy IC 1459 has a strong central point source that makes it difficult to isolate the thermal gas that we wish to study, so we exclude this from further discussion (but we gave the 1T fitting results in Table 2 excluding central 13″ region in radius). The fit using the 4′ diameter region is worse than when using the central 1′ region, so we emphasize those 1′ region results.
In these one-temperature models, there is quite good agreement in the value of the temperature between the EPIC and RGS fits, and there is also good agreement in the Fe and O abundances between the EPIC and RGS fits within 90% error range except for NGC 720, NGC 3923, NGC 4552, and IC 1459, which have very poor RGS spectra to constrain abundance parameters (Table 2). Excluding the galaxies NGC 1399, NGC 4472, NGC 4636, and IC 1459 (see above), the range of the Fe and O abundances from the EPIC are 0.42-1.57 and 0.26-0.55, respectively (relative to the Solar values). The median values for Fe and O are 0.58 and 0.35 of the Solar values, while the median values from the RGS fits (also excluding NGC 720, NGC 3923, NGC 4552) are slightly higher, at 0.65 and 0.42. The ratio of the Fe to O abundance is around 2:1 in this data set.
Of particular interest are three galaxies, NGC 4406, NGC 4649, and NGC 5044, where the RGS fits appear to be good and where the abundance uncertainties are not large (despite having formally unacceptable values of , discussed above). The galaxy NGC 4649 was discussed above and here we add that the RGS metallicities are in good agreement with those derived from the EPIC data. This is one of the few galaxies where the Fe metallicity is supersolar, although only modestly. The galaxy NGC 5044 has consistent abundances from the EPIC and RGS data, which show that the Fe abundance is about 0.74 of Solar and the O abundance is about 0.43 of Solar. The third galaxy, NGC 4406, has consistent O abundances (about 0.36 Solar) between the two XMM instruments, but the Fe abundance is higher in the EPIC observations. This is a complicated galaxy that is interacting strongly with its environment (Stickel et al., 2003), so perhaps it is not surprising that there would be disagreement for two instruments that sample slightly different spatial regions.
When a second thermal component was introduced, the spectral fits generally improved and the metallicities usually increased. (We fit only six sources with good quality RGS spectra for a second thermal component added. The second temperature will be frozen to its EPIC value if it can not be constrained. We list all results but NGC 4649 in Table 3, which shows no convergence for the 2T model.) For the same eight galaxies used here (all except NGC 4636 and IC 1459) and for one-temperature fits, the Fe abundance rose by a median of 30% while the O abundance rose by 4%. For the EPIC fits to the data within the central 1′ (Table 3), four of the galaxies had formally acceptable fits (NGC 720, NGC 3923, NGC 4552, and NGC 5044), NGC 4406 is nearly acceptable, and the fits to the others appear to be good, with the exception of NGC 4636. Of the good and formally acceptable fits (all except NGC 4636 and IC 1459), the range in the Fe abundance is 0.44-1.70 Solar and for O it is 0.27-0.76 Solar, with medians of 0.86 and 0.44 Solar. Even the two galaxies excluded from the analysis had similar values. The abundances for Mg and Si are indistinguishable from that of Fe, whereas in the one-temperature fits, they were systematically higher than the Fe abundance. In these fits, most of the power is from the gas phase, typically more than 90% in the 0.33 – 2.48 keV band. The RGS fits have Fe and O abundances of 0.33-1.50 Solar and 0.31-1.22 Solar, with medians of 0.95 and 0.66 solar, which is consistant in Fe but higher in O.
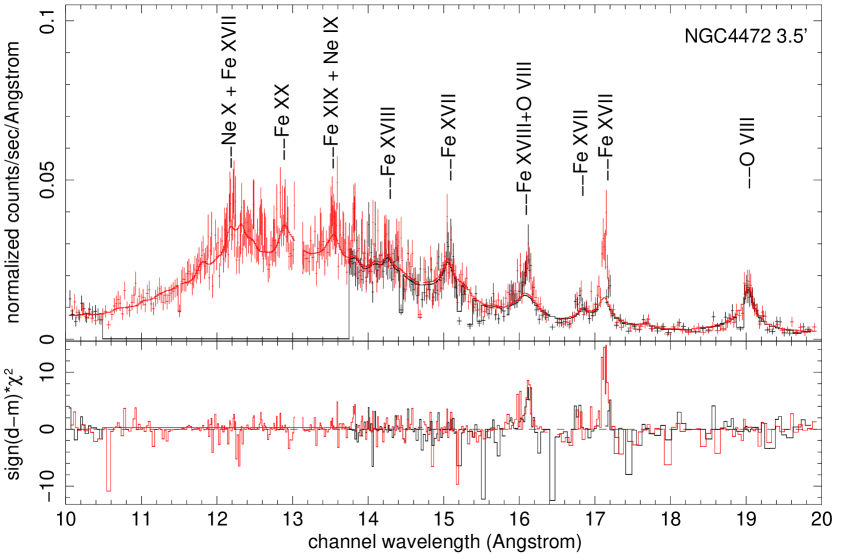
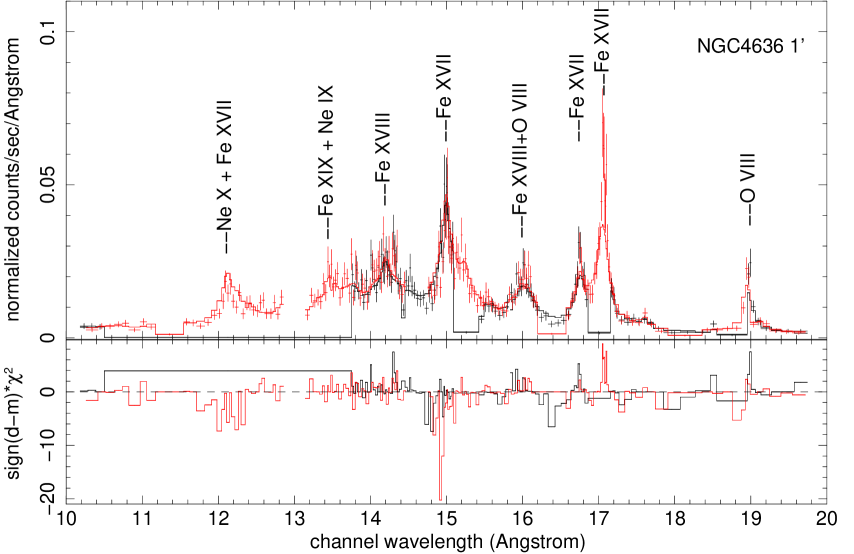
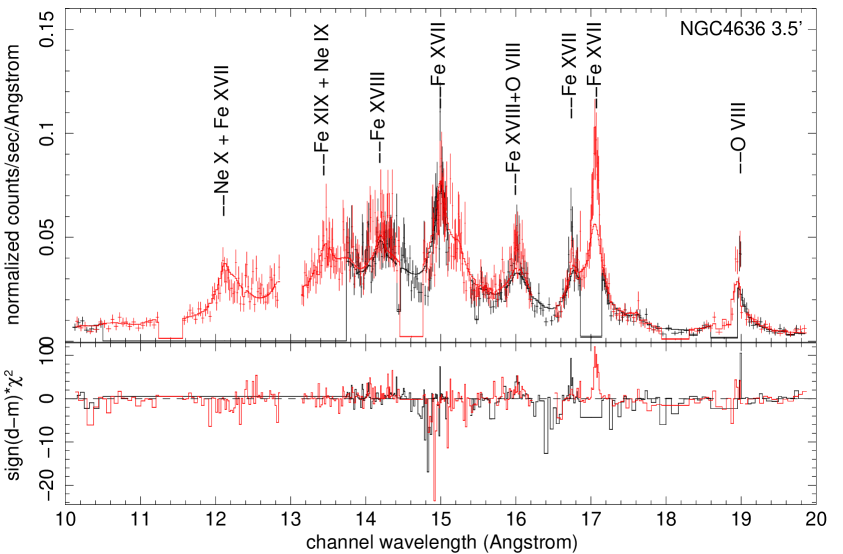
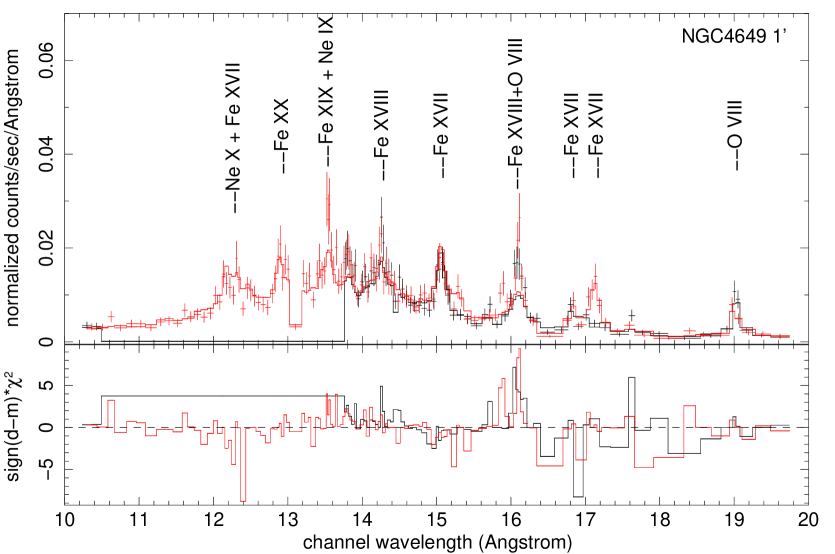
In Fig. 4 - 9, we show zoomed-in RGS spectra with best fit model for the six most bright galaxies with marked individual emission lines. Note that, overall the fits are fairly good, but there are some residuals at Fe XVII and Fe XVIII at 15 Å, 16 Å, or 17 Å. Those residuals are not due to improper convolution with large image size, since usually the isolated O VIII line at 19 Å is fitted fairly well. They might be due to calibration issues or non-accurate APEC model at those lines.
One important object for comparison is NGC 4636, where Xu et al. (2002) fit a model to the RGS data within 2′ that included a temperature gradient and optical depth effects for Fe XVII, which necessitated the use of a model. Their abundances for Fe and O are 1.29 0.06 and 0.63 0.06, relative to the Solar abundances of Grevesse & Sauval (1998). Their ratio of Fe to O is 2 in these units. From our fitting of the RGS data with a single temperature and no opacity correction, we obtain Fe and O abundances that are about 30% lower, but with the same abundance ratio. Our somewhat lower abundance for Fe might be due to the absence of optical depth corrections. Xu et al. (2002) found that the optical depth of Fe XVII line at 15.0 Å is greater than unity for the densities and temperatures in the core of NGC4636 ISM, while the Fe XVII blend at 17.1 Å is negligible. Many scatterings of the 15.0 Å photons flatten its profile comparing to the others, which would cause large uncertainty on Fe abundance. To correct the optical depth effect at 15.0 Å, we fit again the 3.5′ apeture RGS spectra of those very bright galaxies (NGC1399, NGC 4406, NGC 4472, NGC4636, NGC 4649, and NGC 5044), excluding the problematic 15.0 Å line (i.e. excluding 14.75 – 15.4 Å ) as well as freeing the redshift parameter to account any residual line shift. It turns out that only NGC 4636 shows large changes in both parameter values (18% increase in Fe, and 33% increase in O) and in reduced (decrease by 23% ). Other galaxies only show at most 4% variances in Fe, O, and reduced . So optical depth effect at 15.0 Å line is negligible for all the galaxies except for NGC 4636. After corrected this effect for NGC 4636, we still have slightly lower abundances of Fe () and O () from 1T fit, but have consistent abundances of Fe () and O () from the 2T fit, comparing to Fe (1.29 0.06) and O (0.63 0.06) from Xu et al. (2002). These abundances are slightly higher than what XMM EPIC data and ASCA data reveal. Buote (1999) obtained abundances of Fe and O with ASCA of and , respectively, which are consistant with our 2T fit for XMM EPIC data at 4′ diameter region, for Fe and for O. The reason that these abundances from CCD spectral analysis are systematically lower (25% lower for Fe and 12% lower for O) than the XMM RGS results is not due to the uncorrected optical depth effect for Fe XVII line at 15 Å, since we refitted the XMM EPIC 4′ diameter region excluding this line (i.e. excluding 0.79 – 0.88 kev), and found only 4% increase in Fe and 2% increase in O. The reason might be that the RGS and EPIC cameras cover different regions of this galaxy, which shows complex structure and events that have been described by others (Jones et al., 2002; O’Sullivan et al., 2005).
3.4 Comparison with other studies of the metal abundances in early-type galaxies
We show below the detailed comparison with other studies of the metal abundances in early-type galaxies for individual galaxy. Note that our fitted temperatures agree well with the published results, and abundances from literatures are scaled to Grevesse & Sauval (1998).
NGC 720 – Our 4′ diameter aperture EPIC results for NGC 720 (Fe(), O(), Mg(), and Si()) are consistent with Chandra results reported by Humphrey & Buote (2006) (Fe(), O(), and Mg()), and are also consistent with the 180 ks Suzaku observation by Tawara et al. (2008) within 90% error range, who obtained abundances of Fe(), O(), Mg(), and Si().
NGC 1399 – This is an important galaxy with supersolar abundances reported by previous observations. Buote (1999) found an Fe abundance of within a 10′ diameter aperture by ASCA. Later, he reported an XMM result for this galaxy that the Fe abundance in the central region (about 10′ in diameter) is 1.54–2.04 (Buote, 2002). Our net 120 ks XMM observation also shows a consistent but more constrained Fe abundance, , within 4′ diameter region. This Fe abundance is higher than what Humphrey & Buote (2006) obtained with Chandra data, . This is because Humphrey & Buote (2006) obtained an emission-weighted average Fe abundance up to 20′ in diameter, which tends to be lower because the Fe abundance decreases to subsolar at large radius (20′ in diameter) of NGC 1399 (Humphrey & Buote, 2006).
NGC 3923 – Humphrey & Buote (2006) reported a poorly constrained abundance of Fe for 1.03() due to very few counts of photons. We obtained a lower but more constrained Fe abundance (). Since we have many more counts of photons (total counts of ) for this galaxy and obtained a good fit (), we are confident with our result.
NGC 4406 – ASCA observation shows an Fe abundance of (Buote et al., 1998), while Chandra observation shows Fe and O abundances of and , respectively (Athey, 2007). Our results are consistent with these two within error range, which are Fe of and O of .
NGC 4472 – Buote (1999) reported an ASCA result for this galaxy to be for Fe abundance, while Humphrey & Buote (2006) reported an emission-weighted average abundances for Fe and O of and , respectively. Our XMM result gives consistent but more constrained Fe and O abundances of and , respectively.
NGC4552 – Humphrey & Buote (2006) measured abundances of Fe and O from Chandra data of and , while Athey (2007) reported abundances also measured from Chandra data up to 2.5′ diameter region to be for Fe and for O. We obtained better constrained abundances of Fe and O of and , respectively, which are consistent with Athey (2007)’s Fe and O abundances within 90% error range, but is 68% higher in O abundance than Humphrey & Buote (2006)’s result. We attribute this discrepency to be not having enough counts in Chandra’s spectra to constrain the O abundance.
Extra comment for NGC4552: This system is known to be suffering fairly strong ram-pressure stripping and the extent of its gas is quite well-defined from the Chandra images (Machacek et al., 2006). The 1′ diameter region is quite a good match to the gas, but the 4′ aperture might contain a large fraction of cluster and mixed cluster/galaxy gas. In our two-phase model fits in Table 3, however, the abundances are quite consistent between 1′ and 4′ regions. Therefore, the cluster emission will not significantly affect the measurement of the galaxy hot gas abundances in NGC4552 even for 4′ apeture. The reason may be that even for the 4′ region, the local hot gas in NGC4552 is still the dominant thermal component comparing to other thermal component (like the cluster emission), which contributes 63% of the total thermal luminosity.
NGC 4636 – See detailed discussion in Section 3.3.
NGC 4649 – See detailed discussion in Section 3.2.
NGC 5044 – Tamura et al. (2003) obtained abundances of Fe and O within the central 10-20 kpc region (2′ width) of NGC 5044 from XMM-Newton RGS data. Their abundances for Fe and O are and , respectively, which is consistent in O with but higher in Fe than our RGS 1-T model fitting results for 1′ region, Fe(), O(), but are consistent with our RGS 2-T model fitting results of Fe() and O(). Athey (2007) used Chandra for annualar analysis for this galaxy, and found abandances of Fe, O, Mg, and Si within 4′ diameter in the ranges of 0.92–1.53, 0.18–0.96, 1.01–1.77, and 0.95–1.93, respectively. These abundances gradients are also conformed by our study with two aperture analysis of EPIC data. We find abundances gradients of Fe, O, Mg, and Si betweem smaller and larger apertures in the ranges of 0.86–1.15, 0.41–0.49, 0.84–1.14, and 0.86–1.01, respectively. Our average Fe abundance () within 4′ diameter is also consistent with the result by Buote et al. (2003), who reported the XMM observation of emission-weighted average abundance of Fe within 10′ diameter to be .
IC 1459 – This is the only galaxy in our sample that shows different spectral charactistics due to a strong central point source (Fabbiano et al., 2003). Its power-law component is extremely large compared to the thermal component, making it hard to constrain the abundances in the thermal emission. We fit its spectra excluding the central 13″ region in radius, which is mainly a power-law component with a photon index of 1.88 and an excessive absorption of (Fabbiano et al., 2003). We then fit the remainder (mainly thermal emission) with a 1-T thermal component plus a power-law (phont index fixed to 1.56) with only Fe allowed to vary (other elements are tied to Fe). This gives a better constrain on the Fe abundance of , which is consistent with the Chandra result of (Athey, 2007) and the ASCA result of (Buote et al., 1998), within their error ranges. Longer observation is needed to constrain other element abundances. To test if the central point source contributes any photons outside the excluded 13 ″ region, we refitted IC1459 EPIC 1′ region excluding the central 13″ core with photon index free to fit. The fitted photon index is , only increased by 2.6% from 1.56, and the temperature and Fe abundance change not much, by 0.5% and 3.7%, respectively. For 4′ region, the results are essentially not changed. So we conclude that the central point source in IC1459 doesn’t contribute many photons outside the excluded 13” region.
3.5 Discussion on the Assumptions of the Spectral Fitting Method
In our spectral fitting method, we made two simplifying assumptions in the choice of spectral models - freezing the slope of the power law component and linking the abundances of the two-temperature models. We did the following tests to justify these assumptions.
Effect on the slope of the power law component: To check the effect on photon index, we test two cases (with 2T model plus a power law), NGC5044 and NGC3923, according to their different fractions of the total luminosity for the power-law component. During the fitting, the photon index is free to fit.
For NGC5044, the power-law component only contributes 3.4% to the total luminosity in the energy band of 0.33 kev to 2.48 kev in its central 1′ diameter region. The fitted parameters don’t change much. The result shows a best-fit photon index of , which is consistent with 1.56 within its 90% error range. The two temperatures vary by only 0.3%, while the abundances vary at most 5.8%, which are within 90% confidence error range of previous result when fixed photon index to 1.56.
For NGC3923, the power-law component contributes 24.6% to the total luminosity in the energy band of 0.33 kev to 2.48 kev in its central 4′ diameter region. The fitted photon index is , which is consistent with 1.56 within its 90% error range. There are no significant changes in reduced chi-sqaure value as well as the two temperature values, only by 0.4%. Abundance values, however, show large increase by at least 50%. Fe changes most, increased by 70.8%, from to , but is still consistent within their error range.
So we conclude that the value of photon index doesn’t significantly affect the abundance values for hot gas dominent galaxies, and freezing photon index to 1.56 can better constrain the abundance values. But it is the main error source for galaxies where power-law component is comparable to the hot gas component. In our sample, most sources only have a few percent of the total luminosity for the power-law component, and thus are not greatly affected by the value of photon index. Only four galaxies (NGC720, NGC3923, NGC4552, and IC1459) have power-law component with luminosity greater than 15% of the total luminosity, thus their abundances are more greatly affected by the value of photon index. Longer observations for these sources are needed to better constrain the abundances.
Effect on linking the abundances of the 2T models: There are five galaxies (NGC1399, NGC4406, NGC4472, NGC4649, and NGC5044) in our sample which show the possible signs of overlying cluster emission. This can be seen from the 2T model fitting temperatures (see Table 3), where the galaxy hot gas temperatures are around 0.63-0.81 kev, while the cluster emission temperatures are around 0.94-1.72 kev.
We chose NGC1399 4′ region to test the effect of linking two abundance sets, because it has the most photon counts and a comparable cluster emission component to the local galaxy hot gas (about 46% of the total thermal luminosity). During the fit, we unlinked the two abundance sets. Each abundance set then has free parameters of Fe, O, Mg, Si, S, Ne, and Ni. Other elements are tied to Fe. The fitting results show no change for the reduced chi-sqare value, but the 90% confidence range for each abundance parameter becomes larger. The best-fit parameters for the lower temperature component are T:, Fe:, O:, while values for the higher temperature componet are T:, Fe:, and O:. These two sets of abundances do not show much difference within their 90% error bars. They are also consistent with the best-fit parameters when linking the abundances of the 2T models.
So in our sample, even for the region that has the most contamination from the cluster emission, linking the two abundance sets would not significantly affect the hot gas abundances, and it can better constrain the abundances by using fewer free parameters. Direct measurement of abundances for different thermal components are not good for low quality spectra, and deprojected method should be used.
3.6 Discussion on the Effect of RGS Background
For the 1′ RGS region, the local galaxy hot gas emission is always the dominant component. Thus it makes little difference, whether using an RGS background template or using one that contains the underlying cluster emission but free of lcoal galaxy hot gas emission.
For the 3.5′ RGS region, however, the background could have some effect, particularly for those with the brightest surrounding group/cluster emission. In our sample, fainter systems like NGC4552, NGC720, NGC3923, and IC1459 have too poor RGS spectra to constrain their abundances, even for the 3.5′ region. For brighter systems, however, it is very hard to get a local background that contains only the underlying cluster emission but free of galaxy hot gas emission. This is because their extended hot gas emission regions are usually larger than 5′ in diameter (checked with XMM MOS images), but the maximum field of view of RGS in the cross-dispersion direction is only 5′. The only way to obtain this local background is using seperate observation pointing off the target and on the surrounding cluster emission, which is not available for all the galaxies in our sample. Thus using local contaminated background will overestimate the background, while using the RGS background template will underestimate the underlying cluster emission. This is the main error source when determine the abundances for the RGS 3.5’ region, especially when the cluster hot gas component is comparitable to the galaxy hot gas component, which can be seen by the luminosity ratio of the two thermal components obtained from the EPIC fits.
4 Discussion and Conclusions
There have been several previous determinations of metal abundances in early-type galaxies, some of which have obtained similar results (Buote, 1999; Humphrey & Buote, 2006; Athey, 2007). One important difference in this work is that, for a sample of 10 galaxies, we include the RGS data, in which one can clearly see the strong individual lines from Fe, O, and other species, whereas they are thoroughly blended in the XMM EPIC and in the Chandra ACIS data. The identification of these ions not only gives us greater confidence in the abundance determinations, but they often provide very strict constraints on the maximum allowable abundances.
Of the models considered, the one yielding the lowest has a power-law to represent unresolved X-ray binaries, two thermal components with one set of variable abundances for several individual elements (Fe, O, Mg, and Si), and Galactic absorption. This model led to formally acceptable or good fits for most of the galaxies except for NGC 4636 and IC 1459. In IC 1459, there is a strong central point source that compromised spectral fits to the fainter emission from the hot gas. In NGC 4636, a two-temperature model is inadequate, possibly due to the structure and events that have been described by others (Jones et al., 2002; O’Sullivan et al., 2005). Excluding NGC 4636 and IC 1459, the remaining eight galaxies have median abundances (25% and 75% quartile points are given in parenthesis for Fe and O) relative to Solar values (Grevesse & Sauval, 1998) of 0.86 (0.64-1.70), 0.44 (0.29-0.60), 0.81, and 0.79 for Fe, O, Mg, and Si. The abundances for Mg and Si are not distinuishable from that of Fe. Three of the galaxies have mildly supersolar Fe abundances, at about 1.5 of the Solar value, and we note that the three all lie at the center of their group or cluster (NGC 1399 in the Fornax cluster; NGC 4472 is the dominant galaxy in the southern part of the Virgo cluster; NGC 4649 is the brightest member of a group on the outskirts of the Virgo cluster). While this may be a trend, we note that the galaxy NGC 5044 is also the brightest member of its group yet it has abundances that are close to the median values. The galaxy that has the lowest Fe abundance is NGC 4552, the optically least luminous galaxy of this group (and relatively lower in X-ray luminosity). As we will discuss in a future paper, relatively low abundances are found frequently in galaxies with lower X-ray and optical luminosities, as O’Sullivan & Ponman (2004) has found.
One of the issues that we examined was the difference between abundances when a second temperature component is added, sometimes referred to as the Fe-bias (Trinchieri et al., 1994; Buote, 2000). The need for a second temperature component is probably due to a temperature gradient within the galaxy. Upon adding the second thermal component, the increase in Fe was about 30% (quartile values of 7-38%) and for O it was 4% (quartile values of -3%16%). There are two galaxies in which there was essentially no change in the abundances, NGC 4649 and NGC 5044. From radial temperature profiles, NGC 4649 is known to be nearly isothermal (Athey, 2007; Randall et al., 2006), which explains why adding a second temperature component was of little consequence. For NGC 5044, there was always a dominant thermal component and the luminosity from an additional thermal component was relatively small in the best-fit solutions.
Because NGC 4649 can be adequately fit with a single-temperature component and the temperatures do not change with an additional thermal component, we used this source to compare results between spectral fits for the three XMM instruments (EPIC MOS, EPIC PN, and the RGS) and for the Chandra ACIS-S. The derived temperatures were the same to about 1%, and there was excellent agreement between the three XMM-Newton instruments for the seven fitted abundances. The abundances derived from the Chandra ACIS-S were also in good agreement for Fe, Mg, Si, and Ni, but gave lower values than the XMM-Newton data for O, Ne, and S. Overall, Fe, Mg, and Si had similar abundances that were 1.5 times the Solar value, S is consistent with that value, and Ni may be supersolar, although the constraints are poor. Oxygen, the lightest metal in the group, has an abundance of about 0.6 Solar and Ne, the next lightest metal, has an abundance between O and Fe, at about 0.7 Solar.
Metals in hot gas of early type galaxies are thought to come from stellar mass loss, along with supernovae. Since supernovae mainly contribute heavy elements to the hot gas, we should expect supersolar metalicity in hot gas. In Fig. 10, we compared Fe abundances found in hot gas and those from optical studies (only six galaxies in our sample have optical Fe abundances reported in literature by Humphrey & Buote (2006) and Trager et al. (2000)). Only three galaxies (NGC 1399, NGC 4472, and NGC 4649) show modest supersolar Fe abundances in hot gas, while the other three (NGC 720, NGC 3923, and NGC 4552) are slightly subsolar. Supernovae were expected to enhance the gas phase abundances considerably, which is not observed in our sample.
Element abundance ratios can constrain the relative contributions of SN Ia or SN II to the metallicity. In our sample, the median abundance ratios are 0.51, 0.94, and 0.92 for O/Fe, Mg/Fe, and Si/Fe, respectively. These give us the fraction of contribution from Type Ia supernovae of 64%-85% when using linear combination of SN Ia yeilds from W7 model and SN II yields from Nomoto et al. (1997), which indicates that most of the metal enrichment is from Type Ia supernovae.
One important result is the low O/Mg ratio, which we derived a value of 0.54, which is also confirmed to be low by Athey (2007) and Humphrey & Buote (2006). Theoretically, One should expect similar abundance of O to Mg, since SN Ia produces similar amount of O and Mg while SN II produce slightly more O than Mg. The chemical studies of Galactic bulge stars, which are also old star population similar to stars in elliptical galaxies but are mainly enriched by Type II supernovae, also show a similar low O/Mg ratio at high Fe abundance (Fulbright et al., 2004; Minniti & Zoccali, 2007). This low O abundance in the hot gas as well as in bulge stars might be the evidence of an overestimate of O yield by SN II models, which do not consider significant mass loss at the late stage of massive progenitor stars. Since strong stellar wind from massive progenitor stars might reduce or even completely blow away their He-rich envelopes while still preserve the C-O layers, thus after Type II supernove explosions, only elements (like Mg) by Carbon burning are synthesized while elements like O through hydrostatic He burning are greatly reduced (Fulbright et al., 2004). The observed Mg-rich SN remnent of N49B without accompanying Ne or O can support this argument (Park et al., 2003).
References
- Anders & Grevesse (1989) Anders, E., & Grevesse, N. 1989, Geochim. Cosmochim. Acta, 53, 197
- Arimoto et al. (1997) Arimoto, N., Matsushita, K., Ishimaru, Y., Ohashi, T., & Renzini, A. 1997, ApJ, 477, 128
- Athey (2007) Athey, A. E. 2007, Ph.D. Thesis,arXiv:0711.0395v1
- Brown & Bregman (1998) Brown, B. A., & Bregman, J. N. 1998, ApJ, 495,L75
- Buote et al. (1998) Buote, D. A., & Fabian,A. C. 1998, MNRAS, 296,977
- Buote (1999) Buote, D. A. 1999, MNRAS, 309,685
- Buote (2000) Buote, D. A. 2000, MNRAS, 311, 176
- Buote (2002) Buote, D. A. 2002, ApJ,574,L135
- Buote et al. (2003) Buote, D. A.,Lewis, A. D., Brighenti,F., & Mathews, W. 2003, ApJ, 595, 151
- De Vaucouleurs et al. (1991) de Vaucouleurs, G., de Vaucouleurs, A., Corwin, H. G., Buta, R. J., Paturel, G., & Fouque, P. 1991, Third Reference Catalogue of Bright Galaxies (Volume 1-3, XII, 2069 pp. 7 figs.. Springer-Verlag Berlin Heidelberg New York)
- Diehl & Statler (2007) Diehl, S., & Statler, T. S. 2007, ArXiv e-prints, 711, arXiv:0711.3071
- Dickey & Lockman (1990) Dickey, J. M., & Lockman, F. J. 1990, ARA&A, 28, 215
- Humphrey & Buote (2006) Humphrey, P. J., & Buote, D. A. 2006, ApJ, 639, 136
- Fabbiano et al. (2003) Fabbiano,G., Elvis,M., Markoff,S., Siemiginowska, A., Pellegrini,S., Zezas,A., Nicastro,F., Trinchieri,G., & McDowell,J. 2003, ApJ, 588, 175
- Fulbright et al. (2004) Fulbright, J. P., Rich, R.M., & Mcwilliam, A. 2005, Nucl. Phys. A, 758, 197
- Gastaldello & Molendi (2002) Gastaldello, F., & Molendi, S. 2002, ApJ, 572, 160
- Grevesse & Sauval (1998) Grevesse, N., & Sauval, A. J. 1998, Space Science Reviews, 85, 161
- Irwin et al. (2003) Irwin, J. A., Athey, A. E., & Bregman, J. N. 2003, ApJ, 587, 356
- Irwin et al. (2002) Irwin, J. A., Sarazin, C. L., & Bregman, J. N. 2002, ApJ, 570, 152
- Jones et al. (2002) Jones, C., Forman, W., Vikhlinin, A., Markevitch, M., David, L., Warmflash, A., Murray, S., & Nulsen, P. E. J. 2002, ApJ, 567, L115
- Kawata & Gibson (2003) Kawata, D., & Gibson, B. K. 2003, MNRAS, 346, 135
- Kim & Fabbiano (2003) Kim, D.-W., & Fabbiano, G. 2003, ApJ, 586, 826
- Kim & Fabbiano (2004) Kim, D.-W., & Fabbiano, G. 2004, ApJ, 613, 933
- Minniti & Zoccali (2007) Minniti, D. & Zoccali, M. 2007, ArXiv e-prints, 710, arXiv:0710.3104v1
- Machacek et al. (2006) Machacek, M., Jones, C., Forman, W. R., & Nulsen, P. 2006, ApJ, 644, 155
- Nomoto et al. (1997) Nomoto, K., Iwamoto, K., Nakasato, N., Thielemann, F. K., Brachwitz, F., Tsujimoto, T., Kubo, Y., & Kishimoto, N. 1997, Nucl. Phys. A, 621, 467
- O’Sullivan & Ponman (2004) O’Sullivan, E., & Ponman, T. J. 2004, MNRAS, 349, 535
- O’Sullivan et al. (2005) O’Sullivan, E., Vrtilek, J. M., & Kempner, J. C. 2005, ApJ, 624, L77
- Park et al. (2003) Park, S., Hughes, J. P., Slane, P. O., Burrows, D. N., Warren, J. S., Garmire, G. P., & Nousek, J. A. 2003, ApJ, 592, L41
- Randall et al. (2004) Randall, S. W., Sarazin, C. L., & Irwin, J. A. 2004, ApJ, 600, 729
- Randall et al. (2006) Randall, S. W., Sarazin, C. L., & Irwin, J. A. 2006, ApJ, 636, 200
- Sambruna et al. (2004) Sambruna, R. M., Gliozzi, M., Donato, D., Tavecchio, F., Cheung, C. C., & Mushotzky, R. F. 2004, A&A, 414, 885
- Smith et al. (2001) Smith, R. K., Brickhouse, N. S., Liedahl, D. A., & Raymond, J. C. 2001, ApJ, 556, L91
- Stickel et al. (2003) Stickel, M., Bregman, J. N., Fabian, A. C., White, D. A., & Elmegreen, D. M. 2003, A&A, 397, 503
- Tamura et al. (2003) Tamura, T., Kaastra, J. S., Makishima, K., & Takahashi, I. 2003, A&A, 399, 497
- Tawara et al. (2008) Tawara, Y., Matsumoto, C., Tozuka, M., Fukazawa, Y., Matsushita, K., & Anabuki,N. 2008, PASJ, 60, S307
- Tonry et al. (2001) Tonry, J. L, Dressler, A., Blakeslee, J. P., Ajhar, E. A., Fletcher, A. B., Luppino, G. A., & Moore,C. B. 2001, ApJ, 546, 681
- Trager et al. (2000) Trager, S. C., Faber, S. M., Worthey, G., & Gonzalez, J. J. 2000, AJ, 120, 165
- Trinchieri et al. (1994) Trinchieri, G., Kim, D.-W., Fabbiano, G., & Canizares, C. R. C. 1994, ApJ, 428, 555
- Xu et al. (2002) Xu, H., et al. 2002, ApJ, 579, 600
| Galaxy | TypeaaThe galaxy type was take from NED. | bbTotal B band magnitude from RC3 (De Vaucouleurs et al. (1991)). | D ccDistances in Mpc, measured by surface brightness fluctuation method (Tonry et al. (2001)). | ddThe Galactic H I column density, taken from the dust map by Dickey & Lockman (1990). | eeEffective, blue-half light radius in arcsecond derived from RC3 (De Vaucouleurs et al. (1991)). | ObsIDffXMM-Newton observation ID. h:Chandra ObsID. | Net exposure time (ks)ggNet exposure time after filtering background flares. | |||||
|---|---|---|---|---|---|---|---|---|---|---|---|---|
| (mag) | (Mpc) | () | (arcsec) | MOS1 | MOS2 | PN | RGS1 | RGS2 | ACIS-S | |||
| NGC720 | E5 | 11.13 | 27.67 | 1.55 | 39.87 | 0112300101 | 29.6 | 30.0 | 19.9 | 46.3 | 45.3 | - |
| NGC1399 | cD;E1pec | 10.44 | 19.95 | 1.31 | 42.55 | 0400620101 | 121.5 | 120.5 | 73.9 | 118.2 | 118.1 | - |
| NGC1399 | - | - | - | - | - | 319 h | - | - | - | - | - | 55.9 |
| NGC3923 | E4-5 | 10.62 | 22.91 | 6.29 | 53.35 | 0027340101 | 38.8 | 38.7 | 29.8 | 43.9 | 42.6 | - |
| NGC4406 | S0(3)/E3 | 9.74 | 17.14 | 2.58 | 89.64 | 0108260201 | 77.9 | 78.9 | 47.8 | 83.5 | 81.1 | - |
| NGC4472 | E2/S0 | 9.33 | 16.29 | 1.65 | 104.40 | 0200130101 | 82.5 | 82.7 | 72.8 | 101.5 | 101.5 | - |
| NGC4472 | - | - | - | - | - | 321 h | - | - | - | - | - | 32.5 |
| NGC4552 | E | 10.57 | 15.35 | 2.56 | 48.89 | 0141570101 | 27.8 | 31.2 | 18.5 | 42.9 | 42.8 | - |
| NGC4636 | E/S0_1 | 10.43 | 14.66 | 1.83 | 100.08 | 0111190701 | 59.2 | 59.3 | 51.1 | 62.9 | 61.4 | - |
| NGC4649 | E2 | 9.70 | 16.83 | 2.13 | 73.73 | 0021540201 | 50.6 | 50.6 | 42.2 | 53.1 | 51.6 | - |
| NGC4649 | - | - | - | - | - | 785h | - | - | - | - | - | 22.9 |
| NGC5044 | E0 | 11.67 | 31.19 | 5.03 | 82.23 | 0037950101 | 22.6 | 22.7 | 17.0 | 23.6 | 22.8 | - |
| IC1459 | E3 | 10.83 | 29.24 | 1.19 | 38.61 | 0135980201 | 29.3 | 29.3 | 25.2 | 31.7 | 30.8 | - |
| Galaxy | Camera/SizeaaInstruments used and their apertures. EPIC:joint fit for MOS1,MOS2,& pn data; RGS: joint fit for RGS1 & RGS2 data. EPIC source size: diameter of 1 ′ and 4 ′ ; RGS source size: including 90% and 99% of psf, around 1 ′ and 3.5 ′ in the cross-dispersion direction. One phase model: wabs(vapec+power) for EPIC, and wabs(vapec+power)*rgsxsrc for RGS. | (keV)bbOne phase temperature in unit of keV. | Fe ccElemental abundances of Fe, O, Mg, Si, Ne, S, and Ni relative to their Solar values (Grevess et al, 1998). Note: for RGS data, the Mg and Si abundances were allowed to fit when thawing them can improve the fits, otherwise they were tied to Fe. | O ccElemental abundances of Fe, O, Mg, Si, Ne, S, and Ni relative to their Solar values (Grevess et al, 1998). Note: for RGS data, the Mg and Si abundances were allowed to fit when thawing them can improve the fits, otherwise they were tied to Fe. | MgccElemental abundances of Fe, O, Mg, Si, Ne, S, and Ni relative to their Solar values (Grevess et al, 1998). Note: for RGS data, the Mg and Si abundances were allowed to fit when thawing them can improve the fits, otherwise they were tied to Fe. | SiccElemental abundances of Fe, O, Mg, Si, Ne, S, and Ni relative to their Solar values (Grevess et al, 1998). Note: for RGS data, the Mg and Si abundances were allowed to fit when thawing them can improve the fits, otherwise they were tied to Fe. | NeccElemental abundances of Fe, O, Mg, Si, Ne, S, and Ni relative to their Solar values (Grevess et al, 1998). Note: for RGS data, the Mg and Si abundances were allowed to fit when thawing them can improve the fits, otherwise they were tied to Fe. | SccElemental abundances of Fe, O, Mg, Si, Ne, S, and Ni relative to their Solar values (Grevess et al, 1998). Note: for RGS data, the Mg and Si abundances were allowed to fit when thawing them can improve the fits, otherwise they were tied to Fe. | NiccElemental abundances of Fe, O, Mg, Si, Ne, S, and Ni relative to their Solar values (Grevess et al, 1998). Note: for RGS data, the Mg and Si abundances were allowed to fit when thawing them can improve the fits, otherwise they were tied to Fe. | dofddDegrees of freedom. | eeReduced of the fit. | PowerffLuminosity of the power-law component in unit of and in the range of 0.33 keV to 2.48 keV. | VapecggLuminosity of the thermal component (vapec) in unit of and in the range of 0.33 keV to 2.48 keV. | Vapec/PowerhhLuminosity ratio of the thermal component to the power-law one. |
|---|---|---|---|---|---|---|---|---|---|---|---|---|---|---|
| NGC720 | EPIC 1′ | - | 198 | 1.102 | 0.54 | 1.73 | 3.22 | |||||||
| EPIC 4′ | - | - | 500 | 1.274 | 1.61 | 4.19 | 2.61 | |||||||
| RGS 1′ | - | - | - | - | - | 62 | 1.313 | 0.92 | 2.81 | 3.05 | ||||
| RGS 3.5′ | - | - | - | - | - | 143 | 1.303 | 2.06 | 5.37 | 2.61 | ||||
| NGC1399 | ACIS-S 1′ | 143 | 3.520 | 0.71 | 7.98 | 11.28 | ||||||||
| EPIC 1′ | - | 775 | 2.393 | 0.63 | 7.68 | 12.18 | ||||||||
| EPIC 4′ | 1367 | 2.939 | 3.46 | 19.94 | 5.77 | |||||||||
| RGS 1′ | - | - | - | - | - | 1011 | 1.190 | 0.86 | 14.12 | 16.46 | ||||
| RGS 3.5′ | - | - | - | 1451 | 1.323 | 4.55 | 26.88 | 5.91 | ||||||
| NGC3923 | EPIC 1′ | - | 315 | 1.346 | 0.61 | 3.48 | 5.68 | |||||||
| EPIC 4′ | - | 588 | 1.168 | 1.86 | 5.20 | 2.80 | ||||||||
| RGS 1′ | - | - | - | - | - | 91 | 1.421 | 0.64 | 3.76 | 5.86 | ||||
| RGS 3.5′ | - | - | - | - | - | 184 | 1.476 | 1.44 | 4.66 | 3.24 | ||||
| NGC4406 | EPIC 1′ | - | 462 | 1.273 | 0.01 | 0.08 | 8.26 | |||||||
| EPIC 4′ | 919 | 1.409 | 0.04 | 0.44 | 12.07 | |||||||||
| RGS 1′ | - | - | - | - | 304 | 1.294 | 0.03 | 0.29 | 8.32 | |||||
| RGS 3.5′ | - | - | - | - | 774 | 1.230 | 0.06 | 0.80 | 13.29 | |||||
| NGC4472 | ACIS-S 1′ | 123 | 1.595 | 0.29 | 4.15 | 14.11 | ||||||||
| EPIC 1′ | 720 | 1.771 | 0.40 | 4.36 | 11.01 | |||||||||
| EPIC 4′ | - | 1162 | 5.235 | 1.38 | 10.50 | 7.59 | ||||||||
| RGS 1′ | - | - | - | - | 536 | 1.478 | 0.56 | 8.37 | 15.01 | |||||
| RGS 3.5′ | - | - | - | - | 1015 | 1.231 | 1.50 | 13.56 | 9.06 | |||||
| NGC4552 | EPIC 1′ | - | - | - | 414 | 1.063 | 0.07 | 0.18 | 2.64 | |||||
| EPIC 4′ | - | - | 628 | 1.295 | 0.13 | 0.22 | 1.69 | |||||||
| RGS 1′ | - | - | - | - | - | 89 | 1.640 | 0.07 | 0.18 | 2.59 | ||||
| RGS 3.5′ | - | - | - | - | - | 190 | 1.469 | 0.15 | 0.25 | 1.67 | ||||
| NGC4636 | EPIC 1′ | - | 506 | 2.061 | 0.14 | 4.83 | 34.70 | |||||||
| EPIC 4′ | - | 838 | 2.167 | 0.53 | 14.89 | 27.92 | ||||||||
| RGS 1′ | - | - | - | - | 438 | 2.020 | 0.20 | 6.93 | 34.92 | |||||
| RGS 3.5′ | - | - | - | - | 893 | 1.700 | 0.52 | 14.57 | 27.91 | |||||
| RGS corrected 1′iiWe excluded the Fe XVII line at 15 Å (i.e. excluding 14.75 – 15.40 Å) to correct the optical depth effect. | - | - | - | - | 389 | 1.342 | 0.20 | 7.19 | 36.22 | |||||
| RGS corrected 3.5′iiWe excluded the Fe XVII line at 15 Å (i.e. excluding 14.75 – 15.40 Å) to correct the optical depth effect. | - | - | - | - | 810 | 1.307 | 0.52 | 14.85 | 28.48 | |||||
| NGC4649 | ACIS-S 1′ | 112 | 1.421 | 0.48 | 5.68 | 11.91 | ||||||||
| EPIC 1′ | 630 | 1.408 | 0.58 | 5.66 | 9.73 | |||||||||
| EPIC 4′ | 931 | 1.506 | 1.75 | 9.63 | 5.50 | |||||||||
| RGS 1′ | - | - | - | - | - | 325 | 1.335 | 0.71 | 6.93 | 9.73 | ||||
| RGS 3.5′ | - | - | - | - | 552 | 1.258 | 1.66 | 9.41 | 5.67 | |||||
| NGC5044 | EPIC 1′ | 477 | 1.118 | 1.83 | 49.05 | 26.87 | ||||||||
| EPIC 4′ | - | 832 | 1.963 | 8.80 | 249.84 | 28.39 | ||||||||
| RGS 1′ | - | - | - | - | 295 | 1.262 | 4.60 | 123.97 | 26.95 | |||||
| RGS 3.5′ | - | - | - | 668 | 1.210 | 10.25 | 293.81 | 28.65 | ||||||
| IC1459 | EPIC 1′no corejjWe excluded the central 13 ″ radius region to eliminate the central non-hot-gas emission. | - | - | - | - | - | - | 171 | 0.828 | 0.90 | 0.31 | 0.35 | ||
| EPIC 4′no corejjWe excluded the central 13 ″ radius region to eliminate the central non-hot-gas emission. | - | - | - | - | - | - | 462 | 1.049 | 1.96 | 1.36 | 0.69 | |||
| RGS 1′ | - | - | - | - | - | 66 | 1.105 | 2.02 | 1.95 | 0.97 | ||||
| RGS 3.5′ | - | - | - | - | - | 138 | 0.994 | 2.86 | 2.82 | 0.99 |
| Galaxy | Camera/Size | (keV) | (keV) | Fe | O | Mg | Si | Ne | S | Ni | dof | Power | Vapec1 | Vapec2 | Vapec/Power | |
|---|---|---|---|---|---|---|---|---|---|---|---|---|---|---|---|---|
| NGC720 | EPIC 1′ | - | - | 196 | 1.116 | 0.54 | 0.10 | 1.62 | 3.18 | |||||||
| EPIC 4′ | - | - | - | 500 | 1.094 | 1.48 | 0.66 | 3.65 | 2.92 | |||||||
| NGC1399 | EPIC 1′ | 773 | 1.263 | 0.39 | 6.76 | 1.17 | 20.57 | |||||||||
| EPIC 4′ | - | 1367 | 1.193 | 2.33 | 11.38 | 9.76 | 9.08 | |||||||||
| RGS 1′ | 1.720 | - | - | - | - | - | 1007 | 1.165 | 0.52 | 12.28 | 0.26 | 24.03 | ||||
| RGS 3.5′ | - | - | - | - | 1450 | 1.258 | 3.03 | 5.24 | 21.80 | 8.92 | ||||||
| NGC3923 | EPIC 1′ | - | - | 313 | 1.186 | 0.61 | 0.65 | 2.85 | 5.74 | |||||||
| EPIC 4′ | - | - | - | 589 | 1.024 | 1.72 | 1.35 | 3.93 | 3.06 | |||||||
| NGC4406 | EPIC 1′ | - | 461 | 1.195 | 0.01 | 0.06 | 0.02 | 10.44 | ||||||||
| EPIC 4′ | 918 | 1.137 | 0.03 | 0.26 | 0.19 | 14.11 | ||||||||||
| RGS 1′ | 0.984 | - | - | - | - | 303 | 1.293 | 0.02 | 0.28 | 0.02 | 13.10 | |||||
| RGS 3.5′ | - | - | - | - | - | 773 | 1.182 | 0.06 | 0.20 | 0.62 | 13.42 | |||||
| NGC4472 | EPIC 1′ | 719 | 1.375 | 0.32 | 3.72 | 0.74 | 14.12 | |||||||||
| EPIC 4′ | 1160 | 1.511 | 1.00 | 7.44 | 3.60 | 11.01 | ||||||||||
| RGS 1′ | - | - | - | - | - | 535 | 1.456 | 0.44 | 5.13 | 2.58 | 17.34 | |||||
| RGS 3.5′ | - | - | - | - | 1013 | 1.187 | 1.08 | 3.83 | 9.46 | 12.35 | ||||||
| NGC4552 | EPIC 1′ | - | - | - | 413 | 1.056 | 0.07 | 0.01 | 0.18 | 2.66 | ||||||
| EPIC 4′ | - | - | - | 628 | 1.132 | 0.12 | 0.09 | 0.15 | 2.00 | |||||||
| NGC4636 | EPIC 1′ | 502 | 1.501 | 0.14 | 1.45 | 3.38 | 33.74 | |||||||||
| EPIC 4′ | - | 837 | 1.708 | 0.57 | 1.29 | 13.55 | 26.22 | |||||||||
| RGS 1′ | 0.336 | - | - | - | - | 437 | 2.023 | 0.21 | 0.18 | 6.76 | 32.36 | |||||
| RGS 3.5′ | - | - | - | - | 891 | 1.695 | 0.55 | 0.66 | 13.91 | 26.52 | ||||||
| RGS corrected 1′ | 0.336 | - | - | - | - | 388 | 1.346 | 0.21 | 0.00 | 7.15 | 33.35 | |||||
| RGS corrected 3.5′ | - | - | - | - | 808 | 1.296 | 0.55 | 1.39 | 13.40 | 26.92 | ||||||
| NGC4649 | EPIC 1′ | 628 | 1.356 | 0.56 | 2.76 | 2.92 | 10.20 | |||||||||
| EPIC 4′ | 930 | 1.421 | 1.53 | 9.14 | 0.73 | 6.45 | ||||||||||
| NGC5044 | EPIC 1′ | 474 | 1.074 | 1.73 | 46.70 | 2.45 | 28.33 | |||||||||
| EPIC 4′ | 830 | 1.129 | 1.78 | 206.98 | 49.24 | 144.21 | ||||||||||
| RGS 1′ | 1.474 | - | - | - | - | - | 295 | 1.257 | 4.40 | 114.10 | 10.12 | 28.23 | ||||
| RGS 3.5′ | - | - | - | 666 | 1.202 | 2.10 | 115.57 | 186.75 | 144.31 |
NOTE: Table is the same as previous one, only that we use two phase model here: wabs(vapec+vapec+power) for EPIC, and wabs(vapec+vapec+power)*rgsxsrc for RGS. For RGS spectra, the second temperature will be frozen to the EPIC fits if it cannot be constrained.