An analysis of the composite stellar population in M32††thanks: Based on observations obtained at the Gemini Observatory, which is operated by the Association of Universities for Research in Astronomy, Inc., under a cooperative agreement with the NSF on behalf of the Gemini partnership: the National Science Foundation (United States), the Particle Physics and Astronomy Research Council (United Kingdom), the National Research Council (Canada), CONICYT (Chile), the Australian Research Council (Australia), CNPq (Brazil), and CONICET (Argentina) (observing run ID: GN-2004B-Q-74).
Abstract
We obtained long-slit spectra of high signal-to-noise ratio of the galaxy M32 with the Gemini Multi-Object Spectrograph at the Gemini-North telescope. We analysed the integrated spectra by means of full spectral fitting in order to extract the mixture of stellar populations that best represents its composite nature. Three different galactic radii were analysed, from the nuclear region out to 2 arcmin from the centre. This allows us to compare, for the first time, the results of integrated light spectroscopy with those of resolved colour-magnitude diagrams from the literature. As our main result, we propose that an ancient and an intermediate-age population co-exist in M32, and that the balance between these two populations change between the nucleus and outside one effective radius (1 ) in the sense that the contribution from the intermediate population is larger at the nuclear region. We retrieve a smaller signal of a young population at all radii whose origin is unclear and may be a contamination from horizontal branch stars, such as the ones identified by Brown et al. in the nuclear region. We compare our metallicity distribution function for a region 1 to 2 arcmin from the centre to the one obtained with photometric data by Grillmair et al. Both distributions are broad, but our spectroscopically derived distribution has a significant component with , which is not found by Grillmair et al.
keywords:
stars: atmospheres, stars: evolution, galaxies: abundances, galaxies: evolution, galaxies: stellar content1 Introduction
| Model | log(age[yr]) | [Z/Z☉] | Wavelength range (Å) |
|---|---|---|---|
| BC03 | 8.0 10.3 | 2.2, 1.6, 0.6, 0.3, 0.05, 0.5 | 4700 8750 |
| Charlot & Bruzual | 8.0 10.3 | 2.2, 1.6, 0.6, 0.3, 0.05, 0.5 | 4700 7400 |
| PEGASE-HR | 8.0 10.3 | 1.6, 0.6, 0.3, 0.1, 0.05 | 4700 6800 |
| Vazdekis et al. | 8.0 10.3 | 1.6, 1.2, 0.6, 0.3, 0.05, 0.25 | 4700 7400 |
M32 is a controversial galaxy. This low-mass satellite of M31 has long been considered the prototype of the compact elliptical morphological classification (Bender et al., 1992): low mass, high surface brightness galaxies, tidally truncated companions to massive galaxies. So far, few objects match this description (Ziegler & Bender, 1998; Mieske et al., 2005; Chilingarian et al., 2007). The origins of the peculiar structural properties of M32 are still a matter of debate and the proposed models span a wide range of hypotheses: from a true elliptical galaxy at the lower extreme of the mass sequence to a threshed early-type spiral (Nieto & Prugniel, 1987; Bekki et al., 2001; Choi et al., 2002; Graham, 2002; Gallagher et al., 2005; Young et al., 2008).
Controversial or not, M32 is a galaxy we need to understand because it plays an important role in resolving controversies about how to interpret the integrated spectra of galaxies: it is an early-type galaxy where we can get extremely high signal-to-noise (S/N) in the spectra, good coverage outside the nucleus to look for radial population gradients and resolve individual stars to a very meaningful magnitude level. If we hope to claim that we understand the evolution of distant early-type galaxies, we must first be able to demonstrate an understanding of M32 stellar population.
The stellar population of M32 has been extensively studied by means of integrated spectroscopy and resolved photometry. Most studies of the integrated spectrum of M32 have found signatures of an intermediate-age and close to solar metallicity population (e.g. Rose, 1985; Davidge, 1990; Freedman, 1992; Jones & Worthey, 1995; Vazdekis & Arimoto, 1999; del Burgo et al., 2001; Schiavon et al., 2004; Worthey, 2004; Rose et al., 2005). The most commonly used technique of deriving mean-ages and mean-metallicities from integrated spectroscopy, as articulated by Worthey (1994), consists in comparing selected spectral indices to the predictions of simple stellar populations (SSP) models. Quoting an SSP-age and an SSP-metallicity, however, does not necessarily imply that a galaxy is an SSP. In fact, Bica et al. (1990) and Hardy et al. (1994) have shown that the spectral energy distribution of M32 cannot be adequately fit by SSP models, and Bica et al. (1990) argued that oversimplifications might explain some of the conflicting results found in literature (see also Oconnell, 1980; Schmidt et al., 1989; Magris & Bruzual, 1993; Rose, 1994; Trager et al., 2000).
Resolved photometric studies include those of Alonso-García et al. (2004) and Brown et al. (2000) who found signatures of a true ancient population in M32 [by the identification of RR-Lyrae and an extended horizontal branch (HB), respectively], and Davidge & Jensen (2007) and references therein, who identified signatures of an intermediate age population. The most comprehensive study to date of the resolved stellar population of M32 has been carried out by Grillmair et al. (1996), who resolved individual stars down to slightly below the level of the HB with the Hubble Space Telescope (HST) Wide-Field Planetary Camera 2 (WFPC2) in a region 12 arcmin from the centre of the galaxy. The most striking feature of this colour-magnitude diagram (CMD; and also the one by Worthey et al., 2004, at a larger radii) is its composite nature, implying a range in [Z/H] from roughly solar down to below 1.0 dex.
Spreads in age and Z are as important as the mean values in understanding the star formation history of a galaxy, and a study that takes into account the composite stellar population of M32 may lead to a better understanding of its origin and evolution. In order to address this question, we obtained spectra of M32 along its major axis out to a radius of 2 arcmin, with the Gemini-North Telescope and Gemini Multi-Object Spectrograph (GMOS). We adopt the code starlight (Cid Fernandes et al., 2005) and state-of-the-art stellar population spectral models (Bruzual & Charlot 2003, hereafter BC03; Le Borgne et al. 2004, hereafter PEGASE-HR; Charlot & Bruzual in preparation, hereafter Charlot & Bruzual; Vazdekis et al. in preparation, hereafter Vazdekis et al.) to perform a pixel-by-pixel modelling of the integrated spectrum of M32. For the first time we extend the analysis of integrated spectra of M32 to the radii of the resolved CMD study by Grillmair et al. (1996).
Our observational data are described in Section 2, and we explain the analysis method in Section 3. Results are given in Section 4 and conclusions in Section 5.
2 Observational data
Long-slit spectra of M32 were obtained on 2004 October 10, 11 and 16 with the GMOS on Gemini-North under the Program GN-2004B-Q-74. We used the R400 grating, a 0.75-arcsec slitwidth and an effective target wavelength at 6800 Å, resulting in spectra with coverage 4700 8930 Å and an average resolution of full width at half-maximum (FWHM) = 5.4 Å.
Four exposures of 30 s each were taken with the slit positioned over the nucleus of the galaxy, along the major axis of the galaxy [position angle (PA) 165∘]. The slit was subsequently moved along the major axis off the central region to avoid contamination by scattered light (see Rose et al., 2005), and four long exposures of 3060 s each were taken. The basic reduction tasks trimming, bias and flat field correction were done with the Gemini reduction package available for iraf. The extraction of the spectra was then performed using the task apall under the National Optical Astronomy Observatories (NOAO) long-slit reduction package. The spectra were extracted using the variance-weighted mode, with simultaneous extraction of the galaxy, sky and sigma spectra. The long GMOS slit (330 arcsec) allow us to measure the sky background in the same exposure as the galaxy spectrum, selected to be at the end of the slit.
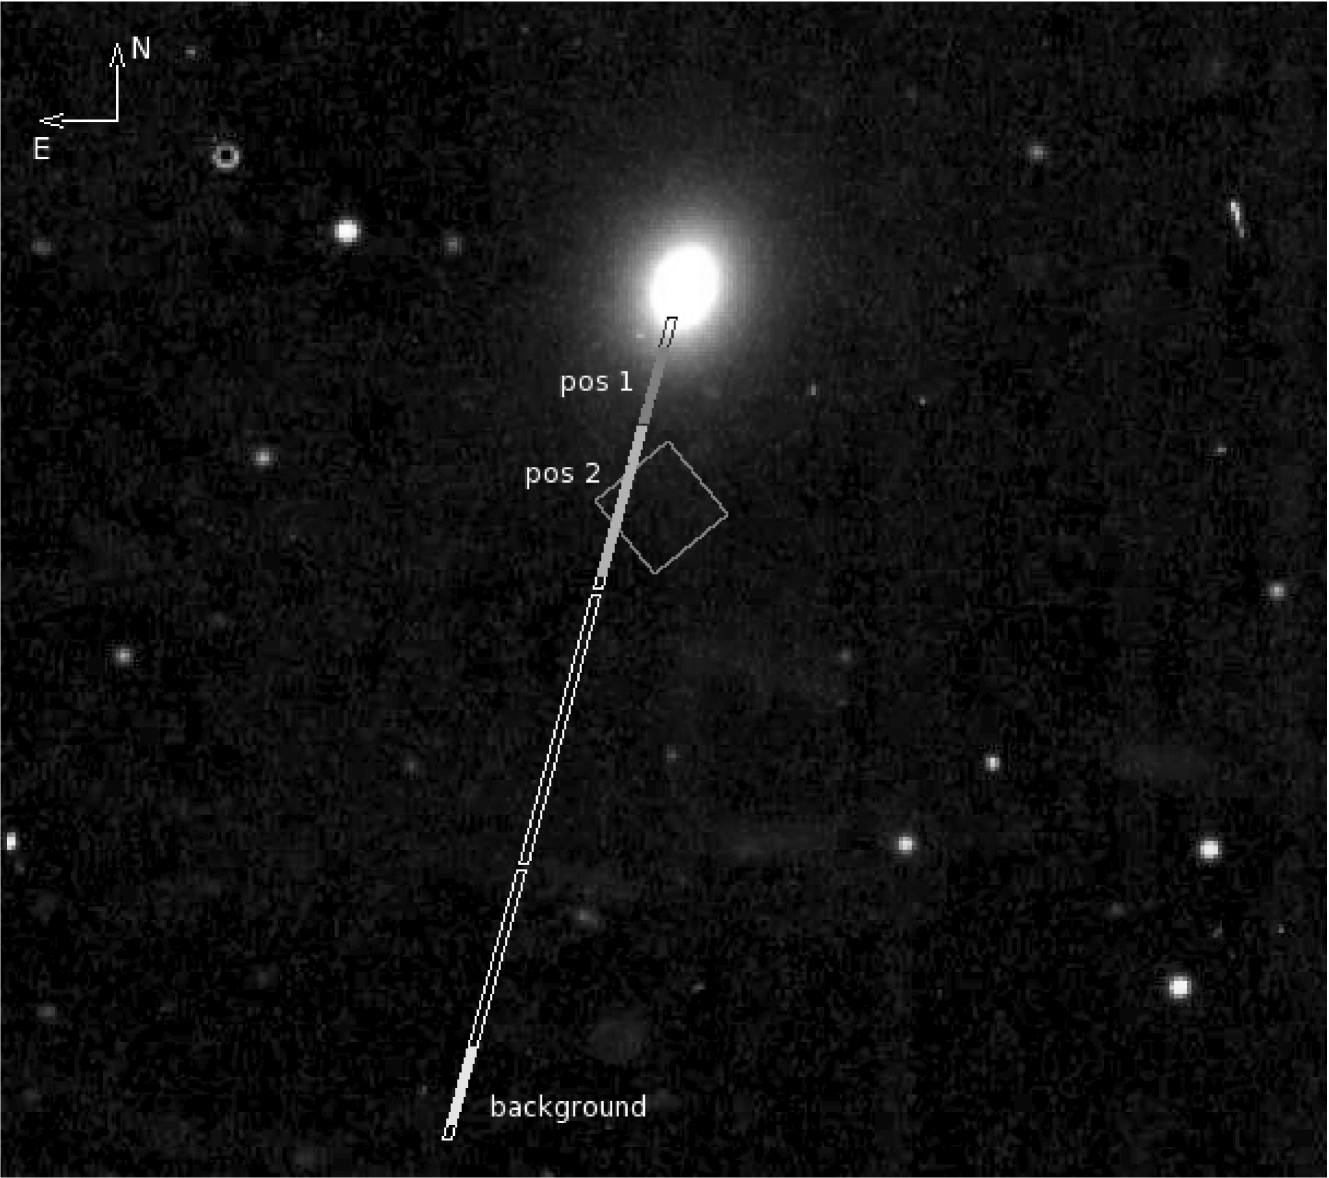
From the short exposure observations, we extracted the nuclear spectra with an aperture of diameter of 1.5 arcsec. From the long off-centre exposures, two apertures were extracted in each exposure: one covering the radius from 30 to 60 arcsec (hereafter, position 1), and another covering from 1 to 2 arcmin (hereafter, position 2). In Fig. 1 it is shown a Digital Sky Survey image of M32 with the GMOS slit indicated, positioned for the long exposures. The apertures extracted as positions 1 and 2 are indicated as filled regions in the slit, as well as the region used to measure the sky background. The signal from position 1 is on average four times stronger than the background level (from eight times the sky level on the side closest to the nucleus, to three times in the darker side). The signal from position 2 is on average two times stronger than the background level (from three to 1.5 times). Position 2 was chosen to sample the same galactic radius observed by Grillmair et al. (1996) in its resolved photometric study, whose approximate field of view is indicated in Fig. 1 as a square.
The four spectra extracted at the central region have S/N111Computed as S/N, where and are the galaxy and sky spectra, respectively. S/N ranging from 34 to 43 pixel-1 at 4750 Å, and from 180 to 230 pixel-1 at 7000 Å. In the case of the long off-centre exposures, the spectra extracted for position 1 have S/N ranging from 50 to 80 and from 270 to 470 pixel-1, at 4750 and 7000 Å respectively. The spectra for position 2 have S/N from 27 to 46 and from 152 to 267 pixel-1 at the same wavelengths. The S/N of the two off-centre apertures drop rapidly beyond 7000 Å due to residuals of sky subtraction.
We have not flux calibrated the spectra as no spectrophotometric standard was observed in the nights of the observations. This will not hamper our analysis, as the full spectrum fitting technique adopted is not sensitive to the shape of the continuum.
3 Analysis
Full spectrum fitting techniques (e.g. Panter et al., 2003; Cid Fernandes et al., 2005; Mathis et al., 2006; Ocvirk et al., 2006a, b; Walcher et al., 2006; Koleva et al., 2008) have been used and validated in recent years as a powerful method for stellar population studies, and allows for fully exploiting the information present in our high-quality spectra of M32.
We employed a modified version of the starlight code by Cid Fernandes et al. (2005) in order to analyse the observed spectra. starlight combines spectra from a user-defined base of individual spectra in search for linear combinations that match an input observed spectrum. We adopt medium spectral-resolution simple SSP models spanning different ages and metallicities as our spectral base (described further in the text), i.e., we describe the data in terms of a superposition of multiple bursts of star formation.
To explore the parameter space defined by the linear coeficients associated with each population, the code uses a series of Markov Chains, each starting from different locations. The likelyhood surface is explored with a simulated annealing scheme, consisting of a succession of steps where values are scaled by a gradually decreasing artificial ‘temperature’ (in analogy with Boltzmann factors in statistical mechanics), and parameter changes are performed with the Metropolis algorithm. In the computation of each spectral pixel is weighted by its correspondent error, but bad pixels (the two CCD gaps in GMOS), strong telluric absorption features and residuals from sky subtraction are masked out. Pixels which deviate by more than three times the rms between the observed spectrum and the initial estimate for the model spectrum are also given zero weight. The internal kinematics is determined simultaneously with the population parameters. The fitted coefficients define a population vector (light fractions xj at a reference wavelength of 5000 Å), which gives the combination of SSP models in the base that best fits (smallest ) the observed spectrum. This same combination of techiques has proved useful in several studies of the star formation history of galaxies of different types (see, e.g., Asari et al. 2007 and the starlight user manual222http://www.starlight.ufsc.br/ for examples).
For the present work, the public version of the code was modified to allow the use of continuum-normalized spectra (as opposed to flux-calibrated spectra). A simple moving average scheme of 200 Å windows (excluding masked points) was used to remove the continuum shape of both model and observed spectra. This method fits all the pixels independently of the continuum, being therefore insensitive to extinction or flux calibration errors. The differences between flux-calibrated versus continuum-normalized spectral fitting have not been extensively studied yet. Wolf et al. (2007) compare four methods of deriving population parameters from integrated stellar cluster spectra, and their results favour the use of continuum-normalized spectra, as this method performed better in simultaneously retrieving age and metallicity for the clusters. We also performed a preliminary test using both versions of starlight on the public globular cluster spectra by Schiavon et al. (2005). We found that the two code versions yield results that agree typically within 0.2 dex in age, and 0.3 dex in metallicity. It is possible, therefore, that the same analysis applied on a set of flux-calibrated spectra would retrieve slightly different results than the ones presented here.
Spectral SSP models, adopted as base spectra, are undergoing constant revisions, following the improvement of their two main ingredients: stellar tracks and stellar spectral libraries. As our aim is to shed some light on the composite nature of M32 stellar population, without being biased by a particular choice of models, we opted for performing the analysis using four different sets of models: BC03, PEGASE-HR, Charlot & Bruzual and Vazdekis et al.333http://www.iac.es/galeria/vazdekis/vazdekis_models_ssp_seds.html. The two latter are preliminary versions of new models being developed on the basis of the work by BC03 and Vazdekis (1999) respectively, using the MILES (Medium resolution INT Library of Empirical Spectra) empirical library (Sánchez-Blázquez et al., 2006a; Cenarro et al., 2007). BC03, Charlot & Bruzual and PEGASE-HR models were computed adopting evolutionary tracks by Bertelli et al. (1994), and Vazdekis adopted tracks by Girardi et al. (2000). BC03 and Charlot & Bruzual adopt initial mass function (IMF) from Chabrier (2003) and PEGASE-HR and Vazdekis et al. adopt the IMF from Salpeter (1955). For the fit procedure, we selected a range of ages between 100 Myr and 15 Gyr, spaced in log(age) = 0.25 dex. For the metallicites Z we adopted the full range provided by each set of models. The minimum wavelength of the fit is set by the observations (4700 Å), and the maximum is set by the base models (see Table 1).
The chosen models are all based on empirical stellar spectral libraries and as such are characterized by the abundance pattern typical of the Milky Way. Models such as those by Coelho et al. (2007) can in principle be used with spectral fitting techniques to extract information of the -enhancement in integrated light-studies. We do not consider such models in the present study, however, as we understand that an analysis of the -enhancement would add an extra free parameter to an already delicate analysis. This will not hamper our conclusions, as Worthey (2004) has shown that non-solar abundance ratio effects are mild in the case of M32, and do not change the population parameters significantly.
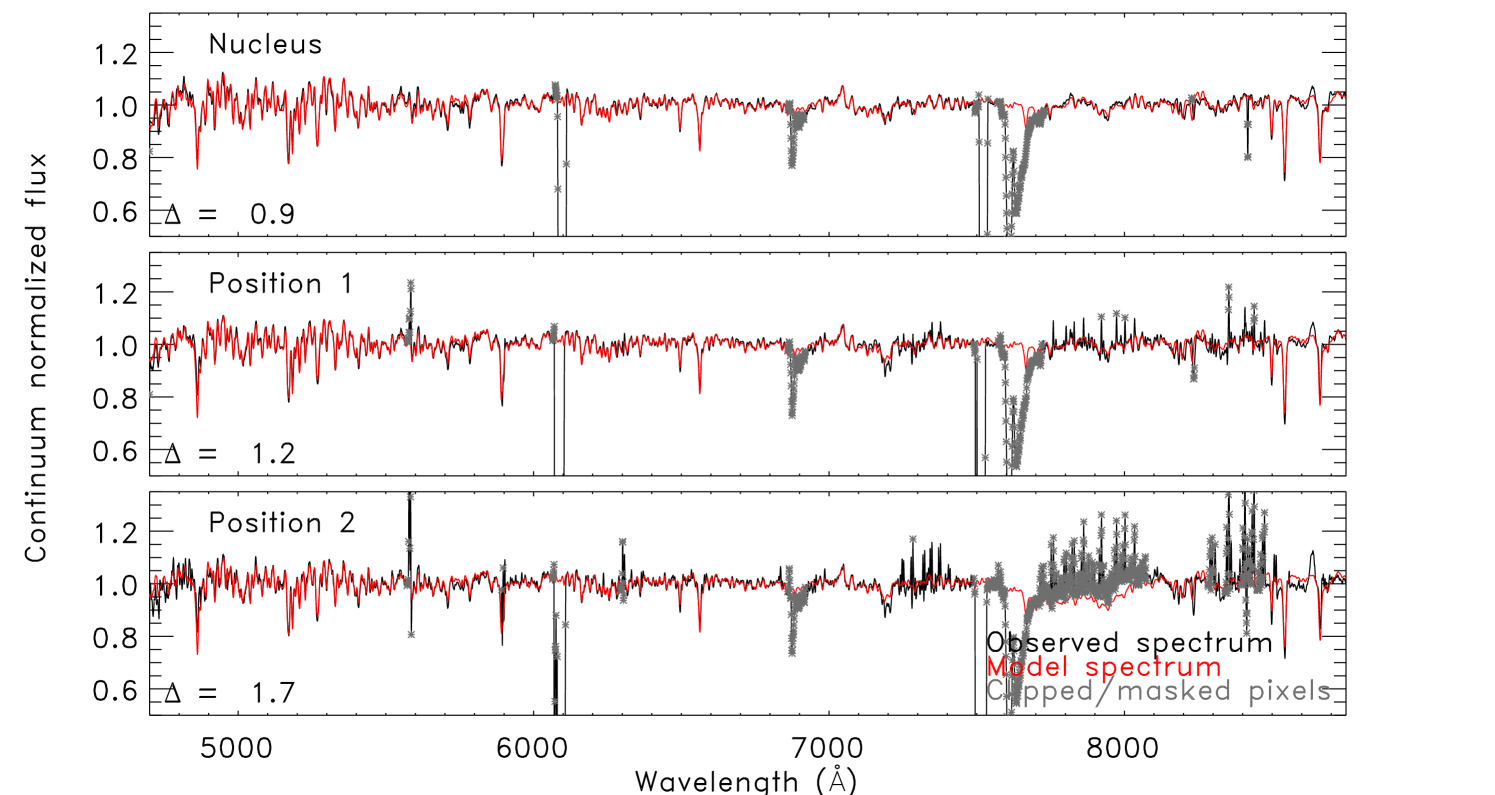
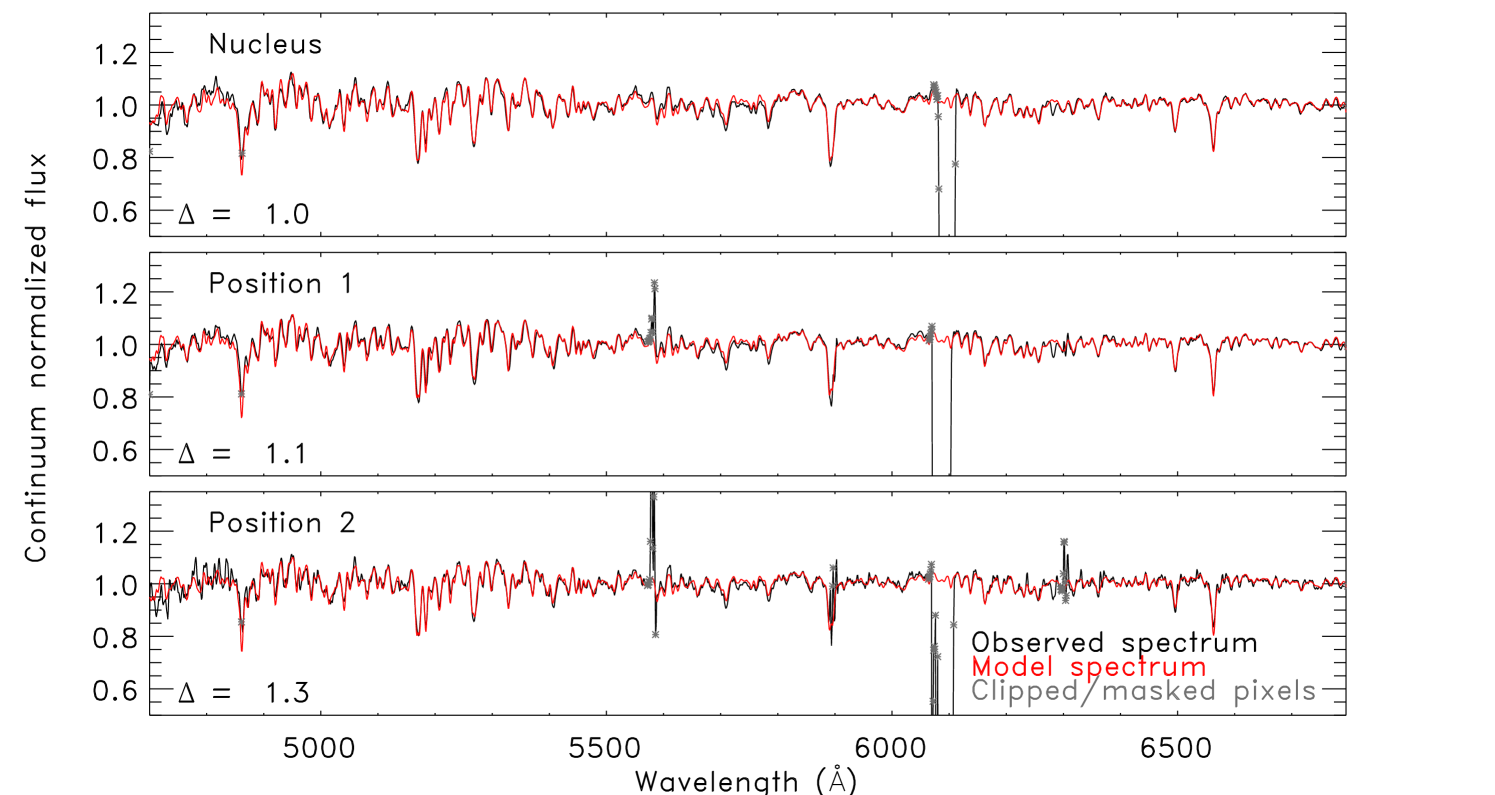
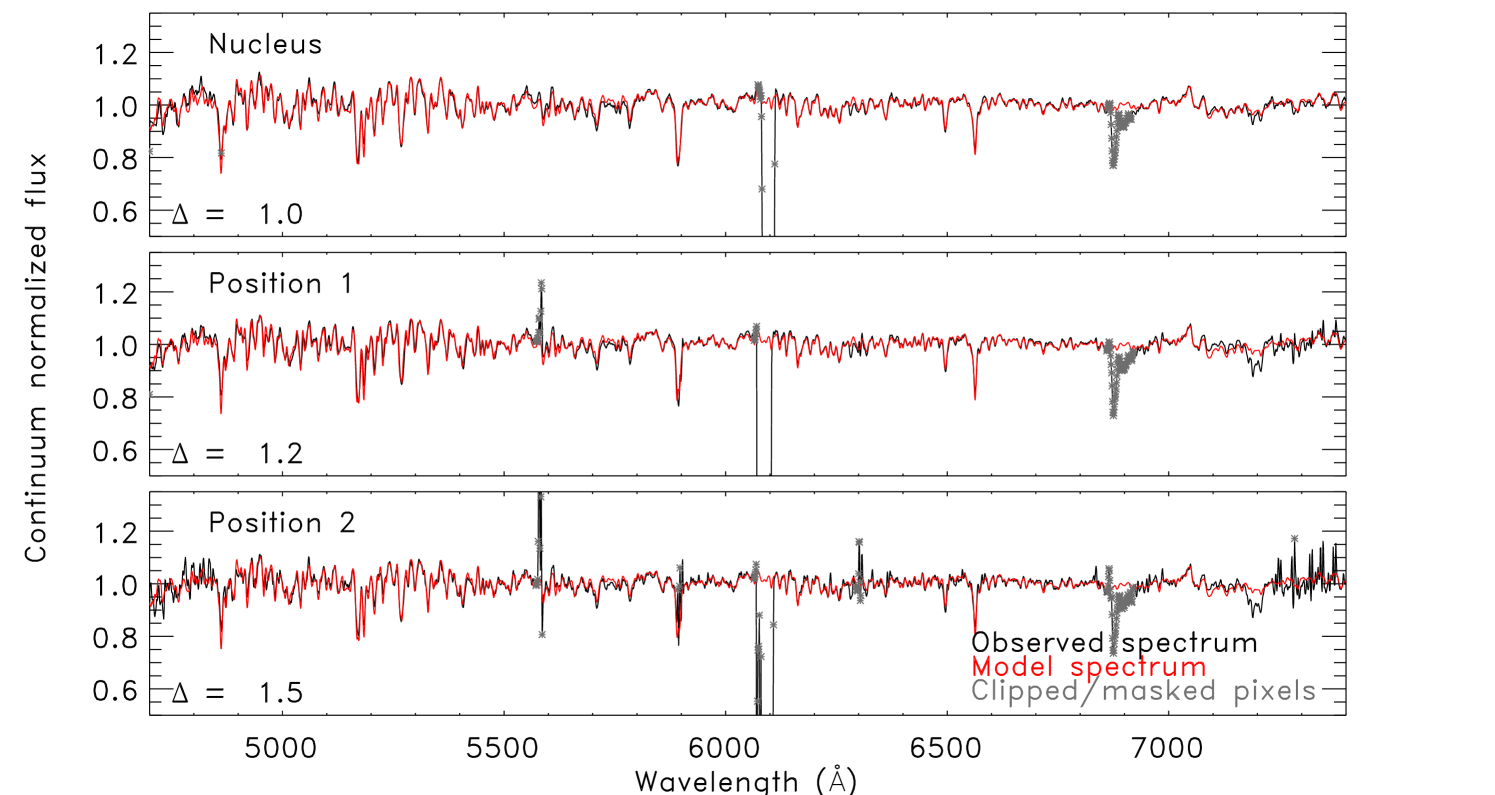
In total 48 starlight fits were performed (three galactic positions four exposures for each position four sets of base models). Examples of the fits performed by starlight are illustrated in Figures 2, 3 and 4 for the models BC03, Pegase-HR and Vazdekis et al. respectively. A measure of the quality of the fit is given by the average absolute deviation :
| (1) |
where N is the number of pixels, is the fitted spectrum and is the observed spectrum. Typically the model spectra reproduces the observed within 2 per cent of residual flux (see Table 2).
4 Results
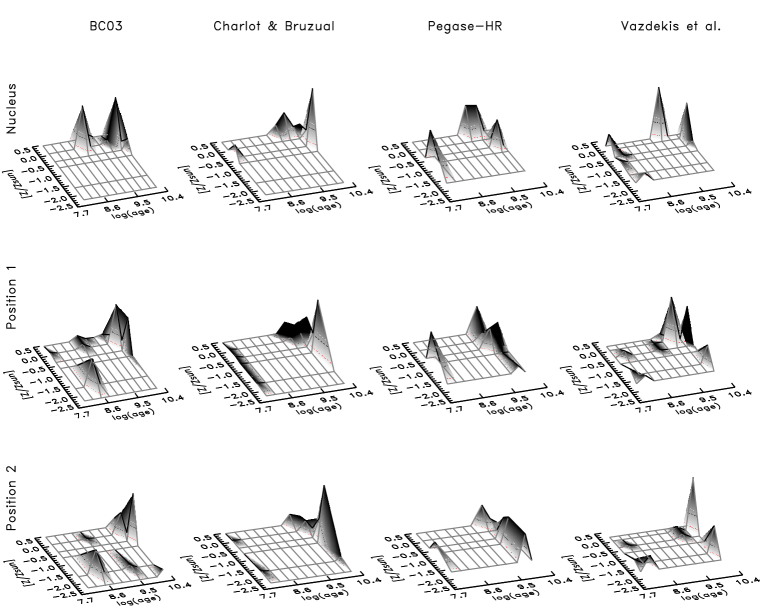
The analysis was performed with each observed spectrum individually, and the light-fraction vectors xj obtained by starlight were averaged over the four exposures for each combination of base models and radius. The results of xj are qualitatively shown in Fig. 5, as a function of log(age) and [Z/Z⊙], and in tabular form in the Appendix A. The projections of the averaged xj in the log(age) and planes give the age distribution functions (ADFs) and metallicity distribution functions (MDFs), shown in Figs 6 and 7, respectively.


It is worth remembering that the inversion from an observed spectrum to a set of parameters is a complex and degenerate problem, and we should avoid overdetailed descriptions of the population mixture (Ocvirk et al., 2006a). With that caveat in mind, we draw the following conclusions.
4.1 The distribution of ages
The age distribution has two to three peaks, depending on the base model. Signal of an ancient population [log(age) 10] is retrieved in all positions. Previous evidence of the ancient population were obtained from photometric studies, both for the central region (Brown et al., 2000, 2008) and the outer reaches of the galaxy, 3 arcmin away from the centre (Alonso-García et al., 2004).
Intermediate-age populations [log(age) between 9.0 and 9.9] are also always retrieved. Most of the previous spectral studies find a mean intermediate age for the population of M32 (e.g. Rose et al. 2005 find a SSP age between 4 and 7 Gyr, depending on the radius), and the existence of such population also has been supported by the photometric studies by Davidge & Jensen (2007) and references therein.
In many cases, the inversion algorithm retrieves small amounts of a young population [log(age) 9.0]), typically stronger in the runs with PEGASE-HR models. Rose et al. (2005) noted that a population in M32 cannot be any younger than 2 Gyr, or it would produce a strong signature in the Ca II index. As our spectrum does not extend blueward than 4800 Å, the Ca II region is not considered in the fit. The determination of ages in integrated spectra may be a difficult problem, as extended horizontal branch morphologies and/or blue stragglers, unaccounted for in the SSP models, can mimic young ages (de Freitas Pacheco & Barbuy, 1995; Maraston & Thomas, 2000; Trager et al., 2005). Interpretation of integrated globular cluster spectra from Schiavon et al. (2005) with STECMAP (STEllar Content via Maximum A Posteriori; Ocvirk et al., 2006a) supports the idea that blue HB stars in old metal-poor populations might appear as a spurious young burst of star formation (Koleva et al. 2007, 2008, Ocvirk, private communication). Hot HB stars in the central regions of M32 have been found by Brown et al. (2000), and thus it is possible that a least a fraction of the young population retrieved here is a signal of these hot old stars.
4.2 The distribution of abundances
The MDFs functions are smoother than the age distributions, with one or two peaks. In most of the cases, the peak of the metallicity distribution is centred at sub-solar values.
Position 2, the farthest from the nucleus, samples the same radius that was observed by Grillmair et al. (1996). The metallicity distribution obtained in that work is overplotted to our distributions as a dashed line in Fig. 7. Our results are in agreement with the conclusion by Grillmair et al. that the metallicity distribution in M32 is broad. On the other hand, they obtain a distribution which is poor in stars with [Z/Z⊙] 1. This is, in contrast, an important fraction in our mixtures regardless of the base models adopted.
Several effects may be hampering the comparison between the photometric and the spectroscopic metallicity distributions. The MDF by Grillmair et al. (1996) is based on the colour distribution of red giant branch (RGB) stars, and as such it is affected by observational errors and age effects (their distribution assumes a constant age of 10 Gyr). Furthermore, the set of underlying isochrones of the spectral models used by the present work (Bertelli et al., 1994; Girardi et al., 2000) is different from the isochrones used for the star counts in Grillmair et al. (Worthey et al., 1994). Moreover, the MDF by Grillmair et al. is in the form of number of stars per Z bin, i.e., N(Z)dZ, while ours is a light-fraction MDF, Ltot(Z)dZ. In a general case where Ltot is not constant with Z, then N(Z) and L(Z) are not the same, and one should not expect a perfect match. As pointed out by the anonymous referee, one might not expect an MDF derived from spectroscopic data to match an MDF derived from photometric data unless biases and observational errors are properly taken into account.
In the mixtures retrieved by our analysis, the metal-poor component corresponds to a population younger than the metal-rich one (according to Fig. 5 and Tables A1A9). It would be particularly puzzling if this trend is real, as it is in general expected that younger populations are formed from interstelar material already processed by older populations, and thus should be more metal-rich. On the other hand, in some cases this younger metal-poor population appears at the edges of the parameter space covered by the models, what might be an indication of an artefact effect.
4.3 Mean population parameters
The majority of the previous studies of M32 stellar populations publish the age and metallicities derived by the comparison to SSP models. Contrary to what is sometimes assumed, the SSP-equivalent ages and metallicities are not the same as the luminosity-weighted age and metallicites (see e.g. Trager et al., 2000; Walcher et al., 2006; Trager & Somerville, 2009).
We computed the luminosity-weighted parameters of our population mixtures by adopting:
| (2) |
and
| (3) |
where the vector xj gives the normalized light-fraction of the th SSP component of the model fit (). The SSP-equivalent parameters, on the other hand, are the age and metallicity of the th SSP which best fits the observed spectrum (smallest ).
We list both the luminosity-weighted and SSP-equivalent parameters in Table 2, derived independently from each of the four exposures. It can be seen that the difference from adopting distinct base models is larger than the variance of the starlight runs on the four exposures of each position.
| Light-weighted parameters | Best SSP fit parameters | ||||||
| Region | Obs # | Age[Gyr] | [Z/Z⊙] | [%] | Age[Gyr] | [Z/Z⊙] | [%] |
| BC03 | |||||||
| Nucleus | 1 | 4.0 | 0.12 | 0.93 | 3.2 | 0.07 | 0.94 |
| 2 | 4.5 | 0.09 | 0.98 | 3.2 | 0.07 | 0.98 | |
| 3 | 4.6 | 0.07 | 0.97 | 3.2 | 0.07 | 0.97 | |
| 4 | 4.1 | 0.12 | 1.00 | 3.2 | 0.07 | 1.00 | |
| Position 1 | 1 | 5.4 | -0.13 | 1.14 | 10.0 | -0.33 | 1.18 |
| 2 | 3.7 | -0.38 | 1.09 | 15.0 | -0.33 | 1.14 | |
| 3 | 3.8 | -0.45 | 1.14 | 15.0 | -0.33 | 1.20 | |
| 4 | 3.6 | -0.49 | 1.19 | 15.0 | -0.33 | 1.24 | |
| Position 2 | 1 | 7.8 | -0.55 | 2.11 | 10.0 | -0.33 | 2.13 |
| 2 | 4.6 | -0.65 | 1.51 | 5.5 | -0.33 | 1.52 | |
| 3 | 5.6 | -0.66 | 1.54 | 10.0 | -0.33 | 1.57 | |
| 4 | 4.6 | -0.63 | 1.65 | 10.0 | -0.33 | 1.65 | |
| Charlot & Bruzual | |||||||
| Nucleus | 1 | 6.1 | -0.05 | 0.89 | 5.5 | 0.07 | 0.95 |
| 2 | 6.4 | -0.03 | 0.94 | 5.5 | 0.07 | 0.99 | |
| 3 | 6.8 | -0.02 | 0.93 | 5.5 | 0.07 | 0.96 | |
| 4 | 6.3 | -0.04 | 0.96 | 5.5 | 0.07 | 1.00 | |
| Position 1 | 1 | 6.8 | -0.21 | 1.02 | 10.0 | -0.33 | 1.04 |
| 2 | 10.0 | -0.25 | 1.05 | 10.0 | -0.33 | 1.09 | |
| 3 | 11.7 | -0.26 | 1.01 | 10.0 | -0.33 | 1.04 | |
| 4 | 13.3 | -0.28 | 1.03 | 10.0 | -0.33 | 1.05 | |
| Position 2 | 1 | 11.5 | -0.49 | 1.93 | 10.0 | -0.33 | 1.95 |
| 2 | 10.8 | -0.30 | 1.33 | 5.5 | -0.33 | 1.35 | |
| 3 | 12.6 | -0.33 | 1.37 | 10.0 | -0.33 | 1.40 | |
| 4 | 12.8 | -0.37 | 1.45 | 5.5 | -0.33 | 1.49 | |
| Pegase-HR | |||||||
| Nucleus | 1 | 1.7 | -0.03 | 1.04 | 3.0 | 0.07 | 1.04 |
| 2 | 1.5 | -0.04 | 1.10 | 3.0 | 0.07 | 1.11 | |
| 3 | 2.0 | -0.03 | 1.07 | 3.0 | 0.07 | 1.07 | |
| 4 | 1.9 | -0.03 | 1.10 | 3.0 | 0.07 | 1.10 | |
| Position 1 | 1 | 3.6 | -0.37 | 1.13 | 6.0 | -0.33 | 1.18 |
| 2 | 1.7 | -0.25 | 1.11 | 6.0 | -0.33 | 1.13 | |
| 3 | 1.9 | -0.25 | 1.10 | 6.0 | -0.33 | 1.12 | |
| 4 | 2.0 | -0.25 | 1.13 | 6.0 | -0.33 | 1.15 | |
| Position 2 | 1 | 8.8 | -0.78 | 2.06 | 3.0 | -0.33 | 2.10 |
| 2 | 4.2 | -0.49 | 1.23 | 3.0 | -0.33 | 1.27 | |
| 3 | 4.7 | -0.52 | 1.28 | 3.0 | -0.33 | 1.32 | |
| 4 | 5.6 | -0.55 | 1.31 | 3.0 | -0.33 | 1.35 | |
| Vazdekis et al. | |||||||
| Nucleus | 1 | 2.3 | -0.02 | 0.97 | 3.2 | 0.05 | 0.97 |
| 2 | 2.4 | 0.02 | 1.01 | 3.2 | 0.05 | 1.02 | |
| 3 | 2.7 | -0.08 | 1.01 | 3.2 | 0.05 | 1.01 | |
| 4 | 2.5 | -0.01 | 1.04 | 3.2 | 0.05 | 1.04 | |
| Position 1 | 1 | 3.9 | -0.37 | 1.07 | 5.6 | -0.33 | 1.11 |
| 2 | 4.5 | -0.30 | 1.13 | 3.2 | 0.05 | 1.17 | |
| 3 | 5.0 | -0.30 | 1.15 | 3.2 | 0.05 | 1.18 | |
| 4 | 5.3 | -0.38 | 1.23 | 5.6 | -0.33 | 1.26 | |
| Position 2 | 1 | 4.3 | -0.68 | 1.95 | 5.6 | -0.33 | 1.99 |
| 2 | 5.2 | -0.53 | 1.39 | 3.2 | -0.33 | 1.38 | |
| 3 | 6.5 | -0.52 | 1.41 | 5.6 | -0.33 | 1.44 | |
| 4 | 8.0 | -0.58 | 1.52 | 10.0 | -0.63 | 1.52 | |
4.4 Evidence for gradients ?
Studies of radial colour and line strength gradients have led to discordant results in recent years (see discussion in Rose et al., 2005, and references therein). In the present work, we opted for maximising the S/N (a critical issue in spectral fitting technique, see e.g. Koleva et al., 2007), and thus we have not split our spectra in many apertures to perform a detailed gradient study. In general terms, it is possible to identify in our analysis a shift in the distribution of populations, in the sense that the fraction coming from an old population is higher in the outer regions than in the nucleus. In order to statistically address this issue, in Table 3 we show the light-weigthed parameters from Table 2 averaged on the four exposures, with their corresponding 1 uncertainties. A trend of higher ages and lower metallicities as one moves from the nucleus to position 2 can be seen in all cases, even though the gradient slopes are model-dependent.
| Region | Age (Gyr) | [Z/Z⊙] |
|---|---|---|
| BC03 | ||
| Nucleus | 4.3 0.3 | 0.1 0.1 |
| Position 1 | 4.1 0.9 | -0.4 0.2 |
| Position 2 | 5.7 1.5 | -0.6 0.1 |
| Charlot & Bruzual | ||
| Nucleus | 6.4 0.3 | 0.0 0.1 |
| Position 1 | 10.4 2.8 | -0.2 0.1 |
| Position 2 | 11.9 0.9 | -0.4 0.1 |
| Pegase-HR | ||
| Nucleus | 1.8 0.2 | 0.0 0.1 |
| Position 1 | 2.3 0.9 | -0.3 0.1 |
| Position 2 | 5.8 2.1 | -0.6 0.1 |
| Vazdekis et al. | ||
| Nucleus | 2.5 0.2 | 0.0 0.1 |
| Position 1 | 4.7 0.6 | -0.3 0.1 |
| Position 2 | 6.0 1.6 | -0.6 0.1 |
These findings supports one of the scenarios discussed by Rose et al. (2005), in which there is a shifting balance between the populations with radii. A recent burst of star-formation on top of an ancient population would appear as a higher concentration of a younger and more metal-rich population in the nucleus. This scenario would be a natural result of the model proposed by Bekki et al. (2001), in which centralised star formation in M32 is triggered by the tidal field of M31. On the other hand, HST near-ultraviolet (UV) imaging of M32 by Brown et al. (1998) reveals that the resolved UV-bright stars are more centrally concentrated than the underlying unresolved UV sources. Thus, it is also possible that the trend we see is a changing influence of a relatively small hot population prevalent in the nucleus. As the models do not yet consider hot stars in old populations, it is not possible with the present analysis to distinguish if it is the hot-old stars or the hot-young stars (or a combination of both) which is driving this balance shift.444Note added in proof: An alternative scenario to explain our findings is the one proposed recently by Kormendy et al. (2009). In this formation scenario, the young light in the centre would be the result of a starburst in the latest dissipative merger that made the galaxy. There is a gradual change as radius increases, towards larger contributions from older stars that formed before the most recent merger(s). In this scenario, the gradient would be therefore intrinsic to the formation process of M32, and not triggered by M31.
4.5 Dependence of the results with wavelength range
For the main fitting runs we opted for maximizing the use of information and thus to perform the fitting on the total wavelength range allowed by each set of spectral models. We additionally performed tests fitting only the region which is common to all base models (47006800 Å) and a limited region encompassing the most commonly used Lick/IDS (Lick Observatory Image Dissector Scanner) indices (48285363 Å, from H to Fe5335).
The results fitting only the region 47006800 Å are not strongly different from those obtained when fitting the whole range, except that lower weight is given to the old populations, and thus mean ages which are roughly 1 Gyr younger are derived. In the case of fitting the 48285363 Å region, the ages retrieved are slightly older in the nucleus but younger in the outer regions, and thus the gradient is flatter. The MDFs do not change significantly, except that the mean metallicity is slightly higher when only the 48285363 Å range is fitted.
The dependence of the results on wavelength range is an expected behavior for galaxies with star formation histories that are not well represented by a single burst (e.g. Sánchez-Blázquez et al., 2006b; Schiavon, 2007). Therefore, we favor the use of wide wavelength ranges in analyses that aim at studying composite stellar populations.
5 Summary and Conclusions
We obtained high S/N integrated spectra of the galaxy M32 with the GMOS at Gemini-North, out to 2 arcmin (3.6 ) from the centre of the galaxy. We performed an analysis of the composite stellar population in M32 using starlight by Cid Fernandes et al. (2005), a technique of full spectrum fitting, and adopting different sets of medium spectral resolution stellar population models: Bruzual & Charlot (2003), Le Borgne et al. (2004), Charlot & Bruzual (in prep.) and Vazdekis et al. (in prep.). Three different regions of the galaxy were analysed separately, the nuclear region, a region from 30 to 60 arcsec, and a region from 1 to 2 arcmin.
We can find mixtures of populations that reproduce our observed spectra within 2 per cent of residual flux. We find that in the nuclear region, 2365 per cent (depending on the model used) of the light at 5000 Å comes from an ancient population [older than log(age) = 10], and intermediate-age populations [log(age) between 9 and 9.9] contribute to 2548 per cent of the light. Beyond 1 (), the light coming from the ancient population increases (2790 per cent) and the contribution from intermediate-age populations decreases (441 per cent). There is a signal of a young-population [log(age) younger than 9.0] that contributes up to 30 per cent. As no evidence of such young population has been found by previous photometric and spectroscopic studies, it is likely that at least part of this populations is a spectral signal of the hot HB stars identified by Brown et al. (2000). These findings suggest that the lack of spectral population models accouting for these hot old stars may set a constraint in our ability to identify the detailed age distribution of a galaxy from its integrated spectrum.
The metallicity distribution is peaked at subsolar values, and we retrieve a non-negligible contribution from a metal-poor population with [Z/Z⊙] 1.0. Such metal-poor population has not been identified in the CMD analysis such as Grillmair et al. (1996). As our position 2 samples the same radius as the analysis by Grillmair et al., this disagreement between integrated light studies and resolved stellar studies has yet to be understood.
As the main result of the present analysis, we propose that an ancient and an intermediate-age population co-exist in M32, in agreement with the photometric evidence found by e.g. Brown et al. (2000); Alonso-García et al. (2004) (for an old population) and Davidge & Jensen (2007) (for an intermediate age population). Moreover, we propose that the balance between these two populations change from the nucleus to the halo (outside 1 ) in the sense that the contribution from the intermediate population is larger at the nuclear region.
More detailed descriptions of the age and metallicity distributions in M32 may have to wait for future stellar population models, as the balance of populations that fit our high-quality integrated spectra is model-dependent.
Acknowledgments: PC acknowledges the support of the European Community under a Marie Curie International Incoming Fellowship (6th Framework Programme, FP6), and of FAPESP (Fundação de Amparo à Pesquisa do Estado de São Paulo) under the Post-Doc Fellowship No 05/03840-3. This research has also been supported by FAPESP Projeto Temático No 06/56213-9. PC would like to thank G. Bruzual, S. Charlot and A. Vazdekis for kindly providing access to their new models prior to publication. The authors also would like to thank the anonymous referee for his/her much valuable comments.
References
- Alonso-García et al. (2004) Alonso-García J., Mateo M., Worthey G., 2004, AJ, 127, 868
- Asari et al. (2007) Asari N. V., Cid Fernandes R., Stasińska G., Torres-Papaqui J. P., Mateus A., Sodré L., Schoenell W., Gomes J. M., 2007, MNRAS, 381, 263
- Bekki et al. (2001) Bekki K., Couch W. J., Drinkwater M. J., Gregg M. D., 2001, ApJL, 557, L39
- Bender et al. (1992) Bender R., Burstein D., Faber S. M., 1992, ApJ, 399, 462
- Bertelli et al. (1994) Bertelli G., Bressan A., Chiosi C., Fagotto F., Nasi E., 1994, AAPS, 106, 275
- Bica et al. (1990) Bica E., Alloin D., Schmidt A. A., 1990, Astronomy and Astrophysics, 228, 23
- Brown et al. (2000) Brown T. M., Bowers C. W., Kimble R. A., Sweigart A. V., Ferguson H. C., 2000, ApJ, 532, 308
- Brown et al. (1998) Brown T. M., Ferguson H. C., Stanford S. A., Deharveng J.-M., 1998, ApJ, 504, 113
- Brown et al. (2008) Brown T. M., Smith E., Ferguson H. C., Sweigart A. V., Kimble R. A., Bowers C. W., 2008, ApJ, 682, 319
- Bruzual & Charlot (2003) Bruzual G., Charlot S., 2003, MNRAS, 344, 1000
- Cenarro et al. (2007) Cenarro A. J., Peletier R. F., Sánchez-Blázquez P., Selam S. O., Toloba E., Cardiel N., Falcón-Barroso J., Gorgas J., Jiménez-Vicente J., Vazdekis A., 2007, MNRAS, 374, 664
- Chabrier (2003) Chabrier G., 2003, ApJL, 586, L133
- Chilingarian et al. (2007) Chilingarian I., Cayatte V., Chemin L., Durret F., Laganá T. F., Adami C., Slezak E., 2007, A&A, 466, L21
- Choi et al. (2002) Choi P. I., Guhathakurta P., Johnston K. V., 2002, AJ, 124, 310
- Cid Fernandes et al. (2005) Cid Fernandes R., Mateus A., Sodré L., Stasińska G., Gomes J. M., 2005, MNRAS, 358, 363
- Coelho et al. (2007) Coelho P., Bruzual G., Charlot S., Weiss A., Barbuy B., Ferguson J. W., 2007, MNRAS, 382, 498
- Davidge (1990) Davidge T. J., 1990, AJ, 99, 561
- Davidge & Jensen (2007) Davidge T. J., Jensen J. B., 2007, AJ, 133, 576
- de Freitas Pacheco & Barbuy (1995) de Freitas Pacheco J. A., Barbuy B., 1995, A&A, 302, 718
- del Burgo et al. (2001) del Burgo C., Peletier R. F., Vazdekis A., Arribas S., Mediavilla E., 2001, MNRAS, 321, 227
- Freedman (1992) Freedman W. L., 1992, AJ, 104, 1349
- Gallagher et al. (2005) Gallagher J. S., Grebel E. K., Smith L. J., 2005, in Jerjen H., Binggeli B., eds, IAU Colloq. 198: Near-fields cosmology with dwarf elliptical galaxies Making compact elliptical satellite galaxies: a conceptual model for M32. pp 151–155
- Girardi et al. (2000) Girardi L., Bressan A., Bertelli G., Chiosi C., 2000, A&AS, 141, 371
- Graham (2002) Graham A. W., 2002, ApJL, 568, L13
- Grillmair et al. (1996) Grillmair C. J., Lauer T. R., Worthey G., Faber S. M., Freedman W. L., Madore B. F., Ajhar E. A., Baum W. A., Holtzman J. A., Lynds C. R., O’Neil Jr. E. J., Stetson P. B., 1996, AJ, 112, 1975
- Hardy et al. (1994) Hardy E., Couture J., Couture C., Joncas G., 1994, AJ, 107, 195
- Jones & Worthey (1995) Jones L. A., Worthey G., 1995, ApJL, 446, L31+
- Koleva et al. (2007) Koleva M., Bavouzet N., Chilingarian I., Prugniel P., 2007, in Kissler-Patig M., Walsh J. R., Roth M. M., eds, Science Perspectives for 3D Spectroscopy Validation of Stellar Population and Kinematical Analysis of Galaxies. p. 153
- Koleva et al. (2007) Koleva M., Prugniel P., Ocvirk P., Le Borgne D., 2007, in Vazdekis A., Peletier R. F., eds, IAU Symposium Vol. 241 of IAU Symposium, Age and metallicity of Galactic clusters from full spectrum fitting. pp 185–186
- Koleva et al. (2008) Koleva M., Prugniel P., Ocvirk P., Le Borgne D., Soubiran C., 2008, MNRAS, 385, 1998
- Le Borgne et al. (2004) Le Borgne D., Rocca-Volmerange B., Prugniel P., Lançon A., Fioc M., Soubiran C., 2004, A&A, 425, 881
- Magris & Bruzual (1993) Magris G., Bruzual G., 1993, ApJ, 417, 102
- Maraston & Thomas (2000) Maraston C., Thomas D., 2000, ApJ, 541, 126
- Mathis et al. (2006) Mathis H., Charlot S., Brinchmann J., 2006, MNRAS, 365, 385
- Mieske et al. (2005) Mieske S., Infante L., Hilker M., Hertling G., Blakeslee J. P., Benítez N., Ford H., Zekser K., 2005, A&A, 430, L25
- Nieto & Prugniel (1987) Nieto J.-L., Prugniel P., 1987, A&A, 186, 30
- Oconnell (1980) Oconnell R. W., 1980, ApJ, 236, 430
- Ocvirk et al. (2006a) Ocvirk P., Pichon C., Lançon A., Thiébaut E., 2006a, MNRAS, 365, 74
- Ocvirk et al. (2006b) Ocvirk P., Pichon C., Lançon A., Thiébaut E., 2006b, MNRAS, 365, 46
- Panter et al. (2003) Panter B., Heavens A. F., Jimenez R., 2003, MNRAS, 343, 1145
- Rose (1985) Rose J. A., 1985, AJ, 90, 1927
- Rose (1994) Rose J. A., 1994, AJ, 107, 206
- Rose et al. (2005) Rose J. A., Arimoto N., Caldwell N., Schiavon R. P., Vazdekis A., Yamada Y., 2005, AJ, 129, 712
- Salpeter (1955) Salpeter E. E., 1955, ApJ, 121, 161
- Sánchez-Blázquez et al. (2006a) Sánchez-Blázquez P., Gorgas J., Cardiel N., González J. J., 2006a, A&A, 457, 787
- Sánchez-Blázquez et al. (2006b) Sánchez-Blázquez P., Gorgas J., Cardiel N., González J. J., 2006b, A&A, 457, 809
- Schiavon (2007) Schiavon R. P., 2007, ApJS, 171, 146
- Schiavon et al. (2004) Schiavon R. P., Caldwell N., Rose J. A., 2004, AJ, 127, 1513
- Schiavon et al. (2005) Schiavon R. P., Rose J. A., Courteau S., MacArthur L. A., 2005, ApJS, 169, 163
- Schmidt et al. (1989) Schmidt A., Bica E., Dottori H., Alloin D., 1989, Astrophysics and Space Science, 157, 79
- Trager et al. (2000) Trager S. C., Faber S. M., Worthey G., González J. J., 2000, AJ, 120, 165
- Trager & Somerville (2009) Trager S. C., Somerville R. S., 2009, ArXiv e-prints
- Trager et al. (2005) Trager S. C., Worthey G., Faber S. M., Dressler A., 2005, MNRAS, 362, 2
- Vazdekis (1999) Vazdekis A., 1999, ApJ, 513, 224
- Vazdekis & Arimoto (1999) Vazdekis A., Arimoto N., 1999, ApJ, 525, 144
- Walcher et al. (2006) Walcher C. J., Böker T., Charlot S., Ho L. C., Rix H.-W., Rossa J., Shields J. C., van der Marel R. P., 2006, ApJ, 649, 692
- Wolf et al. (2007) Wolf M. J., Drory N., Gebhardt K., Hill G. J., 2007, ApJ, 655, 179
- Worthey (1994) Worthey G., 1994, ApJS, 95, 107
- Worthey (2004) Worthey G., 2004, AJ, 128, 2826
- Worthey et al. (1994) Worthey G., Faber S. M., Gonzalez J. J., Burstein D., 1994, ApJS, 94, 687
- Worthey et al. (2004) Worthey G., Mateo M., Alonso-García J., España A. L., 2004, PASP, 116, 295
- Young et al. (2008) Young C. K.-s., Currie M. J., Dickens R. J., Luo A.-L., Zhang T.-J., 2008, Chinese Journal of Astronomy and Astrophysics, 8, 369
- Ziegler & Bender (1998) Ziegler B. L., Bender R., 1998, A&A, 330, 819
Appendix A Results
Population mixtures obtained for each set of SSP models, averaged on the four exposures (Tables A1A12).
| [Z/H] | 2.23 | 1.63 | 0.63 | 0.33 | 0.07 | 0.47 |
|---|---|---|---|---|---|---|
| log(age) | ||||||
| 8.00 | 0 | 0 | 0 | 0 | 0 | 0 |
| 8.25 | 0 | 0 | 0 | 0 | 0 | 0 |
| 8.50 | 0 | 0 | 0 | 0 | 0 | 0 |
| 8.75 | 0 | 0 | 0 | 0 | 0 | 0 |
| 9.00 | 0 | 0 | 0 | 0 | 36 | 0 |
| 9.25 | 0 | 0 | 0 | 0 | 0 | 5 |
| 9.50 | 0 | 0 | 0 | 0 | 0 | 0 |
| 9.75 | 0 | 0 | 0 | 0 | 3 | 0 |
| 10.00 | 0 | 0 | 0 | 0 | 38 | 0 |
| 10.18 | 0 | 0 | 0 | 9 | 0 | 10 |
| [Z/H] | 2.23 | 1.63 | 0.63 | 0.33 | 0.07 | 0.47 |
|---|---|---|---|---|---|---|
| log(age) | ||||||
| 8.00 | 0 | 0 | 0 | 0 | 2 | 0 |
| 8.25 | 0 | 0 | 0 | 0 | 0 | 0 |
| 8.50 | 0 | 23 | 0 | 0 | 0 | 0 |
| 8.75 | 0 | 0 | 0 | 0 | 0 | 0 |
| 9.00 | 0 | 0 | 0 | 0 | 4 | 4 |
| 9.25 | 0 | 0 | 0 | 0 | 0 | 0 |
| 9.50 | 0 | 0 | 0 | 0 | 0 | 0 |
| 9.75 | 0 | 0 | 0 | 0 | 0 | 1 |
| 10.00 | 0 | 0 | 0 | 0 | 32 | 0 |
| 10.18 | 0 | 0 | 0 | 26 | 1 | 7 |
| [Z/H] | 2.23 | 1.63 | 0.63 | 0.33 | 0.07 | 0.47 |
|---|---|---|---|---|---|---|
| log(age) | ||||||
| 8.00 | 0 | 0 | 0 | 0 | 0 | 0 |
| 8.25 | 0 | 0 | 0 | 0 | 0 | 0 |
| 8.50 | 0 | 21 | 0 | 0 | 0 | 0 |
| 8.75 | 0 | 0 | 0 | 0 | 0 | 0 |
| 9.00 | 0 | 0 | 0 | 0 | 1 | 0 |
| 9.25 | 0 | 0 | 0 | 0 | 0 | 0 |
| 9.50 | 0 | 3 | 0 | 0 | 0 | 0 |
| 9.75 | 0 | 0 | 0 | 0 | 0 | 0 |
| 10.00 | 0 | 0 | 0 | 0 | 19 | 8 |
| 10.18 | 6 | 0 | 0 | 42 | 0 | 0 |
| [Z/H] | 2.23 | 1.63 | 0.63 | 0.33 | 0.07 | 0.47 |
|---|---|---|---|---|---|---|
| log(age) | ||||||
| 8.00 | 0 | 0 | 0 | 11 | 0 | 0 |
| 8.25 | 0 | 0 | 0 | 0 | 0 | 0 |
| 8.50 | 0 | 0 | 0 | 0 | 0 | 0 |
| 8.75 | 0 | 0 | 0 | 0 | 0 | 0 |
| 9.00 | 0 | 0 | 0 | 0 | 0 | 0 |
| 9.25 | 0 | 0 | 0 | 0 | 0 | 0 |
| 9.50 | 0 | 0 | 0 | 0 | 0 | 8 |
| 9.75 | 0 | 0 | 0 | 0 | 0 | 17 |
| 10.00 | 0 | 0 | 0 | 0 | 0 | 4 |
| 10.18 | 0 | 0 | 0 | 49 | 7 | 5 |
| [Z/H] | 2.23 | 1.63 | 0.63 | 0.33 | 0.07 | 0.47 |
|---|---|---|---|---|---|---|
| log(age) | ||||||
| 8.00 | 0 | 1 | 1 | 2 | 1 | 0 |
| 8.25 | 0 | 0 | 0 | 0 | 0 | 0 |
| 8.50 | 0 | 0 | 0 | 0 | 0 | 0 |
| 8.75 | 0 | 0 | 0 | 0 | 0 | 0 |
| 9.00 | 0 | 0 | 0 | 0 | 0 | 0 |
| 9.25 | 0 | 0 | 0 | 0 | 0 | 0 |
| 9.50 | 0 | 0 | 0 | 0 | 0 | 0 |
| 9.75 | 0 | 0 | 0 | 0 | 2 | 9 |
| 10.00 | 0 | 0 | 0 | 0 | 5 | 5 |
| 10.18 | 0 | 0 | 44 | 11 | 18 | 0 |
| [Z/H] | 2.23 | 1.63 | 0.63 | 0.33 | 0.07 | 0.47 |
|---|---|---|---|---|---|---|
| log(age) | ||||||
| 8.00 | 0 | 1 | 0 | 0 | 1 | 0 |
| 8.25 | 0 | 0 | 0 | 0 | 0 | 0 |
| 8.50 | 0 | 0 | 0 | 0 | 0 | 0 |
| 8.75 | 0 | 0 | 0 | 0 | 0 | 0 |
| 9.00 | 0 | 0 | 0 | 0 | 0 | 0 |
| 9.25 | 0 | 0 | 0 | 0 | 0 | 0 |
| 9.50 | 0 | 0 | 0 | 0 | 0 | 0 |
| 9.75 | 0 | 0 | 0 | 0 | 0 | 9 |
| 10.00 | 0 | 0 | 0 | 0 | 9 | 7 |
| 10.18 | 0 | 4 | 52 | 17 | 1 | 0 |
| [Z/H] | 1.63 | 0.63 | 0.33 | 0.07 | 0.47 |
|---|---|---|---|---|---|
| log(age) | |||||
| 8.00 | 0 | 29 | 0 | 0 | 0 |
| 8.25 | 0 | 0 | 0 | 0 | 0 |
| 8.50 | 0 | 0 | 0 | 0 | 0 |
| 8.75 | 0 | 0 | 0 | 0 | 0 |
| 9.00 | 0 | 0 | 0 | 0 | 0 |
| 9.25 | 0 | 0 | 0 | 0 | 0 |
| 9.50 | 0 | 0 | 0 | 0 | 25 |
| 9.75 | 0 | 0 | 0 | 0 | 23 |
| 10.00 | 0 | 0 | 23 | 0 | 0 |
| 10.18 | 0 | 0 | 0 | 0 | 0 |
| [Z/H] | 1.63 | 0.63 | 0.33 | 0.07 | 0.47 |
|---|---|---|---|---|---|
| log(age) | |||||
| 8.00 | 0 | 28 | 3 | 0 | 0 |
| 8.25 | 0 | 0 | 0 | 0 | 0 |
| 8.50 | 0 | 0 | 0 | 0 | 0 |
| 8.75 | 0 | 0 | 0 | 0 | 0 |
| 9.00 | 0 | 0 | 0 | 0 | 0 |
| 9.25 | 0 | 0 | 0 | 0 | 0 |
| 9.50 | 0 | 0 | 0 | 0 | 0 |
| 9.75 | 0 | 0 | 17 | 6 | 22 |
| 10.00 | 6 | 0 | 21 | 0 | 0 |
| 10.18 | 0 | 0 | 0 | 0 | 0 |
| [Z/H] | 1.63 | 0.63 | 0.33 | 0.07 | 0.47 |
|---|---|---|---|---|---|
| log(age) | |||||
| 8.00 | 0 | 11 | 0 | 0 | 0 |
| 8.25 | 0 | 0 | 0 | 0 | 0 |
| 8.50 | 0 | 0 | 0 | 0 | 0 |
| 8.75 | 0 | 0 | 0 | 0 | 0 |
| 9.00 | 0 | 0 | 0 | 0 | 0 |
| 9.25 | 0 | 0 | 0 | 0 | 0 |
| 9.50 | 0 | 0 | 0 | 0 | 0 |
| 9.75 | 0 | 0 | 0 | 0 | 17 |
| 10.00 | 25 | 24 | 19 | 0 | 4 |
| 10.18 | 0 | 0 | 0 | 0 | 0 |
| [Z/H] | 1.63 | 1.23 | 0.63 | 0.33 | 0.05 | 0.25 |
|---|---|---|---|---|---|---|
| log(age) | ||||||
| 8.00 | 0 | 0 | 3 | 0 | 13 | 0 |
| 8.25 | 7 | 0 | 0 | 0 | 0 | 0 |
| 8.50 | 0 | 0 | 0 | 0 | 0 | 0 |
| 8.75 | 0 | 0 | 0 | 0 | 0 | 0 |
| 9.00 | 0 | 0 | 0 | 0 | 0 | 0 |
| 9.25 | 0 | 0 | 0 | 0 | 0 | 0 |
| 9.50 | 0 | 0 | 0 | 0 | 0 | 43 |
| 9.75 | 0 | 0 | 0 | 0 | 0 | 0 |
| 10.00 | 0 | 0 | 0 | 0 | 0 | 0 |
| 10.18 | 0 | 0 | 0 | 4 | 29 | 0 |
| [Z/H] | 1.63 | 1.23 | 0.63 | 0.33 | 0.05 | 0.25 |
|---|---|---|---|---|---|---|
| log(age) | ||||||
| 8.00 | 0 | 6 | 0 | 0 | 0 | 0 |
| 8.25 | 6 | 0 | 0 | 5 | 0 | 0 |
| 8.50 | 0 | 0 | 0 | 0 | 0 | 0 |
| 8.75 | 0 | 0 | 0 | 0 | 0 | 0 |
| 9.00 | 0 | 0 | 0 | 0 | 0 | 0 |
| 9.25 | 0 | 0 | 0 | 1 | 0 | 0 |
| 9.50 | 0 | 0 | 0 | 0 | 0 | 4 |
| 9.75 | 0 | 0 | 0 | 0 | 36 | 0 |
| 10.00 | 0 | 0 | 0 | 0 | 0 | 0 |
| 10.18 | 0 | 15 | 0 | 0 | 27 | 0 |
| [Z/H] | 1.63 | 1.23 | 0.63 | 0.33 | 0.05 | 0.25 |
|---|---|---|---|---|---|---|
| log(age) | ||||||
| 8.00 | 0 | 5 | 0 | 0 | 0 | 0 |
| 8.25 | 14 | 0 | 0 | 1 | 0 | 0 |
| 8.50 | 0 | 0 | 0 | 0 | 0 | 0 |
| 8.75 | 0 | 0 | 0 | 0 | 0 | 0 |
| 9.00 | 0 | 0 | 0 | 0 | 0 | 0 |
| 9.25 | 0 | 0 | 0 | 0 | 0 | 0 |
| 9.50 | 0 | 0 | 0 | 0 | 0 | 0 |
| 9.75 | 0 | 0 | 0 | 4 | 5 | 0 |
| 10.00 | 0 | 0 | 0 | 0 | 0 | 0 |
| 10.18 | 0 | 25 | 0 | 0 | 47 | 0 |