Spectral properties of gas-phase condensed fullerene-like carbon nanoparticles from far-ultraviolet to infrared wavelengths
Abstract
Carbon solids are ubiquitous material in the interstellar space. However, the formation pathway of carbonaceous matter in astrophysical environments as well as in terrestrial gas-phase condensation reactions is not yet understood. Laser ablation of graphite in different quenching gas atmospheres such as pure He, He/H2, and He/H2O at varying pressures is used to synthesize very small, fullerene-like carbon nanoparticles. The particles are characterized by very small diameters between 1 and 4 nm and a disturbed onion-like structure. The soot particles extracted from the condensation zone obviously represent a very early stage of particle condensation. The spectral properties have been measured from the far-ultraviolet (FUV) (=120 nm) to the mid-infrared (MIR) (=15 m). The seed-like soot particles show strong absorption bands in the 3.4 m range. The profile and the intensity pattern of the 3.4 m band of the diffuse interstellar medium can be well reproduced by the measured 3.4 m profile of the condensed particles, however, all the carbon which is left to form solids is needed to fit the intensity of the interstellar bands. In contrast to the assumption that onion-like soot particles could be the carrier of the interstellar ultraviolet (UV) bump, our very small onion-like carbon nanoparticles do not show distinct UV bands due to (*) transitions.
Subject headings:
astrochemistry; methods: laboratory; technique: spectroscopic; (ISM:) dust, extinction; AGB and post AGB stars1. Introduction
The interstellar extinction law contains a number of, more or less, strong spectral features which are attributed to absorption bands of different organic and inorganic dust materials (Henning & Salama, 1998; Henning et al., 2004). Unfortunately, the identification of most of these features remained uncertain. The strongest extinction feature at a wavelength of 217.5 nm (for reviews see Henning & Schnaiter (1998); Fitzpatrick (1999)), which corresponds to an oscillator strength per H nucleus of f 9.310-6 must be caused by a relatively abundant dust material composed of the most abundant elements in space, like carbon, silicon, oxygen, iron, and magnesium. In the diffuse interstellar medium, the position of the 217 nm absorption is remarkably invariant for different lines of sight, but the width of the peak varies by around 25 %. Carbonaceous material containing single and double bonds can show electronic transitions in the UV. Based on calculations of the spectral properties from the optical constants of bulk graphite, a first assignment of the UV bump carrier to small nano-sized graphite particles has been suggested by Stecher & Donn (1965). However, in the laboratory, nano-sized graphite grains with a very definite graphite structure could not be observed (Huffman, 1975, 1988). Even though there were some concepts to attribute the feature to small PAHs or mixtures of large PAHs (Donn, 1968; Joblin et al., 1992; Beegle et al., 1997), solid carbon grains showing disordered internal structures accompanied by a degree of hydrogenation are generally accepted as the best candidates for band carriers (Mennella et al., 1996; Duley & Seahra, 1998; Schnaiter et al., 1998; Mennella et al., 1999). More recently, carbon onions have been proposed as band carriers of the UV bump by different authors (Wright, 1988; Wada et al., 1999; Tomita et al., 2002; Chhowalla et al., 2003). However, most of the proposed laboratory analogs show deviations of their UV band positions compared to the interstellar UV bump.
The ”original” carbon dust is being formed in the envelopes of carbon-rich late-type stars as nanometer-sized particles (Dorschner & Henning, 1995; Waters, 2004; Andersen et al., 2003; Kwok, 2004), but the 217 nm band has never been detected in these objects. However, observations of these stars in the UV range are rather limited since such stars are too cool to be observable in this range. Post AGB stars and planetary nebulae are generally brighter in the UV, however, the spectral change of the IR features from the post AGB to the planetary nebulae stage points to a chemical and structural alteration accompanied by an aromatization process of the carbonaceous dust (Hony et al., 2003). The hydrogen-rich object HD 89353, that has been identified as a post AGB star, does not show a UV band (Buss et al., 1993), which could be a hint for the existence of hydrogenated amorphous carbon material (HACs) (Muci et al., 1994). In hydrogen-poor objects including post AGB stars (Buss et al., 1989), planetary nebulae (Greenstein, 1994), and R Coronae Borealis variable stars (Drilling & Schönberner, 1989; Drilling et al., 1997), UV bands between 230 and 250 nm were observed, which are typical of rather graphitized carbonaceous material (Muci et al., 1994). The UV spectrum recorded for the post AGB star HD 44179 recently presented by Vijh et al. (2005b) do also not show a 217.5 nm absorption peak but, instead, a very broad hump with a maximum near 200 nm (5 m-1). These observational facts indicate that a chemical or physical processing of the condensed carbon particles has to occur during the transfer from the circumstellar shells to the diffuse interstellar medium or during their stay in this medium.
Generally, carbon nanoparticle composites (soot) consist of primary particles with average particle sizes between a few and approximately 100 nm depending on the mechanism of formation. The structure of the primary particles is complex and must be explained on an atomic scale as well as on a mesoscopic scale (short-range and medium-range order). Carbon atoms can form different types of hybridization, sp, sp2, sp3, and also mixtures of them which determine the kind of bondings between the C-atoms and possible heteroatoms such as oxygen. There are various models (Heidenreich et al., 1968; Hess & Herd, 1993) for the description of the internal structure of soot particles on a mesoscopic scale. These models are mainly based on the assumption that the structure-forming units of carbon nanoparticles consist of very small crystalline, turbostratic graphitic regions, the ”Basic Structural Units” (BSU) (Oberlin, 1990). If the sample becomes more amorphous, the number of stacked layers decreases until only one layer is left. Simultaneously, the number of condensed rings in the plane also decreases, which means that the crystallite sizes in c- and also in a-direction are reduced. A more recent model for the description of the internal structure of carbon black particles is the paracrystalline model (Hess & Herd, 1993) which predicts strongly disturbed and bent, concentrically arranged, graphene layers.
During the last few years, many more structures of primary soot particles have been detected in the laboratory, including nanotubes and more or less perfectly formed onion-like particles (Henning et al., 2004). In these particles, the deviation from the plane structure of the graphene layers is clearly visible and correlated with the formation of mixed hybridization states. Haddon (1993) investigated the correlation between the s-character of the bonding which describes the deviation from the planar symmetry and therefore the strength ratio between the and bonds and the state of curvature of graphene layers. The author found that the hybridization of carbon atoms in bent layers increases to values between 2.0 and 2.278. The latter is the hybridization value of C60.
The UV absorption of carbon nanoparticles is caused by electronic transitions between the bonding and antibonding orbitals (Green et al., 1990). The (–*) transitions are expected to produce a band in the far UV peaking between 60 and 100 nm, whereas the (–*) transitions are providing an absorption maximum located in the range between 180 and 280 nm. The incorporation of hydrogen into the internal structure of carbon black leads to an increase of the fraction of sp3 hybridized carbon. The position of the (–*) transition is extremely sensitive to very small changes of the preparation conditions, which correspond to small variations in the internal electronic structure of the carbon nanoparticles (Robertson & O’Reilly, 1987; Michel et al., 1999). There has been only a limited number of systematic experimental investigations on the relation between the internal structure and their UV absorption behavior (Jäger et al., 1999; Llamas-Jansa et al., 2007). The width of the peak depends also on the state of agglomeration (Rouleau et al., 1997; Schnaiter et al., 1998).
A significant property of carbon soot is the hydrogen content which, on the one hand, influences the internal structure of the grains, and on the other hand, permits the observability in the infrared (IR) range. The incorporation of hydrogen into the carbon structure can induce a reduction of the mean graphene layer length that can be accompanied by an increase of sp3 hybridization of carbon atoms. Hydrogen bound to carbon atoms occurs in different functional groups such as in CH, in aromatic or aliphatic =C–H, or in saturated aliphatic –CH3, –CH2, or –CH groups. Aromatic =C–H groups can be observed mainly at 3.3, 8.6, and between 11 and 14.3 m, whereas the diagnostically relevant aliphatic –CHx groups mainly absorb around 3.4, 6.9, and 7.25 m. There are additional IR bands of these groups at smaller wavelengths, but they occur in IR ranges where other groups like –C–C–, –C=C–, C–OH, and –C–O–C– also absorb and thus prevent a discrimination and identification of individual peaks. Macroscopic properties like shape, size, and agglomeration state influence the long-wavelength tail of the FIR absorption (Stognienko et al., 1995; Michel, 1995; Jäger et al., 1998; Quinten et al., 2002).
The IR bands of hydrogen-containing functional groups have a high diagnostic importance since they trace the processing of the solid-state organic carbon components in different astronomical environments. Aromatic and aliphatic IR bands preferentially caused by varying C–H groups can be observed in the IR spectra of post AGB stars and protoplanetary nebulae (Kwok et al., 2001; Hony et al., 2003; Hrivnak et al., 2007; Goto et al., 2008) pointing to a mixture of both components in such objects. In contrast, planetary nebulae only show aromatic IR bands which can be explained by a complete aromatization of the material. Further chemical alteration of the carbonaceous material can be observed in the diffuse interstellar medium (DISM) where only a strong absorption band at 3.4 m appears. A detailed analysis of the DISM in the IR range between 2.5 and 10 m has been performed by Pendleton & Allamandola (2002). From the spectral signatures, they derived a mean composition of the interstellar carbon material in the DISM characterized by a hydrocarbon which contains only little nitrogen or oxygen and which is composed of aromatic and aliphatic forms. The authors have shown that the 3.4 m IR band of different carbonaceous dust analogs indicates a remarkable similarity to the 3.4 m IR profile of the DISM. The hydrogenated amorphous carbon materials produced by resistive heating of carbon rods in He/H2 atmospheres (Schnaiter et al., 1998), by laser-ablated carbon rods and subsequent hydrogenation (Mennella et al., 1999), and by plasma-enhanced chemical vapor deposition of methane (Furton et al., 1999) were found to yield the best agreement with the observational data and to satisfy all spectroscopic criteria for the comparison. However, the spectral coincidence of the interstellar 3.4 m bands with that of a carbonaceous dust analog is not sufficient for the identification of the interstellar carbon dust component. The intensity of the IR band is also a crucial factor for an exact identification. Furton et al. (1999) and Mennella et al. (2002) demonstrated that a relevant carbonaceous dust analog must have a mass absorption coefficient at 3.42 m of not less than 1400 cm2g-1 to reproduce the intensity of the interstellar 3.4 m bands. For such a material, around 80 ppm of the interstellar carbon relative to hydrogen is required which is just the amount of carbon that is left for the formation of solid carbonaceous dust materials (Snow & Witt, 1995, 1996). Carbonaceous materials with values larger than 1400 cm2g-1 could match the intensity of the interstellar 3.4 m band with less than 80 ppm carbon. However, Furton et al. (1999) stressed that carbon materials with much higher hydrogen content should exhibit blue-green photoluminescence. Indeed, blue luminescence was discovered in a proto planetary nebula, the Red Rectangle (RR), surrounding the post-AGB star HD44179 and it was attributed to fluorescence of small, neutral PAHs containing 3–4 rings (Vijh et al., 2004, 2005b). It was assumed that the small molecules were shielded from the harsh interstellar radiation by a dense circumstellar disk which enabled their survival. Later, blue luminescence was detected in several reflection nebulae illuminated by stars having temperatures between 10 000 and 23 000 K and showing aromatic IR emission features (Vijh et al., 2005a).
Gas-phase condensation in the laboratory is a process which is similar to the astrophysical condensation process of particles in late-type stars. The evaporation of the graphite by laser ablation leads to the formation of small carbon clusters which can react with hydrogen atoms in the quenching gas atmosphere to form hydrocarbon molecules and solid hydrocarbons.
Condensation temperatures and pressures in circumstellar environments are rather uncertain. Generally, temperature-pressure profiles for carbon stars are difficult to obtain and depend on various model assumptions, for instance, mass loss rates, gas density outflow velocity, and dust formation. Pulsations of the helium burning shells affect the atmospheres and can cause shock fronts which result in density/pressure fluctuations (Nowotny et al., 2005). Recent modelings of AGB star atmospheres give pressures between 1 and 800 dynes/cm2 (110-6–0.8 mbar) for stars with an effective temperature of 4000 K (Lederer et al., 2006).
In condensation calculations, the pressure in the condensation zone is assumed to be between 10 and 3103 dynes/cm2 (0.01-3 mbar) (Lodders & Fegley, 1995). The authors modeled condensation sequences for C-rich circumstellar envelopes and demonstrated that, for graphite, the condensation temperature is not very sensitive to the pressure but to the C/O ratio. At a C/O ratio of 2 (for example valid in IRC+10216) and a pressure larger than 3 mbar, TiC condenses prior to graphite as it was found in meteoritic grains. At smaller C/O ratios, this condensation sequence is found at lower pressures (between 0.003 and 0.3 mbar) (Lodders & Fegley, 1999). The coincidence between the calculated and experimentally found condensation sequences can confirm the assumed condensation conditions and pressure ranges.
In this paper, we present an investigation of the internal structure of carbon nanopowder, produced by laser ablation and extracted from the reaction zone in a very early state of condensation, in relation to its spectral behavior from the FUV up to the IR. Pulsed laser ablation and condensation of particles in a quenching gas atmosphere can be considered as a high-temperature condensation process that can be employed to produce carbon nanoparticles built of strongly bent graphene layers which is comparable to a defective onion structure. Defective onion particles were supposed to have special spectral properties and were discussed as possible carriers of the interstellar extinction bump (Henning et al., 2004; Tomita et al., 2002). Therefore, such particles are of great interest as laboratory dust analogs. In order to study the influence of hydrogen on the structure of the fullerene-like particles and on the spectral properties of these materials, we have varied the hydrogen content in the carbon particles. The understanding of the spectral properties of such grains from the far UV to the IR range is essential for the further search for carriers of circumstellar and interstellar bands. In Sect. 2, the generation of the samples as well as the techniques for analytical characterization are described. Section 3 contains the results of the analytical and spectral characterization and continues with a discussion of the results.
2. Experimental
2.1. Sample production
Carbon soot particles were produced by pulsed laser ablation of graphite and subsequent condensation in a quenching gas atmosphere at pressures between 3.3 and 26.7 mbar. A scheme of the experimental setup is shown in Fig. 1. Nd:YAG laser pulses with a wavelength of 532 nm (second harmonic) were used to evaporate carbon from the rotating graphite target (Ringsdorff Spektralkohle). The duration of the laser pulses was 5 ns with pulse energies between 50 and 240 mJ. Additionally, defocusing of the laser beam allowed to vary the power density on the target.
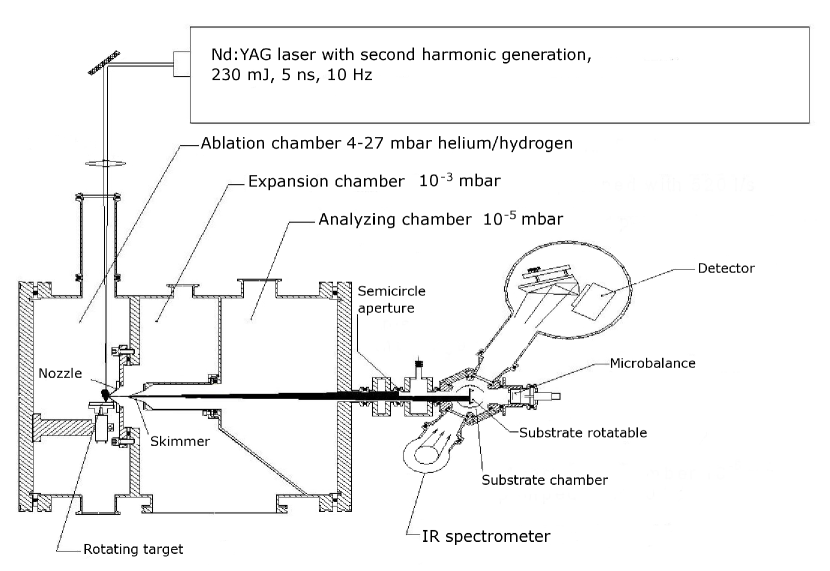
The applied power densities varied between 2108–9109 W cm-2 resulting in temperatures of more than 4000 K in the condensation zone (Jäger et al., 2008). The quenching gas pressures have been changed in order to influence the chemical and structural properties of the condensates. The applied low pressure regimes between 3.3 and 6.0 mbar are comparable to the pressure conditions for dust condensation in AGB stars with a C/O ratio of 2, where a pressure larger than 3 mbar is necessary to condense TiC prior to graphite (Lodders & Fegley, 1999). In our condensation experiments, helium, hydrogen, water, and mixtures of He/H2 and He/H2O served as quenching gases. The He/H2 and He/H2O flows were kept constant during the condensation experiments by employing flow controllers and amounted to 5:3 and 50:1, respectively.
The condensation of carbon particles is caused by collisions between the evaporated carbon atoms and clusters in a supersonic expansion of the hot plasma. Further cooling is achieved by collisions with rare gas atoms and the molecules of the admixture. In order to avoid strong structural processing and agglomeration of the originally condensed grains, the particles were extracted from the condensation zone through a nozzle and skimmer to form a freely propagating particle beam. Finally, the carbon grains were deposited on KBr and CaF2 substrates for IR and UV/VIS spectroscopy, respectively. The distance between the condensation zone and the nozzle was of the order of a few millimeters and was kept constant for all experiments. The experimental setup allows us to record IR spectra of the deposited particles without exposure to air. The amount of deposited carbon particles on the substrate was determined by means of a quartz microbalance, i.e. a part of the particle beam was directed to a microbalance in order to measure the thickness of the particle layer.
2.2. Analytical characterization of the condensed carbon grains
The internal structure of carbon primary particles was investigated by high-resolution transmission electron microscopy (HRTEM). The term ’primary particles’ is used for the condensed individual soot particles composed of subunits such as bent graphene layers. The internal structure of these particles is characterized by the types of bonds (short-range order), the lengths of the subunits, and distances between them (medium-range order). These analytical characterizations are very important since the internal structure determines the spectral properties of the material. HRTEM has been performed using a JEOL JEM 3010 microscope equipped with a LaB6 cathode operating at an acceleration voltage of 300 kV. For this purpose, the carbon particles were directly collected on TEM grids from the extracted particle beam in the third chamber (analyzing chamber). The internal structure of the particles as a function of the experimental condensation conditions could be quantified statistically by performing various image analyses which are specified in a previous paper (Llamas-Jansa et al., 2007). The HRTEM micrographs were Fourier-transformed (FT) to reveal any ’periodicity’ in the structure, and the intensity profiles of the computer-generated diffractograms have been applied to measure the mean distances d002 between the graphene layers for the chosen sample area. The sizes La of these graphene layers were determined within sample areas of 15 nm diameter for all evaluated HRTEM images. These image parts were skeletonized by filtering the images using ring-shaped masks, which were appropriate to eliminate the majority of periodicity without physical sense. An inverse FT from the filtered frequencies was employed to generate the skeletonized image which was used to measure the sizes of the graphene layers.
Electron energy loss spectroscopy (EELS) was applied using a Gatan Imaging Filter, which was attached to a 200 kV HRTEM (Philips CM 200 FEG). The EEL spectra have been used to determine the mean ratio between sp2 and sp3 hybridized carbon in the particles. The method is described in detail in previous papers (Jäger et al., 1998, 1999). For quantitative structural analyses, we have employed the core-loss measurements, where the (1s–) transitions at 286 eV and the broad (1s–) transitions above 290 eV were used to distinguish between the sp2 and sp3 hybridization states of carbon. The sp2/sp3 ratio was quantitatively determined by fitting the core-loss spectra with Gaussian profiles and computing the integral intensities of the to bands. The calculated ratio of to electrons was compared with the ratio determined in a standard carbon soot sample. This standard sample was a soot material produced by resistive heating of graphite rods and subsequent condensation of nanoparticles in a helium atmosphere. The sp2/sp3 ratio in this sample was measured by EELS and, in addition, by 13C-NMR, and both results were in very good agreement (Jäger et al., 1999). Bent graphene layers that can be observed in the HRTEM images represent mixed hybridization states which means that the (1s–) band is shifted to higher energies (Ajayan et al., 1993).
In-situ IR transmission spectra of the deposited particles were recorded using a Fourier Transform IR spectrometer (Bruker 113 v) in the wavelength range between 2 and 20 m for the KBr or between 2 and 12 m for CaF2 substrates. The fraction of hydrogen in the soot grains has been determined from the analysis of the IR spectra in the range of the -C–H stretching vibrational bands at 3.4 m (3000 – 2800 cm-1). The relation between the integrated strength of the saturated aliphatic –C–H bands and the hydrogen content in the samples is based on a method proposed by Jacob & Unger (1996).
FUV/UV/VIS transmission spectroscopy in the wavelength range between 115 and 1000 nm was performed on the soot samples deposited on CaF2 substrates by means of a VUV spectrometer (LZ Hannover) covering the range between 115 and 230 nm and a standard grating spectrometer (Perkin Elmer Lambda 19) operating between 190 and 3000 nm.
3. Results and Discussions
3.1. Structural characterization
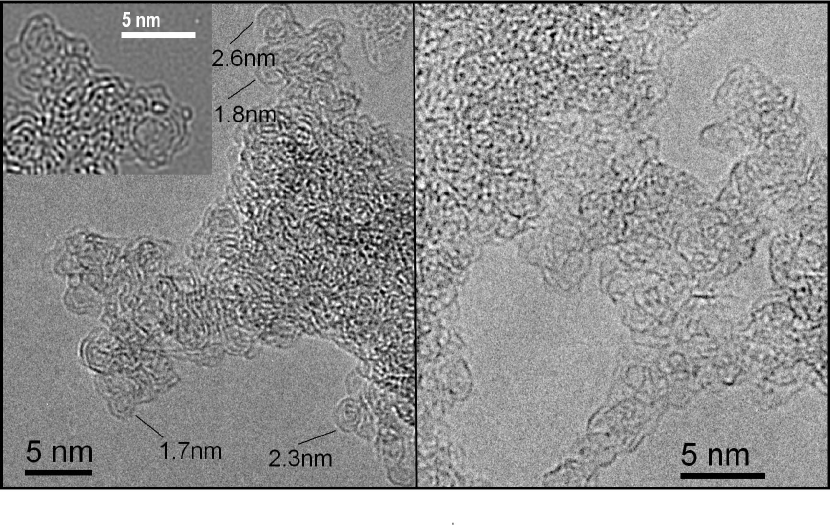
The laser ablation/condensation setup combined with the particle beam extraction of the condensed grains from the hot condensation zone, allowed to extract the freshly condensed carbon grains in a very early state of formation avoiding strong processing of the grains in the hot condensation zone. In order to investigate the size, shape, and structure of the carbon grains, we have applied HRTEM. For these purposes, we have directly collected the carbon grains on a TEM grid from the extracted particle beam. HRTEM images have shown that the condensed grains are very small, fullerene-like particles (see Fig. 2). These particles are composed of small, strongly bent graphene layers with varying lengths (La) and distances between these layers. All observed grain structures can be described as amorphous showing the typical structureless halo in the Fourier- transformed bright field images. The level of disorder depends on the employed condensation conditions. To derive the structural parameters of the carbon particles quantitatively, we have used the image analysis described in Sect. 2.2. The results of this analysis are presented in Table 1 together with the ratio between sp2 and sp3 hybridized carbon determined from EELS (expressed as the fraction of sp2) and the hydrogen content determined from IR spectroscopy.
| Sample | Laser pulse energy | Pressure | Quenching | H/C | sp2 C | Mean La | Largest La | Mean d002 |
|---|---|---|---|---|---|---|---|---|
| mJ/pulse | (mbar) | gas | % | (nm) | (nm) | value (nm) | ||
| S1 | 240 uf* | 26.7 | He | 0.14 | 56 | 0.53-0.6 | 2.7 | 0.43 |
| S2 | 240 f* | 26.7 | He/H2 | 0.16 | 57 | 0.49 | 2.2 | 0.51 |
| S3 | 240 f | 3.3 | He/H2 | 0.39 | - | 0.45 | 1.7 | 0.54 |
| S4 | 50 f | 6.0 | He/H2 | 0.50 | 48 | 0.42 | 1.8 | 0.59 |
| S5 | 240 uf | 6.0 | He/H2 | 0.52 | 48 | 0.42 | 1.7 | 0.57 |
| S6 | 2.4 f | 4.0 | He/H2O | 0.57 | - | 0.43 | 1.8 | 0.57 |
| S7 | 2.4 f | 13.3 | He/H2O | 0.41 | - | 0.44 | 1.7 | 0.55 |
| S8 | 0.8 f | 13.3 | He/H2O | 0.16 | - | 0.49 | 2.0 | 0.48 |
The derived mean sizes of the graphene layers La are very small for all carbon samples. However, one can observe a decrease of the layer size with decreasing pressure and decreasing laser power. The more hydrogen is incorporated the smaller is the mean La.
The sp2/sp3 ratio increases with growing quenching gas pressure. The incorporation of hydrogen in carbon nanoparticles leads to smaller sizes of the subunits and higher content of sp3 hybridized carbon along with higher curvature radii of the graphene layers.
There are strong variations in the hydrogen content, but only small differences in the mean graphene layer sizes and distances between the graphene layers and in the overall structure of the grains. The soot samples produced in mixed He/H2 atmospheres have shown that the insertion of hydrogen is highest for those produced at low pressure (see S1 and S2 compared to S3-S5 in Tab. 1) and with low laser power or unfocused laser beam (see S4 and S5).
Generally, the applied laser power densities between 1.2 and 9.2109 Wcm-2 and the associated temperatures should be high enough to dissociate the molecular hydrogen efficiently. The vibrational temperature of the laser-induced plasma, generated by laser evaporation of a graphite target in a 10 mbar He atmosphere with power densities between 0.5-2109 Wcm-2 was found to range between 4000 and 6000 K (Iida & Yeung, 1994). At small laser powers, the number of hydrogen atoms becomes low enough to produce not only volatile organic molecules but also solid nanograins. The latter assumption is supported by the experimental fact that, at lower laser power, the soot yields are higher than at high laser power. Additionally, the level of hydrogen incorporation into the structure is influenced by a competitive reaction of hydrogen release at high temperatures resulting in optimum conditions for H insertion at low pressure and laser power.
For the soot samples condensed in mixed helium/water atmospheres, we found that the hydrogen content in the carbon structure is very high, even at very low water partial pressures. In contrast to the He/H2 samples, the hydrogen content is increasing with growing laser power. This is due to the fact that the number of generated hydrogen atoms from water molecules is much lower compared to the condensation process in He/H2 atmospheres even if all water molecules are dissociated in the laser field. Consequently, the limited number of hydrogen atoms in these atmospheres leads to the formation of solid grains instead of the formation of organic molecules. The oxygen is partly inserted as carbonyl (–C=O) groups in the structure.
3.2. Spectroscopic characterization
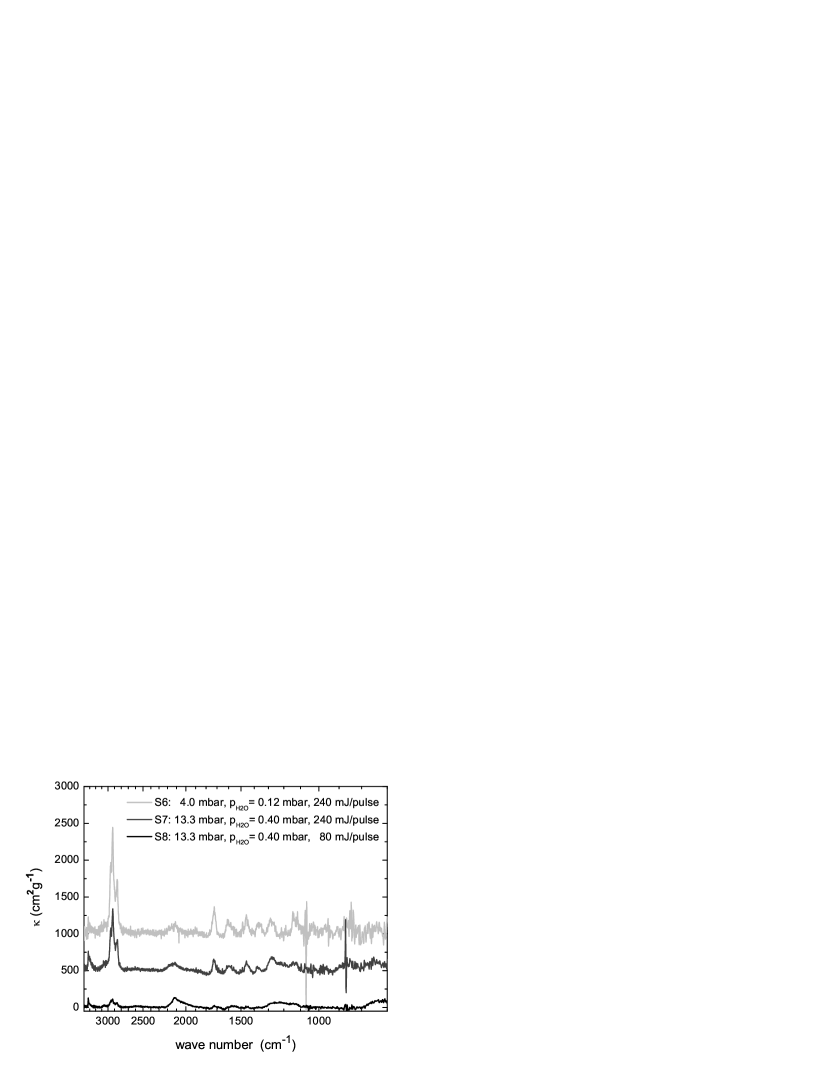
The IR mass extinction coefficient spectra of soot condensed in He/H2O atmospheres, derived from the baseline-corrected IR transmission spectra, are presented in Fig. 3. The mass extinction coefficient has been calculated from transmission by where and represent the density of the carbon grains and the thickness of the layer, respectively. The density was determined to be 1.55 g cm-3 by a pyknometer measurement whereas the layer thickness has been measured with the quartz microbalance.
The IR measurements have been performed in situ on the freshly deposited carbon particle films in a vacuum of 210-6 mbar in order to prevent the adsorption of organic molecules on the surface of the dust particles from air. This is a general problem of many of the previously published measurements of the optical response function of carbon soot particles which are known to be efficient adsorbers. The IR band attribution is given in Tab. 2.
| IR band position | Assignment of the bands |
| cm-1 | |
| 3300 - 3310 | C–H stretching |
| 3060 - 3050 | =C–H stretching |
| 3000 - 2800 | –C–H stretching |
| 2110 - 2125 | –CC– stretching |
| 1720 - 1730 | –C=O stretching |
| 1593 - 1605 | –C=C– stretching |
| 1455 - 1465 | –C–H deformation |
| 1360 - 1380 | –C–H deformation |
| 1270 - 1280 | –C–C– stretching, –C–H deformation |
| 1120 - 1145 | –C–C– stretching, –C–H deformation |
| 850 - 860 | =C–H out of plane, 1 H, 2 adjac.H |
| 735 - 745 | =C–H out of plane, 3 to 5 adjac.H |
Only very weak aromatic C-H stretching bands at around 3060 cm-1 have been detected in the samples, but bands between 1605 and 1610 cm-1, observed in all samples, confirm the existence of aromatic –C=C– in the carbon structure. The hydrogen is mainly incorporated as saturated –CH2 or –CH3 groups probably acting as bridges between bent aromatic subunits. Besides the strong –C–H stretching vibrations at 3.4 m, the typical –C–H deformation bands around 1460 and 1375 cm-1 have been detected. Additionally, small –C=O features around 1730 cm-1 have been measured. Since we were not able to deposit carbon layers with thicknesses larger than 170 nm, we obtained very noisy spectra in the long-wavelength range of the IR. Therefore, only very noisy aromatic out-of-plane bending =C–H vibrational bands could be observed at around 740 and 850 cm-1. The IR spectra show high mass extinction coefficients in the 3.4 m range up to 1550 cm2g-1 for the samples with the highest content of hydrogen in the structure.
The corresponding extinction spectra in the FUV to VIS spectral range of the soot particles produced in He/H2O atmospheres are depicted in Fig. 4. Although we have determined a considerable amount of sp2 hybridized carbon in the samples, the UV spectra do not show a distinct bump due to (*) transitions.
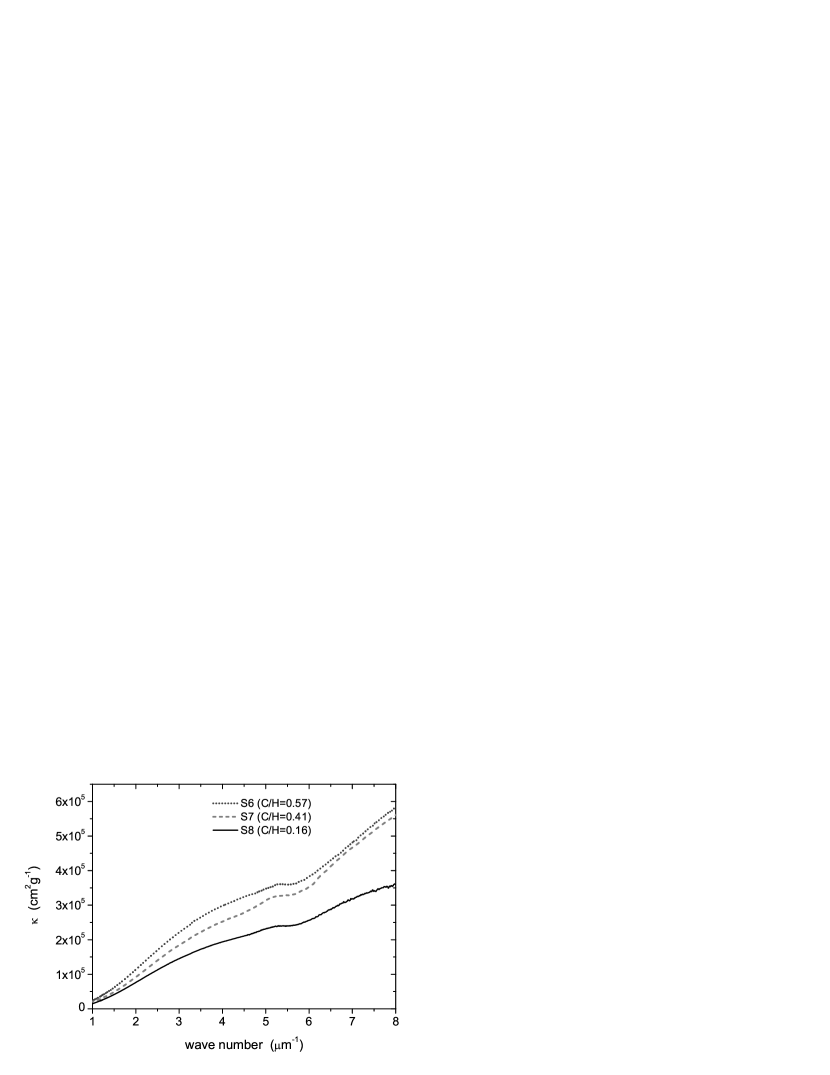
An identical spectral behavior, both in the IR and the FUV/UV/VIS ranges, has been found for the carbon nanoparticle layers produced from condensation in He/H2 atmospheres. The UV/VIS spectra of these condensates shown in Fig. 5 do not exhibit distinct bands either. The change in the slope at about 5.8 m-1 indicates a very broad (*) band, merging with the long-wavelength wing of the strong and broad (*) band located in the far UV.
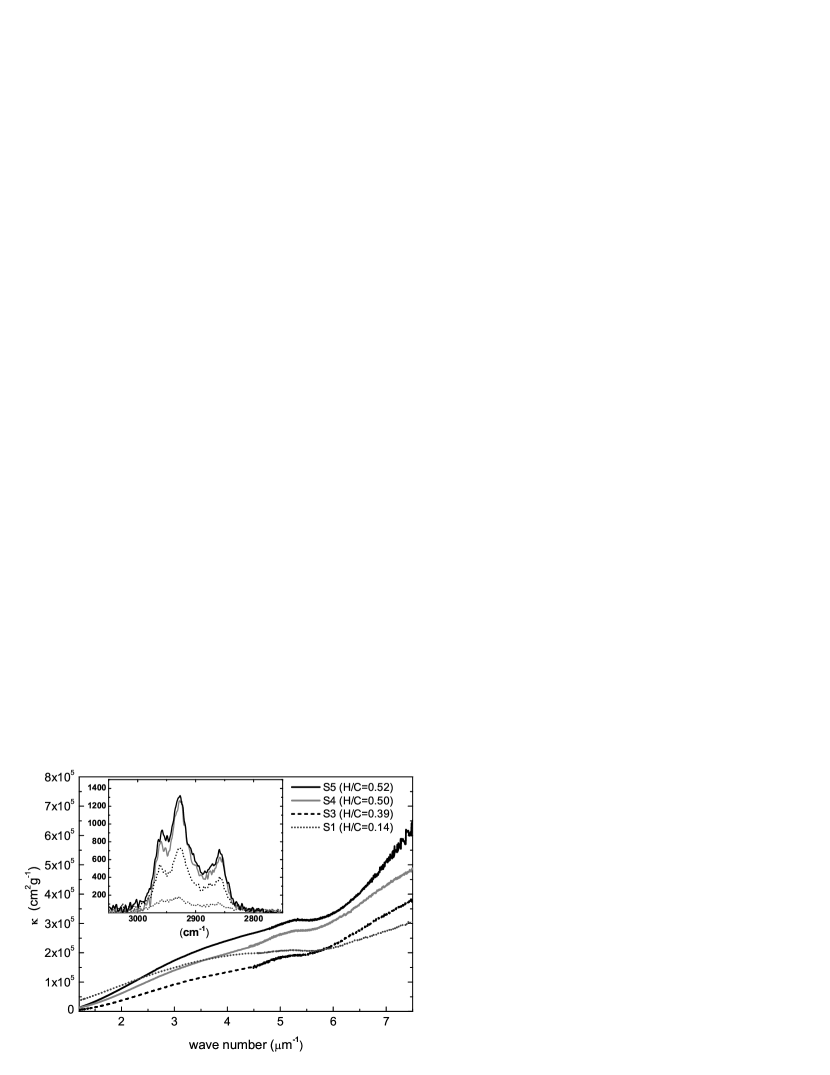
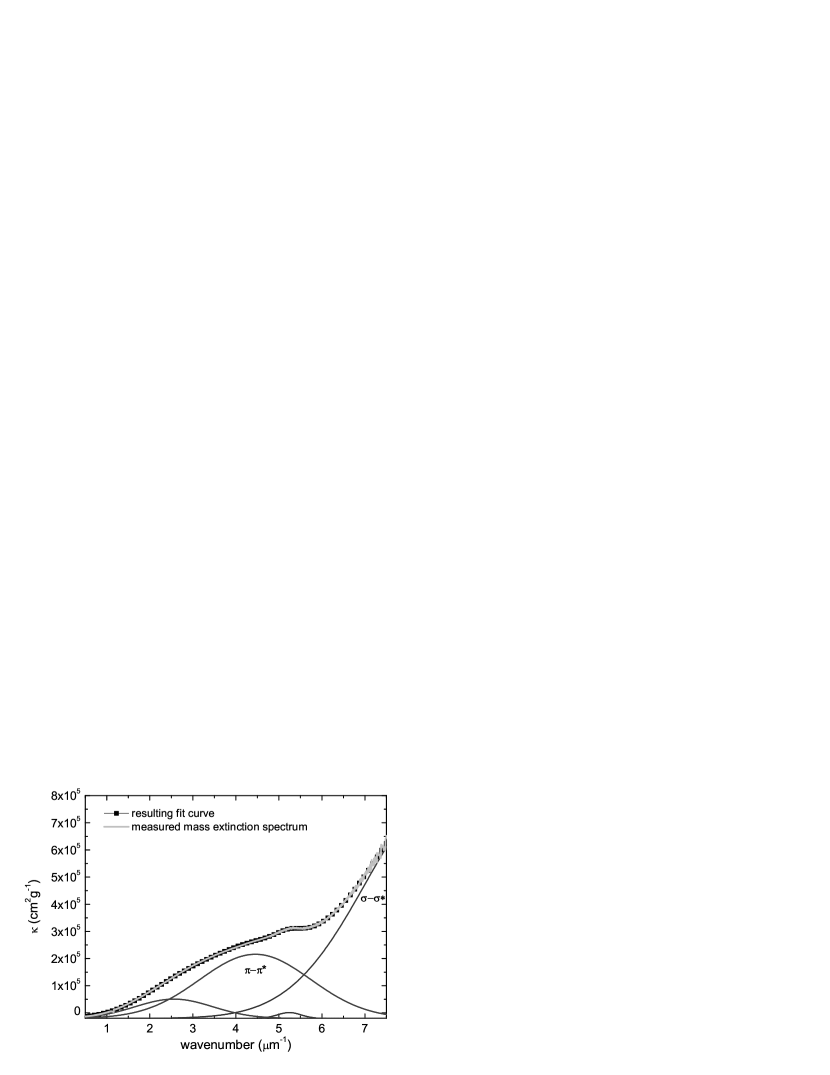
Fig. 6 shows the deconvolution of one of the UV/VIS spectra into Gaussian profiles. Similarly to Llamas-Jansa et al. (2007), we employed four Gaussians to obtain an accurate fit of the extinction spectrum. The strong oscillator around 9 m-1 accounts for the (*) electronic transitions whereas the broad Gaussian profile centered around 4 m-1 describes the (*) transitions. The weak Gaussian at approximately 2.5 m-1 is interpreted as a plasmon peak due to some larger but strongly bent graphene layers. The width of the (*) main band and the appearance of the plasmon band accounts for a strong disorder in the carbon structures due to a broad distribution of curvatures and lengths of graphene layers in the small fullerene-like carbon grains. For the sample with the highest hydrogen content, the (*) and the (*) main bands were found to be located at 4.45 and 8.79 m-1, respectively. With decreasing hydrogen content in the sample, the (*) band is slightly shifted to smaller wave numbers (3.84 m-1) whereas the (*) transition band remains at the same position (8.8 m-1). The measured mass extinction coefficients were found to be dominated by absorption. Scattering measurements have been performed at soot samples produced by laser pyrolysis consisting of very similar small fullerene-like particles (Llamas-Jansa et al., 2007). For these samples, an approximately linearly increasing scattering contribution ranging between 2% for wave numbers at 2 m-1 and 11% for 4 m-1 was measured.
At this point, we have to address a possible influence of nanoparticle distribution and clumping on the CaF2 substrates on the UV spectral properties. Despite we have combined our gas-phase condensation with a particle beam extraction, we could not completely avoid the agglomeration of our originally condensing very small fullerene-like particles. In a condensation process which is caused by a high supersaturation of vapor, one has to expect the condensation of a large number of very small particles (nuclei). Further particle growth is exclusively due to particle coagulation. This is exactly the process we can observe in the HRTEM images of the particles, which were always directly deposited on the TEM grids from the extracted particle beam in the third (analyzing) chamber. The individual particles are very small (less than 3-4 nm). The largest particle agglomerates are in a range of 15 nm. The morphology of the particle agglomerates on the substrate can be understood as a porous layer of rather fractal agglomerates. The formation of very dense and large grain agglomerates can be excluded since we have measured only a very low scattering.
Particle clustering and interaction of particles with the substrate can increase the width of the UV bump. Unfortunately, we cannot exactly calculate the influence of particle agglomeration on the broadening of the UV band since we do not have the optical constants of the material. However, agglomeration effects have been calculated and measured for carbonaceous particles by several authors (Schnaiter et al., 1998; Quinten et al., 2002). Strong effects appear only in very elongated particles, such as prolate spheroids. The formation of clusters should not completely prevent the formation of a distinct UV band, which was also shown in previous UV measurements of soot produced in gas-phase condensations from resistive heating of graphite rods in quenching gas atmospheres without particle beam extraction.
The weak band at around 5.2 m-1 (190 nm) does not change in position with the structure of the carbon materials. An origin of this band can be the absorption of –C=O groups which could be identified in small amounts in the IR spectra of nearly all carbon soot samples. Electronic transitions of carbonyl groups have been found to be located between electronic (*) and (*) transitions (Braun et al., 2005). Carbonyl groups bound to carbon can be removed by gentle annealing. Therefore, we have heated a few samples to temperatures of around 600 K for 1-2 hours or to 523 K for 8-10 hours. As a result of the gentle heating of the sample, the small bands at around 190 nm became much weaker, supporting the band assignment to –C=O groups.
The IR mass extinction coefficients in the spectral range of the –CHx stretching vibrations at 3.4 m of the soot samples, condensed in He/H2 quenching gas atmospheres, are shown in the inset of Fig. 5. The sample with the highest hydrogen fraction shows a mass extinction coefficient of about 1400 cm2g-1. The 3.4 m absorption profile compares well with the 3.4 m extinction profile of the diffuse interstellar medium (Pendleton & Allamandola, 2002) which is shown in Fig. 7.

However, using the measured oscillator strengths of the –C–H vibrational bands, we calculated that, even for the samples with high hydrogen content and a mass extinction coefficient of approximately 1400 cm2g-1, nearly 80 ppm carbon relative to hydrogen would be consumed to fit the intensity of the interstellar 3.4 m profile (Furton et al., 1999; Mennella et al., 2002). This is generally seen as the amount of carbon available for the formation of solid carbonaceous material (Snow & Witt, 1995; Cardelli et al., 1996).
In the UV absorption model by Robertson & O’Reilly (1987), the band structure is determined by the size distribution of the condensed aromatic islands in the carbonaceous structure and can be expressed by analyzing the gap energy. The gap energy can be derived from the optical spectra by means of the Tauc relation (Tauc et al., 1966) which describes the energy dependence of the imaginary part of the dielectric function above = 104 cm-1. Instead of , we have used the absorption coefficient to derive the gap energy. This is a very frequently applied method to calculate the gap energy. However, we should stress that the absorption coefficient is only proportional for a constant refractive index which is probably not completely correct for carbonaceous material. We have found values between 1.03 and 1.23 eV for the samples with the lowest and the highest H content, respectively. According to the relation derived by Robertson & O’Reilly (1987), where represents a quantum chemically estimated overlapping energy between two adjacent pz orbitals that has an empirical value of 2.9 eV, the optical gap energy of soot is related to the number of condensed rings in the graphene layers. Employing this relation, the values between 1.03 and 1.23 eV correspond to 32 to 22 condensed aromatic rings in a graphene layer, or to diameters of the graphene layers between 2.8 and 1.7 nm (with the diameter of a single ring being 0.24 nm).
The calculated lengths of the graphene layers do not agree with the mean values determined by HRTEM. Actually, they agree approximately with the maximum values (see Table 1) representative of only a few strongly bent larger graphene layers seen as parts of the outer shells of a number of soot particles (cf. Sect. 3.1). The Gaussian contribution at the smallest wave numbers in the UV/VIS spectrum (see Fig. 6), probably caused by plasmon excitation in these few larger graphene layers, can also contribute to the gap energy to a certain extent.
We should note that the discrepancies between the calculated and measured lengths of the graphene layers can either originate from the fact that the calculated values are inaccurate, or the applied model is only valid for plane aromatic units, but not for bent layers and closed fullerene-like structures. More recent models and actual measurements of gap energies of large PAHs provide much higher values for Eg than those calculated by the Tauc relation (Tyutyulkov et al., 2004; Yang et al., 2007). The energy gap of PAHs depends not only on the size of the molecules, but also on their structure, such as the nature of the periphery (Watson et al., 2001). In any case, this investigation demonstrates that, in case of a soot material with a wide variation of graphene layer sizes and curvatures, the optical gap energy may be of limited value as a structural parameter since it may not reflect the properties of the dominating structural units.
3.3. Comparison with other carbonaceous dust analogs
Our carbonaceous materials produced by using pulsed laser ablation at high power densities and high condensation temperatures are structurally the same as the soot produced in our laboratory by pulsed CO2 laser-driven pyrolysis of hydrocarbons (Llamas-Jansa et al., 2007). Therefore, the UV spectral properties are well comparable. Differences in the IR spectra result from smaller H/C ratios in the these condensates and a somewhat higher content of –C=O groups.
Comparisons with condensation products, produced in our laboratory by resistive heating of carbon electrodes and subsequent condensation of grains in quenching gas atmospheres, show differences in structure and spectral behavior. In these condensation experiments, the carbon grains were either clearly larger and contained longer and less bent graphene layers, or they were characterized by a defective onion-like structure, but larger grains. The soot materials showed distinct UV bumps in a range between 196 and 270 nm due to (*) electronic transitions (Schnaiter et al., 1998; Jäger et al., 1999). The position of the UV band was found to be sensitive to small changes in the internal structure which is correlated with modifications of the ratio of sp3 to sp2 hybridized carbon and the content of hydrogen in the sample. The IR spectra reveal the appearance of analogous bands since they were typical for functional groups such as –CHx, –C=C–, and –C=O, either present in our samples, but the intensities of the –CHx vibrational bands are lower compared to the samples produced by laser ablation. This indicates a lower hydrogen content in the previous condensates.
Since the pulsed laser ablation and condensation of soot particles is characterized as a high-temperature (HT) process (Jäger et al., 2008), other HT condensation processes should provide comparable materials. The hydrogenated amorphous carbon (HAC) film produced by Furton et al. (1999) employing a plasma-enhanced chemical vapor deposition reveal very similar structural parameters as found in our soot samples. The authors did not use electron microscopy to obtain information on the internal structure of the soot, but they derived the H/C ratio, density, and hybridization ratio to characterize the sample. The IR mass extinction coefficient at 3.4 m is similar to the value measured for the sample S5 (H/C = 0.52) in this study, but the derived gap energy is higher than those calculated for our sample. In the UV/VIS, the material shows similar characteristics with a continuously rising absorption coefficient in the near-UV.
Laser ablation of graphite employing a pulsed XeCl excimer laser and condensation of hydrogenated amorphous carbon in different quenching gas mixtures have been performed by Scott & Duley (1996) and Grishko & Duley (2002). The authors analyzed the spectral properties of the condensates in a broad wavelength range. The UV absorption spectra of the HAC film did not show a UV bump after deposition at room temperature. Annealing up to 500-600 K provoked the appearance of a band at 4.6 m which is discussed to result from a dehydrogenation and development of aromatic areas of the size of coronene (Duley & Lazarev, 2004). In the IR, the absorption spectra of HACs deposited at low temperature match well the –C–H stretching bands of the ISM at 3.4 m (Duley, 1994). Unfortunately, quantitative information on the intensity of these bands is missing.
Mennella et al. (2002) produced particulate carbonaceous dust analogs by pulsed laser ablation of carbon rods and condensation of the grains in a 10 mbar argon atmosphere which can also be considered as HT condensation process. The grains were exposed to a flux of atomic hydrogen, and –C–H stretching bands typical for sp3 hybridized carbon atoms have been activated. The resulting IR spectrum compares well with our IR measurements. Unfortunately, a study of changes in the internal structure of the condensate and UV/VIS measurements have not been performed at this sample. Another hydrogen-containing carbon grain material was produced by arc discharge between two carbon rods in a 10 mbar hydrogen atmosphere (Colangeli et al., 1995). The original grains displayed a featureless UV spectrum at wavelengths longer than 190 nm, as was found for our samples. The corresponding IR spectra are characterized by the typical –C–Hx vibrational bands at 3.3, 3.4, 6.4, 6.9, and 7.3 m and a –C=O band at 5.8 m. However, the intensity of the 3.4 m band is quite low and comparable to the one of our soot material S1 with the lowest hydrogen content. Unfortunately, a characterization of the internal structure of these grains is missing. Therefore, a classification of the spectral properties in relation to the inner structure is impossible.
The condensed soot produced by Herlin et al. (1998) employing a continuous-wave (cw) laser-driven pyrolysis of hydrocarbons, that is considered as a low-temperature (LT) condensation process, shows a different structure. The authors performed a very careful characterization of the internal structure of these grains. In contrast to our condensate, they found larger grains that contain longer, less bent, and more ordered graphene layers. Consequently, the IR bands are typical of an aromatic soot condensate with a high ratio between the aromatic =C–H stretching band at 3.3 m and the aliphatic –C–H stretching bands around 3.4 m. Unfortunately, the UV spectral properties of the condensate have not been measured. The condensation conditions are very similar to the condensed soot material produced by cw laser pyrolysis of hydrocarbons described in Jäger et al. (2007) which were found to consist of mixtures of soluble PAHs and solid soot grains.
We would like to emphasize the analogy of the structure-forming units in our soot particles, that can be considered as fullerene fragments, to the structural units present in so-called defective onions, even though our soot grains could be characterized as more disordered.
Carbon onion particles have been discussed to represent a possible carrier for the interstellar UV bump (Henning et al., 2004). Wada & Tokunanga (2006) could show that such defective onion-like carbon grains were also found in the granular and the dark quenched carbonaceous composite (QCC) component condensed by an eject of a hydrocarbon plasma. The size of the onions ranges from 5 to 15 nm containing an empty core of 2–3 nm in diameter. The onion-like particles are composed of 3 to 15 concentric shells, that means, they are much larger than our fullerene-like particles. In contrast to our results, these authors found a distinct but broad band at around 220 nm which is shifted to longer wavelengths upon annealing. The annealing of the sample was accompanied by an increase of the particle sizes and a flattening of the carbon layers.
Tomita et al. (2002) produced so-called defective carbon onions by annealing of nanodiamonds and found an absorption band at 3.9 m-1 for onions dispersed in water. A theoretical model was developed by the authors to complement the experimental results. Defective onions of 5 nm with hollow cores of 0.7 nm in diameter were found to fit the interstellar UV bump very well.
Similar theoretical results were published by Iglesias-Groth (2004) who could find a good match between the interstellar 217 nm bump and a mixture of fullerenes and buckyonions with sizes between C60 and C3890 corresponding to radii ranging from 0.35 to 2.8 nm
Resulting from our experimental study and the different experimental and theoretical approaches mentioned above, we believe that, for onion particles, the size of the particles is a crucial parameter and will determine the position and shape of the UV bump. Large particle sizes shift the UV bump to longer wavelengths due to flatter graphene layers in the outer part of the particles whereas small particles can provide a UV band at smaller wavelengths that is comparable to the interstellar UV bump. Therefore, only onions with a relative monodisperse size can cause a sharp UV absorption band. A size distribution of particles would always lead to a broadening and a shift of the UV absorption due to a distribution of sizes and curvatures of graphene layers.
The comparison of differently produced gas-phase-condensed carbonaceous matter makes clear that the spectral properties depend on the production process and, consequently, on the internal structure of the sample including such parameter as the mean length of graphene layers, level of bending of the graphene layers, hydrogen content, and hybridization state of the carbon. In general, the understanding of the absorption behavior of carbon onions or carbon nanoparticles with more or less ordered, strongly bent graphene layers in broad wavelength range is essential for the further search for carriers of the interstellar bands.
4. Conclusions
Soot material condensed at high temperatures is characterized by very small particles due to the high supersaturation of carbon vapor in the condensation zone resulting in a high number of nucleation seeds and a further particle growth by coagulation, exclusively. Its structure can be described as fullerene-like soot containing elongated or symmetric cages which can be interleaved. However, most of the observed structural units are cage fragments which can be bound to each other either by aliphatic bridges or by van der Waals forces. The observed graphene layers are strongly bent inside the small seed-like soot grains leading to a much lower electron density in the aromatic double bonds. The observed fullerene fragments are very similar to the structural units observed in so-called defective onions.
We have characterized the soot materials by several analytical methods such as EELS, FUV, UV, VIS, and IR spectroscopy in order to determine the ratio of sp2/sp3 hybridized carbon, the content of hydrogen, and the spectral properties of the generated soot. Structural parameters (mean lengths of the graphene layers and distances between them) have been derived directly from the HRTEM images. The condensed soot materials show an upper limit of the H/C ratios of 0.57 and corresponding peak mass extinction coefficients in the 3.4 m bands of around 1550 cm2g-1. The FUV/UV/VIS spectra of soot with low and high hydrogen content do not show distinct peaks due to electronic (-*) transitions. The (-*) transition band is very broad and rather hidden in the long-wavelength tail of the (*) transitions.
There is good agreement between the observed interstellar 3.4 m profile (Pendleton & Allamandola, 2002) and the 3.4 m absorption of the dust condensate produced in our laboratory. In addition, our laboratory products fulfill nearly completely the four spectral criteria outlined by the authors to compare the laboratory product with the interstellar dust material, such as the 3.4 m aliphatic –CHx stretching band profile and subpeak positions, no –OH stretching band near 3.1 m, a ratio of the optical depth of the aliphatic –CHx stretching bands to the optical depth of the carbonyl band at 5.9 m of more than 2, and a ratio of the optical depth of the aliphatic –CHx stretch features to the optical depth of the –CHx deformation modes near 6.8 and 7.25 m of about 5. Nearly 80 ppm carbon relative to hydrogen is necessary to match the intensity of the interstellar 3.4 m profile for the sample with high hydrogen content and a mass extinction coefficient of 1400 cm2g-1 (Furton et al., 1999; Mennella et al., 2002).
The bending of the graphene layers in soot particles causes a change in the electronic structure of carbon, and this effect was already demonstrated by EELS measurements in the low loss and the core loss region of the spectra (Jäger et al., 1999). Here, the electronic (1s-*) transition is shifted to higher energies and the typical bond shows a growing s-character. Therefore, the position of the electronic transitions, especially the transition between the bonding and antibonding orbitals, is determined by the size of the graphene subunits and/or the degree of bending of these structures. In our soot particles, the (*) bands are shifted from 4.45 m-1 for the sample with the highest hydrogen content to 3.84 m-1 in the sample with the lowest content of hydrogen. The lowering of the hydrogen content in the very small fullerene-like particles is, at nearly the same degree of bending of the graphene layers inside the grains, accompanied by a reduction of the mean lengths of these layers. However, a clear relation between the UV band and the degree of bending and/or the length of the graphene layers, as determined by Robertson & O’Reilly (1987) for the plane graphitic subunits, has not been found for soot materials containing strongly bent graphene sheets. This is due to the difficulties to determine the level of bending in carbon grains with such a large variety of different internal structures.
Obviously, the relevant grain formation process is based on the generation of fullerenes and fullerene fragments in the condensation zone. The precursors for these fragments are probably chain-like molecules containing CC and CH triple bonds. Hints for the intermediate formation of such triple bonds can be found in the IR spectra of the soot. The formation of these cage fragments from the chains has been modeled by the help of quantum-chemical molecular dynamics simulations. High carbon densities are necessary to produce these structures from C2 (Zheng et al., 2005). At temperatures above 2000 K, the molecules quickly combine to long and branched carbon chains. From the chains, small cyclic structures can develop with long carbon chains attached. Consequently, fullerene fragments of bowl shape with side chains are formed (Irle et al., 2003). Such a soot formation process can be of high relevance in supernovae or in the hot circumstellar environments of carbon-rich stars, such as Wolf-Rayet stars (Cherchneff et al., 2000).
References
- Ajayan et al. (1993) Ajayan, P., Iijima, S., & Ichihashi, T. 1993, Physical Review B, 47, 6859
- Andersen et al. (2003) Andersen, A. C., Höfner, S., & Gautschy-Loidl, R. 2003, Astron. Astrophys., 400, 981
- Beegle et al. (1997) Beegle, L., Wdowiak, T. J., Robinson, M., et al. 1997, Astrophys. J., 487, 976
- Braun et al. (2005) Braun, A., Huggins, F. E., Shah, N., et al. 2005, Carbon, 43, 117
- Buss et al. (1989) Buss, R. H., Snow, T. P., & Lamers, H. J. G. L. M. 1989, Astrophys. J., 347, 977
- Buss et al. (1993) Buss, R. H., Tielens, A. G. G. M., Cohen, M., et al. 1993, Astrophys. J., 415, 250
- Cardelli et al. (1996) Cardelli, J., Meyer, D. M., Jura, M., & Savage, B. D. 1996, Astrophys. J., 467, 334
- Cherchneff et al. (2000) Cherchneff, I., Le Teuff, Y. H., Williams, P. M., & Tielens, A. G. G. M. 2000, Astron. Astrophys., 357, 572
- Chhowalla et al. (2003) Chhowalla, M., Wang, H., Sano, N., et al. 2003, Phys. Rev. Letters, 90, 155504
- Colangeli et al. (1995) Colangeli, L., Mennella, V., Palumbo, P., Rotundi, A., & Bussoletti, E. 1995, Astron. Astrophys. Suppl. Ser., 113, 561
- Donn (1968) Donn, B. 1968, Astrophys. J., 152, L129
- Dorschner & Henning (1995) Dorschner, J. & Henning, T. 1995, Astron. Astrohys. Rev., 6, 271
- Drilling et al. (1997) Drilling, J. S., Hecht, J. H., Clayton, G. C., et al. 1997, Astrophys. J., 476, 865
- Drilling & Schönberner (1989) Drilling, J. S. & Schönberner, D. 1989, Astrophys. J., 343, L45
- Duley (1994) Duley, W. 1994, Astrophys. J., 430, L133
- Duley & Lazarev (2004) Duley, W. & Lazarev, S. 2004, Astrophys. J., 612, L33
- Duley & Seahra (1998) Duley, W. W. & Seahra, S. 1998, Astrophys. J., 507, 874
- Fitzpatrick (1999) Fitzpatrick, E. L. 1999, PASP, 111, 63
- Furton et al. (1999) Furton, D. G., Laiho, J. W., & Witt, A. N. 1999, Astrophys. J., 526, 752
- Goto et al. (2008) Goto, M., Henning, T., Kouchi, A., et al. 2008, Astrophys. J.
- Green et al. (1990) Green, D., McKenzie, D., & Lukins, P. 1990, in Material Science Forum, Vol. 52 and 53, Properties and Characterization of Amorphous Carbon Films, ed. J. Pouch & S. Alterovitz (Zürich: Trans Tech Publications Ltd)
- Greenstein (1994) Greenstein, J. L. 1994, Astrophys. J., 245, 124
- Grishko & Duley (2002) Grishko, V. I. & Duley, W. W. 2002, Astrophys. J., 568, 448
- Haddon (1993) Haddon, R. C. 1993, in The fullerenes, ed. H. Kroto & D. Walton (Cambridge: Cambridge University Press)
- Heidenreich et al. (1968) Heidenreich, R., Hess, W., & Ban, L. 1968, J. Appl. Cryst., 1, 1
- Henning et al. (2004) Henning, T., Jäger, C., & Mutschke, H. 2004, in Astrophysics of dust; Proceedings of an International Symposium held at Estes Park, Colorado, USA, May 2003, ed. A. N. Witt, G. C. Clayton, & B. T. Draine (ASP Conference Series, Volume 309), 603–629
- Henning & Salama (1998) Henning, T. & Salama, F. 1998, Science, 282, 2204
- Henning & Schnaiter (1998) Henning, T. & Schnaiter, M. 1998, in Laboratory astrophysics and space research, ed. P. Ehrenfreund, H. Kochan, C. Krafft, & V. Pirronello (Dordrecht: Kluwer), 249–278
- Herlin et al. (1998) Herlin, N., Bohn, I., Reynaud, C., et al. 1998, Astron. Astrophys., 330, 1127
- Hess & Herd (1993) Hess, W. & Herd, C. 1993, in Carbon Black, ed. J. Donnet, R. Bansal, & M. Wang (New York: Marcel Dekker, Inc.), 89–160
- Hony et al. (2003) Hony, S., Tielens, A. G. G. M., Waters, L. B. F. M., & de Koter, A. 2003, Astron. Astrophys., 402, 211
- Hrivnak et al. (2007) Hrivnak, B. J., Geballe, T. R., & Kwok, S. 2007, Astrophys. J., 662, 1059
- Huffman (1975) Huffman, D. R. 1975, Ap&SS, 34, 175
- Huffman (1988) —. 1988, in Experiments on Cosmic Dust Analogues, Astrophysics and Space Science Library, Vol. 149, ed. E. Bussoletti, C. Fusco, & G. Longo (Dordrecht: Kluwer), 25
- Iglesias-Groth (2004) Iglesias-Groth, S. 2004, Astrophys. J., 608, L37
- Iida & Yeung (1994) Iida, Y. & Yeung, E. 1994, Appl. Spectr., 48, 945
- Irle et al. (2003) Irle, S., Zheng, G., Elstner, M., & Morokuma, K. 2003, Nano Letters, 3, 1657
- Jacob & Unger (1996) Jacob, W. & Unger, M. 1996, Appl. Phys. Lett., 68, 475
- Jäger et al. (1999) Jäger, C., Henning, T., Spillecke, N., & Schlögl, R. 1999, J. Non-Cryst. Solids, 258, 161
- Jäger et al. (2007) Jäger, C., Mutschke, H., Huisken, F., et al. 2007, Carbon, 45, 2981
- Jäger et al. (2008) Jäger, C., Mutschke, H., Llamas-Jansa, I., Henning, T., & Huisken, F. 2008, in Organic Matter in Space; Proceedings of the IAU Symposium 251, held in Hong Kong 2008, ed. S. Kwok (SAO/NASA Astrophysics Data System), accepted
- Jäger et al. (1998) Jäger, C., Mutschke, H. Dorschner, J., & Henning, T. 1998, Astron. Astrophys., 332, 291
- Joblin et al. (1992) Joblin, C., Leger, A., & Martin, P. 1992, Astrophys. J., 393, L79
- Kwok (2004) Kwok, S. 2004, Nature, 430, 985
- Kwok et al. (2001) Kwok, S., Volk, K., & Bernath, P. 2001, Astrophys. J., 554, L87
- Lederer et al. (2006) Lederer, M. T., Lebzelter, T., Aringer, B., et al. 2006, Mem. S.A.It., 77, 1008
- Llamas-Jansa et al. (2007) Llamas-Jansa, I., Jäger, C., Mutschke, H., & Henning, T. 2007, Carbon, 45, 1542
- Lodders & Fegley (1995) Lodders, K. & Fegley, B., J. 1995, Meteoritics, 30, 661
- Lodders & Fegley (1999) —. 1999, in Asymptotic Giant Branch Stars; Proceedings of the IAU Symposium 191, ed. T. Le Bertre, A. Lebre, & C. Waelkens (SAO/NASA Astrophysics Data System), 279
- Mennella et al. (1999) Mennella, V., Brucato, J. R., Colangeli, L., & Palumbo, P. 1999, Astrophys.J., 524, L71
- Mennella et al. (2002) —. 2002, Astrophys.J., 569, 531
- Mennella et al. (1996) Mennella, V., Colangeli, L., Palumbo, P., et al. 1996, Astrophys.J., 464, L191
- Michel (1995) Michel, B. 1995, J. Optical Society of America, A12, 2471
- Michel et al. (1999) Michel, B., Jäger, C., Henning, T., & Kreibig, U. 1999, Carbon, 37, 391
- Muci et al. (1994) Muci, A. M., Blanco, A., Fonti, S., & Orofino, V. 1994, Astrophys. J., 436, 831
- Nowotny et al. (2005) Nowotny, W., Aringer, B., Höfner, S., Gautschy-Loidl, R., & Windsteig, W. 2005, Astron. Astrophys., 437, 273
- Oberlin (1990) Oberlin, A. 1990, in Chemistry and Physics of Carbon, Vol. 22, (New York: Marcel Dekker.Inc.), 2–143
- Pendleton & Allamandola (2002) Pendleton, Y. J. & Allamandola, L. J. 2002, Astrophys. J. Suppl. Ser., 138, 75
- Quinten et al. (2002) Quinten, M., Kreibig, U., Henning, T., & Mutschke, H. 2002, Applied Optics, 41, 7102
- Robertson & O’Reilly (1987) Robertson, J. & O’Reilly, E. 1987, Physical Review B, 35, 2946
- Rouleau et al. (1997) Rouleau, F., Henning, T., & Stognienko, R. 1997, Astron. Astrophys., 322, 633
- Schnaiter et al. (1998) Schnaiter, M., Mutschke, H., Dorschner, J., Henning, T., & Salama, F. 1998, Astrophys. J., 498, 486
- Scott & Duley (1996) Scott, A. & Duley, W. 1996, Astrophys. J. Suppl. Series, 105, 401
- Snow & Witt (1995) Snow, T. P. & Witt, A. N. 1995, Science, 270, 1455
- Snow & Witt (1996) —. 1996, Astrophys. J., 468, L65
- Stecher & Donn (1965) Stecher, T. & Donn, B. 1965, Astrophys. J., 142, 1681
- Stognienko et al. (1995) Stognienko, R., Henning, T., & Ossenkopf, V. 1995, Astron. Astrophys., 296, 797
- Tauc et al. (1966) Tauc, J., Grigorovici, R., & Vancu, A. 1966, Phys. Status Solidi, 15, 627
- Tomita et al. (2002) Tomita, S., Fujii, M., & Hayashi, S. 2002, Phys. Rev. B, 66, 245424
- Tyutyulkov et al. (2004) Tyutyulkov, N., Ivanov, N., Müllen, K., Staykov, A., & Dietz, F. 2004, J. Phys. Chem., 108, 4275
- Vijh et al. (2004) Vijh, U., Witt, A., & Gordon, K. 2004, ApJ, 606, L65
- Vijh et al. (2005a) —. 2005a, ApJ, 633, 262
- Vijh et al. (2005b) —. 2005b, ApJ, 619, 368
- Wada et al. (1999) Wada, S., Kaito, C., Kimura, S., Ono, H., & Tokunaga, A. T. 1999, Astron. Astrophys., 345, 259
- Wada & Tokunanga (2006) Wada, S. & Tokunanga, A. T. 2006, in Natural Fullerenes and Related Structures of Elemental Carbon, ed. F. J. M. Rietmeijer (Netherlands: Springer), 31
- Waters (2004) Waters, L. B. F. M. 2004, in Astrophysics of dust; Proceedings of an International Symposium held at Estes Park, Colorado, ed. A. N. Witt, G. C. Clayton, & B. T. Draine (Ann Arbor: ASP conference Series, Vol 309), 229–244
- Watson et al. (2001) Watson, M. D., Fechtenkötter, A., & Müllen, K. 2001, Chem. Rev., 101, 1267
- Wright (1988) Wright, E. L. 1988, Nature, 336, 227
- Yang et al. (2007) Yang, L., Park, C.-H., Son, Y.-W., Cohen, M. L., & Louie, S. 2007, Phys. Rev. Letters, 99, 186801
- Zheng et al. (2005) Zheng, G., Irle, S., & Morokuma, K. 2005, J. Chem. Phys., 122, 014708