Massive AGB models of low metallicity: the implications for the self-enrichment scenario in metal poor Globular Clusters
Abstract
Context. We present the physical and chemical properties of intermediate-mass stars models of low metallicity, evolved along the thermal pulse phase.
Aims. The target of this work is to extend to low metallicities, Z=1,2 and , the models previously computed for chemistries typical of Globular Clusters of an intermediate metallicity (Z=0.001), and for the most metal-rich clusters found in our Galaxy (Z=0.004); the main goal is to test the self-enrichment scenario also for metal poor Globular Clusters
Methods. We calculated three grids of intermediate-mass models with metallicities , , and ; the evolutionary sequences are followed from the pre-main sequence throughout the AGB phase, almost until the ejection of the whole envelope. We discuss the chemistry of the ejecta, and in particular the mass fractions of those elements that have been investigated during the many, deep, spectrocopic surveys of Globular Clusters
Results. Although the data for oxygen and sodium are scarce for low metallicity Globular Clusters, the few data for the unevolved stars in NGC 6397 are compatible with the models. Further, we find good agreement with the C–N anticorrelation of unevolved stars in the cluster M15. In this cluster, however, no stars having low oxygen ([O/Fe]) have been detected. The most massive, very metal poor clusters, should contain such stars, according to the present models. At the lowest metallicity , the ejecta of the most massive AGBs have C/O, due to the dramatic decrease of the oxygen abundance. We discuss the possible implications of this prediction.
Key Words.:
Stars: abundances – Stars: AGB and post-AGB – Stars: evolution – Stars: chemically peculiar – Globular Clusters: general1 Introduction
In the last decades, the evolution of massive Asymptotic Giant Branch stars (AGB, i.e. stars with masses during the thermal pulses phase) has been the subject of extended investigations by several research groups, as they were suggested to be the main responsible for the star-to-star differences in the surface chemistry of Globular Clusters (GC) stars. GC stars exhibit considerable differences in the surface abundances of the “light” elements (A30) (Kraft 1994), showing well defined abundance patterns, that involve all the species up to aluminum (see Carretta 2006 for a review on this topic). The idea that these apparent anomalies were formed “in situ” by some non canonical extra-mixing from the bottom of the convective envelope during the Red Giant Branch (RGB) evolution (Denissenkov & Weiss 2001) was frustrated by the discovery that even cool structures like Turn-Off (TO) or SubGiant Branch (SGB) stars showed the same patterns (Gratton et al. 2001), thus indicating that the current observed surface chemical compositions were essentially the same with which the stars formed. This opened the way to “self-enrichment” scenarios: the stars with the anomalous chemistry (second generation —hereinafter SG— stars) formed in an interstellar medium polluted by the winds of an earlier generation of stars (the first generation or FG). Either the winds from massive AGBs (Cottrell & Da Costa 1981; Ventura et al. 2001) or those from fast rotating massive stars (Prantzos & Charbonnel 2006) have been proposed as progenitors of the SG; the latter scenario is described in detail in Decressin et al. (2007) and references therein; here we follow the first hypothesis. The massive AGBs evolve at very short ages (Myr) compared to the typical ages of GCs (Gyr) and achieve, at the bottom of their surface convective zone, a very advanced nucleosynthesis (Hot Bottom Burning, hereinafter HBB, Blöcker & Schönberner 1991; D’Antona & Mazzitelli 1996), the products of which would be carried to the surface by the convective currents (Ventura et al. 2001): the medium in which this generation of stars evolved would thus show the signature of such nucleosynthesis, because the low velocities (Km/s) of these winds allow them to be kept inside the cluster. If the Initial Mass Function (IMF) of the FG is standard (e.g. a Salpeter (1955) or Kroupa et al. (1993) IMF), the gas contained in the massive AGB ejecta is too scarce to give origin to a SG containing the large fraction of today’s cluster stars shown from observation. Therefore, it has been suggested that most of FG stars have been lost, as confirmed by some dynamical and N–body models (D’Ercole et al. 2008) or that the GC has collected the AGB gas from a much larger environment, e.g. if it was born in a dwarf galaxy that today is dispersed (Bekki & Norris 2006, Renzini 2008). A robust prediction from stellar evolution models is that the ejecta from massive AGBs, like those from massive stars (Smith 2006), are expected to be helium-rich. The existence of a helium-rich population () provides an appealing explanation for the existence of some GCs with Horizontal Branches (HBs) showing an extended blue tail (D’Antona et al. 2002). This idea has been elaborated in many subsequent works (e.g. D’Antona & Caloi 2004, Lee et al. 2005, Caloi & D’Antona 2005, 2007, Busso et al. 2007, D’Antona & Caloi 2008). The presence of a fraction of stars enriched in helium has been inferred also by the presence of a blue main sequence in Cen (Bedin et al. 2004; Norris 2004; Piotto et al. 2005), and in NGC 2808 (Piotto et al. 2007).
However, the debate concerning the possible role that massive AGBs may have played in the self-enrichment scenario is still open, because AGB modelling proves to be one of the most delicate and uncertain tasks in the whole context of stellar evolution. This is the reason why results presented by the various groups working on this topic are sometimes extremely different, leading to opposite conclusions concerning many physical and chemical properties of the evolution of this class of objects (Denissenkov & Herwig 2003; Fenner at al. 2004; Karakas & Lattanzio 2007, KL07; Ventura et al. 2001).
Ventura & D’Antona (2005a,b; 2006) showed that the discrepancies in the results obtained by the various investigators are a mere consequence of the different description which they make of some physical phenomena. More in details, Ventura & D’Antona (2005a) showed that the efficiency of the convective model adopted may change substantially the evolution of the main physical properties of these stars, e.g. the duration of the whole AGB phase, the maximum luminosity reached, and the degree of nucleosynthesis achieved at the bottom of the convective envelope. The main two arguments against the self-enrichment scenario raised by some investigators, namely that the winds of even the most massive AGBs should show only a modest extent of oxygen depletion and a great enhancement of the overall CNO abundances (Fenner at al. 2004), at odds with the observational evidence (Ivans et al. 1999), are entirely due to the use of the Mixing Length Theory (MLT, Vitense 1953); when the Full Spectrum of Turbulence (FST, Canuto & Mazzitelli 1991) approach is used to model convection, a much stronger HBB and a much smaller CNO enhancement is found (Ventura & D’Antona 2005a).
The uncertainties associated with mass loss prove to have a smaller impact on the results obtained, as extensively discussed in Ventura & D’Antona (2005b).
Ventura & D’Antona (2008a,b) presented their most recent and updated AGB models to test the self-enrichment scenario in the cases of GCs of intermediate (Z=0.001) and higher (Z=0.004) metallicities. These works were a more systematic treatment of this issue, aimed at integrating their qualitative approach discussed in D’Antona & Ventura (2007), limited only to the Z=0.001 case. The main results of these investigations were that the most massive FST AGB models () produce ejecta whose chemical composition is in agreement with the abundance patterns observed in TO and SGB stars in GCs, in terms of oxygen-sodium, oxygen-aluminum, and carbon-nitrogen anticorrelations. These results require a choice of the nuclear cross-sections involving proton captures by 22Ne, 23Na, 25Mg and 26Mg nuclei, within the range allowed by the uncertainties (Hale et al 2002; 2004). The most extreme anomalies, observed only in low gravity giants, can be explained on the basis of a possible non canonical extra-mixing during the RGB phase, that could be favoured by the lower height of the entropy barrier at the hydrogen-helium interface expected in the stars belonging to the SG (D’Antona & Ventura 2007).
The aim of this work is to extend to lower metallicities the results of the above mentioned investigations. To this scope we calculated new evolutionary sequences for models of intermediate mass with metallicities , , . These computations complete the theoretical framework concerning massive AGBs with chemistry typical of GC stars, and allow to begin to test the validity of the self-enrichment scenario in the case of the most metal-poor GCs, comparing the chemistry of the theoretical ejecta of these models with the abundance patterns shown by the spectroscopic investigations of the GCs M15 (Sneden et al. 1997, Cohen et al. 2005) and NGC 6397 (Carretta et al. 2005).
The paper is organized as follows. Sect.2 describes the physical and chemical ingredients used to calculate the evolutionary sequences. The physical properties of the models are presented in Sect.3. The chemical content of their ejecta, and its dependence on mass and metallicity, is discussed in Sect.4, and compared with the observations in Sect.5.
2 The physical and chemical inputs
All the evolutions presented in this work have been calculated by means of the ATON code for stellar evolution, with the numerical structure described in details in Ventura et al. (1998). We adopt the latest opacities by Ferguson et al. (2005) at temperatures lower than 10000 K and the OPAL opacities in the version documented by Iglesias & Rogers (1996). The mixture adopted is alpha-enhanced, with /Fe (Grevesse & Sauval 1998). The conductive opacities are taken from Poteckhin (2006, see the web page www.ioffe.rssi.ru/astro/conduct/), and are harmonically added to the radiative opacities. Tables of the equation of state are generated in the (gas) pressure-temperature plane, according to the latest release of the OPAL EOS (2005), overwritten in the pressure ionization regime by the EOS by Saumon, Chabrier & Van Horn (1995), and extended to the high-density, high-temperature domain according to the treatment by Stoltzmann & Blöcker (2000). Convection was modelled according to the FST prescription. Mixing of chemicals within convective zones has been treated as a diffusive process. We follow the approach by Cloutman & Eoll (1976), solving for each chemical species the diffusive-like equation:
where D is the diffusion coefficient, for which, given the convective velocity and the scale of mixing , a local approximation () is adopted. The borders of the convective regions are fixed according to the Schwarzschild criterium. We considered extra-mixing from all the formal convective boundaries up to the beginning of the AGB phase: convective velocities are assumed to decay exponentially with an e-folding distance described by the free-parameter , that was set to , according to the calibration provided in Ventura et al. (1998), where the interested reader can also find a complete discussion regarding the variation of the convective velocities in the proximities of the convective borders. No extra-mixing was assumed during the whole AGB phase: these results provide therefore a conservative estimate of the extent of the Third Dredge-up following each thermal pulse.
Mass loss was described according to the Blöcker (1995) formulation, that is more accurate than the basic Reimer’s recipe to describe the steep increase of mass loss with luminosity as the stars climb the AGB on the HR diagram. The full expression is
where is the free parameter entering the Reimers’ prescription, for which we used , according to the calibration based on the luminosity function of lithium rich stars in the Magellanic Clouds given in Ventura et al.(2000). The nuclear network includes 30 elements (up to 31P) and 64 reactions, a full list of which can be found in Ventura & D’Antona (2005a). The relevant cross sections are taken from the recommended values pf the NACRE compilation (Angulo et al. 1999), with only the following exceptions:
-
1.
14N(p,)15O (Formicola et al. 2004)
-
2.
22Ne(p,)23Na (Hale et al. 2002)
-
3.
23Na(p,)24Mg (Hale et al. 2004)
-
4.
23Na(p,)20Ne (Hale et al. 2004)
-
5.
25Mg(p,)26Al (NACRE, upper limits)
-
6.
26Mg(p,)27Al (NACRE, upper limits)
3 The physical properties of the low Z AGB models
The models presented here were calculated assuming metallicities and . The mixtures are assumed to be alpha-enhanced, with , so these two chemical compositions correspond, respectively, to [Fe/H]=–2.3 and [Fe/H]=–1.83, thus encompassing the chemistry of the most metal poor GCs. We have also computed a set of models with metallicity , to allow a direct comparison with the metal poor models by Karakas & Lattanzio (2007) and Herwig (2004).
The main physical properties of the models for the various metallicities are reported in Table 1. We also show the results by Ventura & D’Antona (2008a) for and Ventura & D’Antona (2008b) for . The columns in the table indicate the initial mass of the model, the duration of the two core nuclear burning phases, the core mass at the beginning of the AGB phase (when the hydrogen shell is extinguished after the exhaustion of the central helium), the maximum luminosities and the maximum temperatures at the bottom of the convective envelope reached during the AGB phase, the number of thermal pulses experienced by the star before all the envelope is lost, and the maximum value of the third dredge-up (hereinafter TDU) parameter , defined as the ratio between the mass dredged up in the after-pulse phase and the increase of the core mass (due to the outwards advancing of the CNO burning shell) from the previous pulse.

For a given initial mass M, we see from the 4th column of Table 1 that the core mass increases with decreasing Z, a well known result of the stellar evolution theories; we note a very small difference between the and sets of models.
Fig.1 shows that, independently of the metallicity, during the AGB phase the models follow approximately the same relationship between the core mass at the beginning of the AGB phase () and the maximum luminosity reached () in almost all the range of s spanned by the models; fig.1 shows indeed a flattening of the trend at the lowest metallicities, whereas the higher Z models follow a steeper behaviour. This result can be understood on the basis of the variation with Z of the mass fraction of the chemical species involved in the CNO cycle, which becomes particularly relevant whenever strong HBB conditions are reached, for large M: the “extra-luminosity” gained by the star as a consequence of the proximity of the bottom of the convective envelope to the CNO shell peak (Ventura & D’Antona 2005a) grows with the mass fractions of the CNO elements, hence with Z. This is also the reason why, for the masses very close to the limit for carbon ignition (in the present investigation), the common behaviour that low Z models attain larger luminosities for a given initial mass is reversed, as we can see from columns 1 and 3 of Table 1; the 6model of metallicity reaches a higher luminosity than its lower Z counterparts, despite having a smaller core mass.

The main difference among the various sets of models presented here is the temperature at the bottom of the convective envelope: fig.2 shows that for a given luminosity the low Z models are hotter. This behaviour is again a consequence of the smaller mass fractions of the CNO elements for lower Z, that requires a higher temperature in the shell to reach the same luminosity.

We conclude this analysis discussing the number of thermal pulses (NTP) experienced by the various masses, shown as a function of the initial mass in fig.3. For a given mass M, NTP diminishes with Z, as it should be expected because higher Z models have larger radii, thus suffer a stronger mass loss, that reduces the number of TPs. The main difference among models with different Z is the general trend of the M-NTP relationship: in the lower Z models NTP grows with mass in the whole range of masses investigated, whereas in the intermediate Z case NTP reaches a maximum around 4.5-5and declines with increasing M, because of the larger luminosities reached by the higher Z models for the largest masses, that determines an increase of the mass loss rate.
We therefore find an important difference between the evolutionary properties of high mass models of low and intermediate metallicity. Low Z models are expected to undergo a more advanced nucleosynthesis at the bottom of their outer convective zone, and to experience more TPs.
| (NTP) | |||||||
| 3.0 | 240 | 45.4 | 0.78 | 4.42 | 78 | 24 | 0.7 |
| 3.5 | 174 | 29.0 | 0.81 | 4.52 | 85 | 27 | 0.7 |
| 4.0 | 132 | 20.3 | 0.84 | 4.61 | 92 | 32 | 0.7 |
| 4.5 | 104 | 14.7 | 0.87 | 4.69 | 98 | 35 | 0.6 |
| 5.0 | 85 | 11.3 | 0.91 | 4.77 | 107 | 41 | 0.5 |
| 5.5 | 70 | 9.0 | 0.96 | 4.84 | 120 | 55 | 0.5 |
| 6.0 | 60 | 7.2 | 1.01 | 4.87 | 127 | 71 | 0.3 |
| 3.0 | 248 | 46.5 | 0.78 | 4.41 | 77 | 22 | 0.7 |
| 3.5 | 179 | 29.8 | 0.81 | 4.51 | 85 | 28 | 0.7 |
| 4.0 | 135 | 20.7 | 0.84 | 4.59 | 92 | 32 | 0.7 |
| 4.5 | 106 | 15.1 | 0.87 | 4.68 | 98 | 36 | 0.6 |
| 5.0 | 86 | 11.4 | 0.91 | 4.76 | 105 | 41 | 0.5 |
| 5.5 | 72 | 9.1 | 0.95 | 4.83 | 117 | 47 | 0.5 |
| 6.0 | 61 | 7.4 | 1.00 | 4.90 | 123 | 48 | 0.3 |
| 6.3 | 55 | 6.4 | 1.05 | 4.97 | 126 | 26 | 0.0 |
| 3.0 | 265 | 50.3 | 0.77 | 4.40 | 75 | 22 | 0.7 |
| 3.5 | 188 | 32.2 | 0.81 | 4.55 | 84 | 25 | 0.7 |
| 4.0 | 141 | 22.5 | 0.83 | 4.59 | 91 | 31 | 0.7 |
| 4.5 | 110 | 16.3 | 0.86 | 4.68 | 97 | 34 | 0.7 |
| 5.0 | 89 | 12.4 | 0.90 | 4.76 | 103 | 37 | 0.6 |
| 5.5 | 74 | 9.7 | 0.94 | 4.83 | 110 | 37 | 0.6 |
| 6.0 | 62 | 7.9 | 1.02 | 4.94 | 116 | 30 | 0.3 |
| 6.4 | 56 | 6.6 | 1.05 | 5.00 | 118 | 29 | 0.0 |
| 3.0 | 277 | 55.0 | 0.76 | 4.39 | 73 | 20 | 0.7 |
| 3.5 | 195 | 34.0 | 0.80 | 4.50 | 83 | 24 | 0.7 |
| 4.0 | 146 | 23.5 | 0.83 | 4.57 | 89 | 26 | 0.7 |
| 4.5 | 113 | 17.3 | 0.86 | 4.65 | 95 | 32 | 0.6 |
| 5.0 | 91 | 12.8 | 0.89 | 4.72 | 101 | 31 | 0.5 |
| 5.5 | 75 | 10.1 | 0.94 | 4.80 | 106 | 32 | 0.5 |
| 6.0 | 63 | 8.2 | 1.00 | 4.92 | 112 | 29 | 0.3 |
| 6.3 | 58 | 7.2 | 1.03 | 4.96 | 114 | 28 | 0.3 |
| 3.0 | 319 | 69.5 | 0.65 | 4.26 | 45 | 25 | 0.7 |
| 3.5 | 220 | 42.0 | 0.77 | 4.43 | 78 | 23 | 0.7 |
| 4.0 | 160 | 27.8 | 0.80 | 4.51 | 85 | 31 | 0.7 |
| 4.5 | 122 | 19.6 | 0.83 | 4.60 | 89 | 32 | 0.6 |
| 5.0 | 97 | 14.8 | 0.86 | 4.67 | 93 | 32 | 0.5 |
| 5.5 | 79 | 11.4 | 0.89 | 4.75 | 98 | 32 | 0.5 |
| 6.0 | 66 | 9.5 | 0.96 | 4.85 | 105 | 26 | 0.3 |
| 6.5 | 56 | 7.8 | 1.03 | 4.95 | 110 | 24 | 0.3 |
4 The chemical yields
The chemistry of the ejecta of the AGBs is essential to understand the role that these stars may play in the context of the pollution of the interstellar medium; a comparison between the individual abundances of the mass ejected during their evolution and the chemical composition of the stars in GCs with the anomalous chemistry provides a good test of the reliability of the self-enrichment scenario. Columns 3 to 8 of Table 2 contain the average abundance ratios of the elements mostly investigated in the spectroscopic surveys of GCs, in terms of the quantity [X/Fe]=. The isotopic magnetic ratios of the ejecta are indicated in columns 11 and 12. R(CNO) (shown in col.9) represents the ratio between the global C+N+O abundance of the ejecta and the initial value at the beginning of the evolution, whereas C/O (col.10) indicates the ratio between the carbon and the oxygen abundance. The table also includes the results for higher Z models presented in Ventura & D’Antona (2008a;b).
4.1 The CNO elements
We start our analysis by examining the abundances of the CNO elements, that during the AGB evolution are modified at the surface of the stars by TDU and HBB.


| Y | [C/Fe] | [N/Fe] | [O/Fe] | [Na/Fe] | [Mg/Fe] | [Al/Fe] | R(CNO) | C/O | |||
| 3.0 | 0.259 | 1.78 | 3.17 | 1.54 | 2.24 | 1.03 | 1.46 | 72.68 | 0.65 | 2.33 | 0.80 |
| 3.5 | 0.281 | 1.43 | 3.11 | 1.32 | 2.19 | 0.90 | 1.30 | 57.03 | 0.48 | 1.65 | 0.58 |
| 4.0 | 0.305 | 1.12 | 2.97 | 1.08 | 1.90 | 0.71 | 1.16 | 39.23 | 0.41 | 1.87 | 0.50 |
| 4.5 | 0.321 | 1.07 | 2.80 | 0.83 | 1.51 | 0.54 | 1.19 | 26.77 | 0.65 | 7.23 | 1.35 |
| 5.0 | 0.333 | 0.72 | 2.60 | 0.45 | 0.94 | 0.24 | 1.26 | 14.68 | 0.74 | 16.90 | 2.39 |
| 5.5 | 0.343 | 0.33 | 2.14 | -0.07 | 0.28 | -0.45 | 0.48 | 5.49 | 0.93 | 9.94 | 0.74 |
| 6.0 | 0.351 | -0.58 | 1.40 | -1.43 | -0.20 | -0.53 | 0.20 | 0.95 | 2.62 | 17.02 | 0.42 |
| 3.0 | 0.258 | 1.29 | 2.79 | 1.04 | 1.93 | 0.71 | 0.88 | 28.04 | 0.66 | 0.71 | 0.30 |
| 3.5 | 0.279 | 1.12 | 2.77 | 0.96 | 1.88 | 0.72 | 0.99 | 26.07 | 0.54 | 0.85 | 0.31 |
| 4.0 | 0.300 | 0.82 | 2.64 | 0.77 | 1.61 | 0.58 | 0.93 | 18.74 | 0.47 | 1.24 | 0.30 |
| 4.5 | 0.320 | 0.73 | 2.46 | 0.51 | 1.17 | 0.43 | 1.10 | 12.36 | 0.65 | 6.40 | 1.00 |
| 5.0 | 0.315 | 0.45 | 2.26 | 0.19 | 0.70 | 0.20 | 1.23 | 7.51 | 0.68 | 14.47 | 1.92 |
| 5.5 | 0.343 | 0.12 | 1.93 | -0.30 | 0.22 | -0.18 | 0.94 | 3.43 | 0.89 | 16.57 | 0.91 |
| 6.0 | 0.350 | -0.50 | 1.48 | -1.02 | -0.10 | -0.21 | 0.61 | 1.16 | 0.99 | 27.95 | 0.72 |
| 6.3 | 0.354 | -0.60 | 1.42 | -1.05 | -0.14 | -0.02 | 0.69 | 1.00 | 0.97 | 48.11 | 1.02 |
| 3.0 | 0.253 | 0.99 | 2.33 | 0.80 | 1.51 | 0.59 | 0.63 | 11.10 | 0.45 | 0.37 | 0.18 |
| 3.5 | 0.263 | 0.50 | 2.12 | 0.52 | 1.43 | 0.50 | 0.54 | 8.29 | 0.35 | 0.43 | 0.13 |
| 4.0 | 0.295 | 0.50 | 2.19 | 0.48 | 1.32 | 0.51 | 0.69 | 7.00 | 0.38 | 0.70 | 0.17 |
| 4.5 | 0.313 | 0.30 | 2.03 | 0.20 | 0.98 | 0.41 | 0.96 | 4.63 | 0.69 | 3.58 | 0.49 |
| 5.0 | 0.329 | 0.01 | 1.84 | -0.12 | 0.58 | 0.26 | 1.16 | 2.89 | 0.49 | 11.79 | 1.51 |
| 5.5 | 0.340 | -0.25 | 1.61 | -0.46 | 0.29 | 0.15 | 1.16 | 1.67 | 0.59 | 20.43 | 1.57 |
| 6.0 | 0.360 | -0.65 | 1.36 | -0.58 | 0.15 | 0.20 | 1.02 | 0.94 | 0.31 | 36.20 | 1.36 |
| 6.4 | 0.360 | -0.65 | 1.36 | -0.53 | 0.12 | 0.21 | 0.97 | 0.95 | 0.27 | 40.40 | 1.32 |
| 3.0 | 0.248 | 0.84 | 2.21 | 0.92 | 1.16 | 0.57 | 0.65 | 9.6 | 0.30 | 0.32 | 0.16 |
| 3.5 | 0.265 | 0.51 | 2.18 | 0.77 | 1.30 | 0.55 | 0.66 | 7.9 | 0.20 | 0.30 | 0.14 |
| 4.0 | 0.281 | 0.14 | 2.02 | 0.44 | 1.18 | 0.48 | 0.55 | 4.9 | 0.18 | 0.42 | 0.13 |
| 4.5 | 0.310 | 0.12 | 1.89 | 0.19 | 0.97 | 0.43 | 0.85 | 3.1 | 0.30 | 2.19 | 0.31 |
| 5.0 | 0.324 | 0.13 | 1.70 | -0.06 | 0.60 | 0.35 | 1.02 | 2.1 | 0.56 | 8.37 | 0.99 |
| 5.5 | 0.334 | -0.41 | 1.51 | -0.35 | 0.37 | 0.28 | 1.10 | 1.3 | 0.32 | 15.68 | 1.48 |
| 6.0 | 0.343 | -0.62 | 1.35 | -0.40 | 0.31 | 0.27 | 1.04 | 0.97 | 0.22 | 27.87 | 1.56 |
| 6.3 | 0.348 | -0.68 | 1.33 | -0.37 | 0.30 | 0.30 | 0.99 | 0.94 | 0.18 | 30.63 | 1.39 |
| 3.0 | 0.277 | 1.41 | 0.60 | 0.62 | 0.44 | 0.59 | 0.68 | 4.7 | 2.23 | 0.36 | 0.18 |
| 3.5 | 0.269 | 0.08 | 1.59 | 0.46 | 1.07 | 0.50 | 0.33 | 2.5 | 0.15 | 0.14 | 0.11 |
| 4.0 | 0.281 | -0.07 | 1.52 | 0.30 | 1.17 | 0.48 | 0.32 | 2.0 | 0.15 | 0.17 | 0.10 |
| 4.5 | 0.298 | -0.44 | 1.52 | 0.21 | 1.00 | 0.47 | 0.43 | 1.8 | 0.08 | 0.37 | 0.11 |
| 5.0 | 0.313 | -0.55 | 1.44 | 0.09 | 0.89 | 0.45 | 0.57 | 1.4 | 0.08 | 0.92 | 0.16 |
| 5.5 | 0.328 | -0.62 | 1.37 | 0.01 | 0.76 | 0.43 | 0.70 | 1.2 | 0.07 | 2.22 | 0.28 |
| 6.0 | 0.329 | -0.78 | 1.25 | 0.01 | 0.63 | 0.42 | 0.71 | 1.0 | 0.05 | 4.56 | 0.48 |
| 6.5 | 0.330 | -0.85 | 1.19 | 0.05 | 0.60 | 0.43 | 0.66 | 0.96 | 0.05 | 5.80 | 0.52 |
The two panels of fig.4 show 12C and 14N in the ejecta of our models, as a function of the initial mass M of the star, for the 5 metallicities discussed. We also report the values obtained by Herwig (2004) (hereinfter H04) and by Karakas & Lattanzio (2007) to allow a comparison with sets of models provided by different groups: these models have a metallicity .
[C/Fe] is large for low masses, because of the increase of the carbon abundance due to the occurrence of the TDU. The trend with mass is negative, because the smaller is the mass of the envelope, the larger is the increase of the carbon mass fraction as a consequence of the TDU. More massive models achieve more easily HBB conditions, with the consequent depletion of the envelope 12C due to proton captures at the bottom of the external convective zone; for masses close to the limit for carbon ignition [C/Fe] is negative (see col.8 of Table 1).
When comparing in fig.4 the lines corresponding to different metallicities, we see that [C/Fe] increases as Z diminishes: this is a consequence of the fact that the same quantity of carbon dredged-up to the surface determines a larger increase of the carbon mass fraction in the envelope of the low Z models. The number of TPs and the efficiency of the TDUs are not relevant in determining the differences observed (see Table 1). The differences among the various metallicities vanish at the largest masses, where all sets of models tend to a limit value of [C/Fe], independently of Z. In these stars TDU is practically not operating, and strong HBB favours carbon destruction, for all Z’s; the stronger depletion of carbon that is found at low Z’s at the beginning of the AGB phase (due to the higher ’s) is counterbalanced by the larger carbon equilibrium abundances expected when the full CNO cycle is activated.

[N/Fe] shows a trend with mass that is similar to [C/Fe] (see the right panel of fig.4), because 14N is produced at the bottom of the envelope via proton capture by 12C nuclei; we recall that nitrogen production requires only mild HBB conditions, with no necessity of activating the full CNO cycle. Contrary to carbon, [N/Fe] is positive in all cases, because it is produced and never destroyed. The nitrogen yields become Z-independent in the range , for the same reasons discussed in the analysis of the carbon yields.
The opposite effects of the HBB for carbon and for nitrogen can be detected in the different negative slopes of the variations with mass of [C/Fe] and [N/Fe]: the slope of the former is much higher, whereas the decrease of [N/Fe] with mass is more modest, as the stronger HBB acts to destroy carbon and increase [N/Fe].
The interpretation of the average oxygen abundance ratios of the ejecta, shown in the left panel of fig.6, and of their trend with mass and metallicity, is less straightforward than for carbon and nitrogen. Oxygen is dredged-up in the phases following the TPs only when the TDU is very efficient; HBB leads to oxygen depletion, but, unlike carbon, this holds only when the full CNO cycle is activated at the bottom of the convective envelope, when the temperature exceeds MK. Both factors explain while in all cases [O/Fe] decreases with increasing mass, and becomes negative for the most massive models. For the lowest masses of our samples, for which TDU is the main cause of the change of the surface oxygen, [O/Fe] increases as Z decreases, for the same reasons outlined above. On the other hand, when M increases, the higher temperatures at the bottom of the envelope attained by the low Z massive models leads to a stronger depletion of the surface oxygen; this is enhanced by their lower mass loss rates, because, unlike their higher Z counterparts, they start loosing most of the mass of their envelope when the surface oxygen abundance has already considerably diminished (see the right panel of fig.6). The behaviour of [O/Fe] is thus not monotonic with Z.


In this case, at odds with what found for carbon and nitrogen, the oxygen yields varies with Z even for large masses, because in the low metallicity, massive models we expect a very strong depletion of the surface oxygen, so that the overall reduction factor is almost a factor larger in the models compared to the case.
The sum of C+N+O abundances of the ejecta, shown in the 9th column of
Table 2, diminishes with mass, as a consequence of the
smaller impact of the TDU for the highest masses, and approaches unity for
the most massive models; this behaviour is independent of Z.
The C/O ratio, reported in the 10th column of Table 2, is more
sensitive to Z, and tends to decrease with metallicity. For small masses,
HBB is negligible, and the stronger impact of the TDU in the low Z models
favours a higher C/O ratio (see both panels of fig.4); for the masses
close to the limit for carbon ignition, the very strong depletion of oxygen
found in the low metallicity models (see the left panel of fig.6)
leads to C/O ratios sligthly below unity
for , and at . is the threshold metallicity below which
O-poor yields, leading to the situation where C/O exceeds unity at the
surface, are to be expected.
We conclude this discussion with a comparison of our yields with those by KL07 and H04. We see from fig.4 and 6 that our CNO abundances are sistematically lower than those by KL07, so we find a much greater CNO enhancement when the KL07 models are adopted; also, [C/Fe] is always positive in the KL07 case. The key role in this context is played by the treatment of convection: in the models presented here convection was modelled according to the FST treatment, whereas the KL07 models were calculated by means of the MLT description, that provides a much less efficient description of the convective instability. As discussed in Ventura & D’Antona (2005a), a more efficient convection model favours larger temperatures at the bottom of the convective envelope, larger luminosities, shorter life-times, and a faster loss of the mass of the envelope. The above explanation likely leads to the situation observed, where the KL07 models experience more TPs than our models. For example, our 3, 4, and 5 models experience, respectively, 24,32,41 TPs, compared to the 40,76 and 138 TPs suffered by the same masses by KL07. The TDU episodes following these TPs results in large amounts of carbon being dredged-up to the surface, with the consequent increase of the abundances of all the CNO elements. The difference between our yields and those by KL07 increases with mass, because the higher temperatures attained at the base of the convective envelope lead, for a given mass, to a more efficient HBB.
The C and N yields by H04 are lower than those by KL07, because the H04 models experience a much smaller number of TPs due to the higher mass loss rate adopted (that is a Blöcker (1995) law, enhanced by a factor 5 compared to ours), thus reducing the amount of carbon that is dredged-up to the surface (and that can be eventually converted to nitrogen). Compared to ours, the CN H04 yields are higher, the difference increasing with mass, because of the stronger HBB conditions experienced by our models at a given mass (for example, the average temperature at the bottom of the convective envelope for the 6model is 120MK in our case, and 100MK in H04). The difference in the oxygen yields (see the left panel of fig.6) also increases with mass between us and H04 models. In the interpretation of the differences between our results and those by H04, it is important to stress that the different efficiency of the TDU plays also a role: in our models no extra-mixing is assumed from the bottom of the convective envelope, whereas an exponential overshooting is adopted in the H04 models.
The differences due to the metallicity and to the treatment of convection can be more easily understood when the yields of the models are shown on the C-N plane; this will also be of help when discussing the self-enrichment scenario on the basis of the observed C-N abundances of SGB stars in M15. The [N/Fe] values of the 5 sets of models discussed here and the KL07 models are shown as a function of [C/Fe] in fig.5. We note that all the models trace approximately a straight line in the C-N plane, to confirm that CN cycling operates at the bottom of the envelope. The KL04 models are located in the right-upper portion of the plane, whereas our models occupy the lower region. In agreement with the discussion following the presentation of the carbon and nitrogen yields, we find that, independently of Z, all the curves corresponding to the different metallicities converge to the same locus on the plane, that is ([C/Fe],[N/Fe]). This does not hold for the KL07 models, for which a minimum increase of carbon and nitrogen of, respectively, a factor of and are found.
4.2 Sodium
The sodium content of the ejecta of AGBs is an essential result in the way to understand the star-to-star differences of the GCs stars in the context of the self-enrichment scenario: the oxygen-sodium anticorrelation is by far the most investigated anticorrelation that was confirmed by deep spectrospic analysis performed on many GCs (Carretta et al. 2006).

The surface abundance of sodium is determined by the two processes that change the surface chemistry of AGBs. TDU tends to increase the surface sodium mass fraction via dredging-up of 22Ne from the ashes of the burning shell; HBB favours a further increase of the surface sodium as far as the temperature at the bottom of the envelope does not exceed MK, above which the destruction channels dominates. These considerations allow us to understand the tracks shown in fig.7, that show the content of sodium (in terms of [Na/Fe]) as a function of the initial mass of the ejecta of the various sets of models presented here; we also show the results by KL07 and H04.
The negative trend of [Na/Fe] vs M found for all Z’s can be explained, as it was for the carbon and oxygen, by the fact that in the lowest masses models we see mainly the effects of TDU, acting to enhance the surface sodium, whereas at large M’s HBB is the dominant mechanism, leading to smaller sodium contents the larger is the temperature at the bottom of the convective envelope. As for oxygen, we do not find a monotomic behaviour with Z, because for low metallicities the bottom of the surface convective zone of massive AGBs becomes so hot to favour sodium depletion.
The comparison of our results with the yields by KL07 confirms that it is the temperature in the innermost layers of the outer convective zone to drive physically and chemically the evolution of AGBs. KL07 sodium yields are sistematically higher than ours, due to the more numerous TDU episodes, that carries to the surface more 22Ne, available to be converted into sodium during the quiescent CNO burning phase; the milder efficiency of HBB prevents the strong depletion of the surface sodium in the more massive models found in our computations.
Our sodium yields are more similar to those by H04; the slope of the [Na/Fe]vs. mass relation is steeper in our case, due to the strong sodium depletion achieved in our high mass models.
Before proceeding further, it is mandatory to remember that, unlike the CNO elements, the reliability of the results obtained for sodium is extremely low, because the cross-sections of the three key-reactions relevant to determine the sodium yield, i.e. the creation channel 22Ne(p,)23Na, and the two destruction channels 23Na(p,)24Mg and 23Na(p,)20Ne, are uncertain by up to 3 orders of magnitude (Hale et al.2002; 2004). Ventura & D’Antona (2008a) showed that according to the cross-sections adopted, the average sodium mass fraction of the yields of their most massive intermediate metallicity AGB models would be increased or diminished compared to the initial abundance (see their fig.9). A more detailed investigation on this topic was made by Izzard et al. (2007), who showed that the sodium yields of AGB models of low metallicity was highly uncertain, and that the poor knowledge of the cross-sections of the relevant proton capture reactions determine an uncertainty associated to the expected sodium yield of the order of .
4.3 Aluminum
Aluminum is seen to correlate with sodium and to be anticorrelated to oxygen and magnesium in stars belonging to GCs where clear star-to-star differences are observed. Among all the light elements involved in the commonly studied abundance patterns, aluminum is the species showing the largest spread, the maximum detected abundances being of the order of [Al/Fe] in all the stars showing a great depletion of oxygen and an enhancement of sodium. Gratton et al. (2001), in an analysis of the surface chemistry of TO and SGB stars in the GC NGC 6752, found stars with [Al/Fe]=1. A similar aluminum enhancement was also detected by Sneden et al. (2004) in giants of low and high gravity in the two GCs M3 and M13. A more recent work by Smith et al. (2005) on M4, unfortunately limited to giants, evidentiated the presence of aluminum rich stars, with [Al/Fe]=0.8. Finally, Sneden et al. (1997) detected a few stars in the GCs M15 and M92 (both clusters have a metallicity more appropriate to this investigation) with [Al/Fe], although even in this case the study is focused on bright giants.
Aluminum is produced in AGBs by HBB via the activation of the Mg-Al chain; this requires temperatures of the order of 80MK. TDU also determines an indirect aluminum enhancement, because the two magnesium isotopes produced in the 3 burning shell are convected to the surface, where they synthesize aluminum via proton capture. Ventura & D’Antona (2008a) found that, when the upper limits for the cross-sections of the proton capture reactions by the heavy magnesium isotopes are adopted, the most massive among their AGB models of intermediate metallicity produce great amounts of aluminum, with an average increase of a factor , in agreement with the observations of GCs of that chemistry, like M3 and M13 (see the corresponding lines in Table 2). The results by Ventura & D’Antona (2008b) (obtained by using the same upper limits for the above mentioned proton capture reactions, as also in the present investigation) confirmed the possibility of producing aluminum at the surface of massive AGBs also for more metal rich models, though in this case the maximum enhancement found was [Al/Fe].
The present results confirm the outcome of the above mentioned investigations, as can be seen by noting the results concerning the magnesium and aluminum yields in Table 2. Here we also show the 25Mg/24Mg and 26Mg/24Mg ratios, that are extremely dependent on the assumed rates of the proton capture reactions by the two heavy magnesium isotopes. We note in Table 2 that for low metallicity models with the trend [Al/Fe] vs M is not monotonic for the whole range of masses investigated: for we find an aluminum enhancement by a factor of for masses , whereas slightly lower values ([Al/Fe]) are predicted for the masses close to the limit for carbon ignition. This effect is due to the very high temperatures achieved by these models at the bottom of their external convective zone, that becomes sufficient to activate efficiently the proton capture reaction by 27Al nuclei. On the basis of these computations, the maximum enhancement reached by the most massive models of low metallicity is of the order of [Al/Fe].
5 The observed abundance patterns in low metallicity Globular Clusters stars
Ventura & D’Antona (2008a,b) compared the yields of AGB models with the observed abundance patterns evidentiated by deep spectroscopic investigations of GC stars with [Fe/H] and [Fe/H]. We extend here the analysis to lower Z, making use of the new models presented in the previous sections.
Unfortunately, the data for the lowest metallicity clusters are quite scarce, and only few data are available for non evolved or scarcely evolved stars.
We will use data for the clusters M15 and NGC 6397. Harris (2003) lists [Fe/H]=–2.26 for M15, and [Fe/H]=–2.0 for NGC 6397. For the latter cluster, we also have a measure of the –enhancement, [/Fe]=+0.340.02 (Gratton et al. 2003), while Strömgren photometry provides [Fe/H]=–1.83 0.04 and [/Fe]=0.3 (Anthony-Twarog & Twarog 2000). In our –enhanced models, Z=2 corresponds to [Fe/H]=–2.3, and Z=6 corresponds to [Fe/H]=–1.82, so we will use these two sets for the respective comparisons.
Sneden et al. (1991) detected a clear spread in the surface oxygen abundances of giant stars in the two metal-poor GCs M15 and M92. Their fig.12 shows that there may be some correlation of the oxygen abundance with the evolutionary status of the individual objects. More luminous stars, closer to the RGB tip, show the lowest oxygen abundances, although a wide spread is found at all luminosities. For the few stars for which also the nitrogen abundance was measured a N-O anticorrelation exists, indicating the presence of material processed by proton capture nucleosynthesis. A more complete analysis of M15 giants, focused on the abundances of oxygen, sodium, magnesium and aluminum, was presented by Sneden et al. (1997). The main result of this investigation is that oxygen is anticorrelated with sodium, and magnesium anticorrelates with aluminum, indicating again the signatures of proton capture processing. Carretta et al. (2005) examine the CNO abundances for several clusters, including the low Z cluster NGC 6397. Data for dwarf and subgiants are available for CNO and Na. Finally, Cohen et al. (2005) present an analysis of a large sample of spectra of subgiants stars at the base of the RGB of M15, focused on the abundances of carbon and nitrogen.
A straight comparison between the yields of our models and the observations can be used as a test of the self-enrichment scenario only in the case that the observed abundances have not been altered by any in-situ process, to ensure that the chemistry observed is the same with which the stars formed. This is surely the case for the Cohen et al. (2005) and Carretta et al. (2005) data, because the sample of stars observed are in evolutionary stages for which advanced nucleosynthesis in their internal regions can be ruled out on the basis of their low internal temperatures. The same conclusion does not necessarily hold for the two surveys by Sneden and coworkers, that involve only bright giants, close to the RGB tip. Canonical stellar models predict the first dredge-up as the only episode up to the helium flash that can alter their surface chemistry, changing only the abundances of the two carbon isotopes and of nitrogen, leaving unvaried the abundances of heavier nuclei; yet, the investigations by Sweigart & Mengel (1979), and Cavallo et al. (1998) showed that in low Z () giants rotationally-driven meridional circulation currents, if present, can penetrate deeply into internal regions, because the entropy barrier associated with the drop of the hydrogen content, that prevents the inwards penetration of the surface convetive layer, is more internal. More recently, Eggleton et al. (2008), based on 3D numerical simulations, found that a deep mixing mechanism associated to a small molecular weight inversion must be operative in all low-mass giants. An observational indication that oxygen can attain lower abundances in luminous giants came from the early M13 data by Sneden et al. (2004). Furthermore, Carretta et al. (2006) showed that the lowest oxygen abundances in NGC 2808 are present only among giants. Based on these indications, D’Antona & Ventura (2007) reproduced the most extreme oxygen and sodium abundances by applying deep extra-mixing from the bottom of the surface convective envelope of giant stars, based on the assumption that stars born from the ashes of an early generation of massive AGBs should have a higher helium mass fraction, that would decrease the height of the above mentioned entropy barrier that prevents the inwards penetration of the convective envelope. These results indicate that the surface chemistry of low-Z giants can be altered during their RGB evolution, particularly after the CNO burning shell crosses the chemical discontinuity left behind by the first dredge-up episode. Based on this, we proceed to a full, detailed comparison between our theoretical yields and the observed abundance patterns mainly for the case of the O–Na anticorrelation in NGC 6397 and in the case of the M15 C and N data by Cohen et al. (2005). In spite of the warnings made above, we will also comment on the O, Na, Mg and Al data by Sneden et al. (1997) for M15 giants.
5.1 The O–Na anticorrelation in NGC 6397
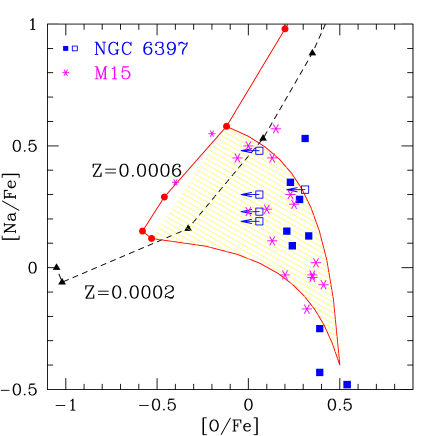
Figure 8 shows the Na vs. O data for NGC 6397 subgiants and dwarf stars listed by Carretta et al. (2005). Upper limits are indicated by open squares with arrows. We also report the data of M15 giants by Sneden et al. (1997). An exam of their Figure 4 shows that also the data for M 92 occupy the same region of the Na–O plane. The Na–O yields of our models from table 2 are reported in the figure. It is evident that the models predict much lower oxygen abundance, if the SG stars were formed from undiluted matter from the AGBs. Nevertheless we can reproduce the abundances of these clusters if we make the hypothesis that the matter from the ejecta of stars of initial mass 6.4 to 5is diluted with pristine matter at the level of %111The dynamical models by D’Ercole et al. (2008) have shown that the pristine gas remaining in the outskirts of the globular cluster at the end of the supernova epoch, falls back into the cluster core, where it mixes with the AGB ejecta and forms the SG stars. Depending on the cluster mass and history, the SG can be totally or in part made up exclusively by the AGB ejecta, or its formation may directly start in the mixed gas.. The two solid curves in the figure represent the composition of matter having the starting abundance of the 6.4 and 5.0 ejecta, diluted at different percentages with pristine matter. If we make the hypothesis of dilution, the helium content of the SG stars can be obtained by considering the helium abundance given in Table 2 for the 6.4 and 5 stars (Y=0.33-0.36) and diluting it by half with matter having the Big Bang initial abundance Y=0.24. The resulting Y0.28–0.30, is consistent with the “short” blue HB of this cluster: an extremely blue HB would be obtained if the AGB matter forming the SG had been undiluted. In fact, if the helium content of the SG were as high as Y=0.36, both a very blue HB (e.g. D’Antona & Caloi 2004) and a split of the main sequence (Piotto et al. 2007) as in the cluster NGC 2808 would appear in the data.
The few M15 data shown in Fig. 8 refer to giants, and our models for the metallicity Z=2 appropriate for M15, predict SG stars with low sodium and very low oxygen abundances in these same stars, depending on reaction rates. There are currently not enough data available to test these predictions. As for the sodium, we have already noticed that the initial value of 20Ne in the models and the cross sections can affect very much the final abundance. On the contrary, the oxygen yield can not be changed, unless we re discuss the efficiency of convection in our models. In the following Section, discussing the C and N abundances in M15, we will see that some of its subgiants are consistent with the abundances in our most massive models, so that we should expect to find very low oxygen abundances is these same stars, but data are not available to falsify the model.
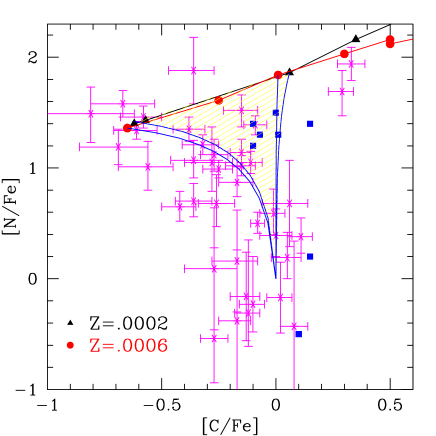
5.2 The C–N anticorrelation in M15
The main finding by Cohen et al. (2005), shown in fig.9 and based on the abundances included in their Table 2, is the existence of a clear anticorrelation between the surface abundances of carbon and nitrogen: a group of star (on the left-upper part of fig.9) shows a large enhancement of nitrogen ([N/Fe]) and a strong depletion of 12C (([C/Fe]). In Fig. 9 we also add Carretta et al. (2005) data for the cluster NGC 6397. Overimposed to the observed points is our dilution region, obtained assuming different degrees of dilution between matter with the chemistry of models with and , and masses between 6.4 and 5.5, and gas with the original “standard ” chemistry222The mass range from which we think the polluting matter comes from is quite small. This is indeed the reason why models for the formation of multiple populations in globular clusters require that the first generation initial mass must be much larger than the mass observed today (e.g. D’Ercole et al. 2008). We see that the theoretical carbon and nitrogen abundances reproduce satisfactorily the observed patterns.
The few data for NGC 6397 are well consistent with the dilution expected from the oxygen and sodium data shown in Fig. 8. On the contrary, a direct comparison between Figure 8 and 9 can not be made for M15, as the oxygen and sodium abundances refer to different stars. Nevertheless, the C and N data require that the stars with the lowest carbon abundances are made up from undiluted ejecta of the most massive AGBs. We predict that these stars should have very low oxygen abundances.
In their comparison between their observed abundances and the previous models by Ventura et al. (2002) (that are in good agreement with the present yields) Cohen et al. (2005) argue that the agreement is only qualitative, as the models fail to reproduce the great nitrogen enhancement evidentiated by the difference between their lowest and highest values ([N/Fe] and [N/Fe] in their fig.4). This conclusion is actually somewhat misleading. In fact, nitrogen, whatever mixture is used, is the least abundant among the CNO elements, so that the final nitrogen yield (proportional to the overall C+N+O abundance , under strong HBB conditions) turns out to be almost independent of the initial nitrogen adopted, provided that the same carbon and (expecially) oxygen are used. We confirmed this conclusion by calculating a 6model with metallicity with an initial abundance of nitrogen [N/Fe]=–0.5: we find that the N yield as function of the mass is practically the same (0.05 dex lower) as in Table 2.
Interestingly, Cohen et al. (2005) compare their C-N trend for M15 with those from other clusters with larger metallicity, and find that, independently of [Fe/H], the observations encompass the same range of values of [C/Fe] and [N/Fe]. This result is consistent with our finding that for the models experiencing strong HBB involving full CNO burning and in which the effects of TDU are negligible the yields of carbon and nitrogen become Z-independent, and converge to the most extreme values detected by the spectrospic investigations quoted by the authors.
5.3 The Mg – Al anticorrelation
Very few data are available, but Sneden et al. (1997) list Mg and Al abundances for the same sample of M15 giants for which we have shown the O–Na data in Fig.8. Figure 3 in their paper shows the trend of Na, Mg and Al with respect to [O/Fe] in this sample. Our data in Table 2 for Z=2 are consistent with these trends: low oxygen corresponds to low magnesium and high sodium. Also in this case, however, we must NOT consider the most extreme yields of the 6.4 and 6.0, as no stars with very low oxygen (and with low sodium, but we regard this result less reliable) have yet been found in the cluster. The lack of low oxygen stars in M15 requires an explanation, and however stars with very low oxygen should be searched for in very low metallicity clusters. If none is found, either the present models achieve too strong HBB, or the problem is shifted to the modalities of formation of the lowest metallicity clusters, in the sense that some other mechanism prevents the formation of SG stars directly from the ejecta of the most massive AGBs.
5.4 The C/O ratio in low metallicity environments
Table 2 shows that the C/O ratio in the ejecta of the lowest metallicity AGB models become increasingly larger as the mass of the model increases, and it is definitely larger than one in the 6 model of Z=10-4. Thus, during their life, the most massive AGBs of low metallicity become Carbon stars, although this characteristic is not due to dredge up of carbon, but to the very strong oxygen depletion due to proton captures on oxygen nuclei during the hot bottom burning. The occurrence of Carbon–star stages of evolution in massive, low Z, AGBs has been already discussed in Ventura et al. (2002) 333A different mechanism producing a C–rich stage in massive AGBs is described by Frost et al. 1998. In that case, the occurrence is due to the combined action of the third dredge up and of mass loss that reduces the action of HBB in the latest phases of the AGB life, and observational counterparts may have been identified in the obscured, C–rich stars of high bolometric luminosity (van Loon et al. 1999).. A full explanation of the O–Na anticorrelation requires that AGB matter is diluted with pristine cluster matter in most of the SG stars (Ventura & D’Antona 2008), so it is not clear how large are the C/O ratios we should expect in the low Z clusters. A full discussion of these results is postponed to an analysis including results of modeling at smaller metallicities. Here we limit it to a few speculative issues.
-
•
Table 2 shows that the ratio C/O from the massive AGB ejecta becomes larger going from higher to lower metallicity clusters; this matter is also expected to be extremelly oxygen–poor. This theoretical prediction requires observational verification.
-
•
it is curious that clusters of metallicity , in which we should positively predict that some second generation stars would have C/O1, do not exist. There are, however, many carbon-rich halo stars with metallicities smaller than (e.g. Beers & Sommer-Larsen 1995, Beers and Christlieb 2005). Do carbon rich grains form from the carbon not locked into CO, even if the metallicity is so low? Does this affect the formation of second generation stars? Dust formation in the envelopes of giants is found in C–rich models of stellar envelopes at least down to the metallicity of the Small Magellanic Cloud (Wachter et al. 2008).
-
•
in the ejecta having C/O1, the carbon abundance is small ([C/Fe]0, Table 2), so that the possible observational counterparts can not be looked for among CEMP (carbon enhanced metal poor) stars, defined as stars for which [C/Fe]1 (Beers and Christlieb 2005). These models also have extremely low C/N ratios, as nitrogen is very large due to HBB (both carbon and oxygen contributing to it). These are then NEMPs (nitrogen enhanced metal poor stars) in the definition by Johnson et al. (2007), who failed to find any of such stars by searching among extremely metal poor stars. Notice that a ratio [C/N] is expected from Table 2, but not even less extreme ratios, like [C/N] —as expected from the models by Herwig (2004)— were found in this survey. The presence of enhanced C and N in extremely metal poor low mass stars presently observed is generally attributed to mass transfer from a previously evolving AGB companion (e.g. Lucatello et al. 2005). Johnson et al. (2007) attribute the lack of NEMPs to the shortage of binaries with the extreme mass ratios required to produce them.
-
•
the presence of large C/O ratios —and of total low C and O abundances, could be detected by looking at the properties of gas and dust in the circumnuclear region of the very high redshift QSO (e.g. Maiolino et al. 2004).
6 Conclusions
We present new evolutionary models focused on the AGB phase of intermediate mass stars () with metallicites . These results complete previous investigations of higher Z AGB models by our group. We find that low Z models, due to the lower amount of CNO present in their H-burning layers, attain larger temperatures both in the CNO burning shell and at the bottom of their surface convective region, thus achieving more easily than their higher Z counterparts HBB conditions. For a given luminosity, they suffer a smaller mass loss (due the their smaller radii), thus the total number of thermal pulses that they experience is higher. In the low mass regime (), where the effects of the third dredge-up dominate over hot bottom burning, the sum of C+N+O along with Na, Mg and Al increase with decreasing Z (the Al production in these models is favoured by the use of the upper limits of the cross sections of the proton capture reactions by the magnesium isotopes). For masses HBB takes over as the main physical process changing the surface chemistry, and the abundances of those elements that at high temperatures suffer destruction by proton capture, primarily oxygen and sodium, diminish for decreasing Z; conversely, the content of carbon and nitrogen are seen to be Z-independent for masses close to the limit for carbon ignition in degenerate conditions. A comparison of our yields with those by a different research group confirms that the treatment of convection plays the most striking role in determining the essential evolutionary properties of these class of objects.
The O-Na anticorrelation shown by NGC 6397 stars can be explained if
dilution at a level of between the mass ejected by AGBs
and pristine matter is adopted; this is also in good agreement with the
resulting helium mass fraction of the SG stars, Y, that is
consistent with the morphology of the HB of this cluster.
A comparison with recent spectroscopic results of CN abundances in low
luminosity M15 giants shows that the chemistry of the theoretical ejecta
of our models agree with the most extreme chemistries observed, i.e.
with the stars showing the largest nitrogen enhancement and carbon reduction.
This seems to confirm even at these low metallicities that self-enrichment
by massive AGBs is responsible for the star-to-star differences observed,
though more observational results are needed before drawing more robust
conclusions.
Very oxygen–poor stars ([O/Fe]) are predicted to exist, as SG stars formed by the winds of our most massive models of , at least in the most massive very low metallicity GCs.
Acknowledgements.
The authors are grateful to the anonymous referee for his detailed and careful reading of this work, that greatly helped improving the quality of the manuscriptReferences
- (1) Angulo, C., Arnould, M., Rayet, M. et al. 1999, Nucl. Phys. A, 656, 3
- Bedin et al. (2004) Bedin, L. R., Piotto, G., Anderson, J., Cassisi, S., King, I. R., Momany, Y., Carraro, G. 2004, ApJ, 605, L125
- Beers & Sommer-Larsen (1995) Beers, T. C., & Sommer-Larsen, J. 1995, ApJS, 96, 175
- Beers & Christlieb (2005) Beers, T. C., & Christlieb, N. 2005, ARA&A, 43, 531
- (5) Blöcker, T. 1995, A&A, 297, 727
- (6) Blöcker, T., & Schönberner, D. 1991, A&A, 244, L43
- Busso et al. (2007) Busso, G., et al. 2007, A&A, 474, 105
- (8) Caloi, V, & D’Antona, F. 2005, A&A, 463, 987
- (9) Caloi, V, & D’Antona, F. 2007, A&A, 463, 949
- (10) Canuto, V.M.C., & Mazzitelli, I. 1991, ApJ, 370, 295
- (11) Carretta, E. 2006, AJ, 131, 1766
- (12) Carretta, E., Bragaglia, A., Gratton, R.G., Leone, F., Recio-Blanco, A., & Lucatello, S. 2006, A&A, 450, 523
- (13) Cavallo, R.M., Sweigart, A.V., & Bell, R.A. 1998, ApJ, 492, 575
- (14) Cloutman, L., & Eoll, J.G. 1976, ApJ, 206, 548
- (15) Cohen, J.G., Briley, M.M., & Stetson, P.B. 2005, AJ, 130, 1177
- Cottrell & Da Costa (1981) Cottrell, P. L., & Da Costa, G. S. 1981, ApJ, 245, L79
- (17) D’Antona, F., Caloi, V., Montalban, J., Ventura, P., & Gratton, R. 2002, A&A, 395, 69
- D’Antona & Caloi (2004) D’Antona, F., & Caloi, V. 2004, ApJ, 611, 871
- D’Antona & Caloi (2008) D’Antona, F., & Caloi, V. 2008, MNRAS, in press
- D’Antona et al. (2005) D’Antona, F., Bellazzini, M., Caloi, V., Pecci, F. F., Galleti, S., & Rood, R. T. 2005, ApJ, 631, 868
- (21) D’Antona, F., & Mazzitelli, I. 1996, ApJ, 473, 550
- (22) D’Antona, F., & Ventura, P. 2007, MNRAS, 379, 1431
- (23) Decressin, T., Meynet, G., Charbonnel, C., Prantzos, N, Ekström, S. 2007, A&A, 464 1029
- (24) Denissenkov, P., Da Costa, G.S., Norris, J.E., & Weiss, A. 1998, A&A, 333, 926
- (25) Denissenkov, P., & Herwig, F. 2003, ApJ, 590, L99
- (26) Denissenkov, P., & Weiss, A. 1996, A&A, 308, 773
- (27) Denissenkov, P., & Weiss, A. 2001, ApJ, 559, L115
- D’Ercole et al. (2008) D’Ercole, A., Vesperini, E., D’Antona, F., McMillan, S. L. W., & Recchi, S. 2008, MNRAS, in press (arXiv:0809.1438)
- (29) Eggleton, P.P., Deaborn, D.S.P., & Lattanzio, J.C. 2008, ApJ, 677, 581
- (30) Fenner, Y., Campbell, S., Karakas, A.I., Lattanzio, J.C., & Gibson, B.K. 2004, MNRAS, 353, 789
- (31) Ferguson, J.W., Alexander, D.R., Allard, F., et al. 2005, ApJ, 623, 585
- (32) Formicola, A., Imbriani, G., Costantini, H., et al. 2004, Phys Lett. B, 591, 61
- Frost et al. (1998) Frost, C. A., Cannon, R. C., Lattanzio, J. C., Wood, P. R., & Forestini, M. 1998, A&A, 332, L17
- (34) Harris, W.E. 2003, Catalog of parameters for the Milky Way Globular Clusters, http://www.physics.mcmaster.ca/ harris/mwgc.dat
- (35) Gratton, R., Bonifacio, P., Bragaglia, A., et al. 2001, A&A, 369, 87
- (36) Gratton, R. G., Bragaglia, A., Carretta, E., Clementini, G., Desidera, S., Grundahl, F., & Lucatello, S. 2003, A&A, 408, 529
- (37) Gratton, R., Sneden, C., & Carretta, E. 2004, ARA&A, 42, 385
- (38) Grevesse, N., & Sauval, A.J. 1998, SSRv, 85, 161
- Herwig (2004) Herwig, F. 2004, ApJS, 155, 651
- (40) Herwig, F. 2005, ARA&A, 43, 435
- (41) Hale, S.E., Champagne, A.E., Iliadis, C., Hansper, V.Y., Powell, D.C., & Blackmon, J.C. 2002, Phys.Rev.C, 65, 5801
- (42) Hale, S.E., Champagne, A.E., Iliadis, C., Hansper, V.Y., Powell, D.C., & Blackmon, J.C. 2004, Phys.Rev.C, 70, 5802
- (43) Iglesias, C.A., & Rogers, F.J. 1996, ApJ, 464, 943
- (44) Ivans, I.I., Sneden, C., Kraft, R.P., et al. 1999, AJ, 118, 1273
- (45) Izzard, R.G., Lugaro, M., Karakas, A.I., Iliadis, C., & van Raai, M. 2007, A&A, 466, 641
- Johnson et al. (2007) Johnson, J. A., Herwig, F., Beers, T. C., & Christlieb, N. 2007, ApJ, 658, 1203
- (47) Karakas, A., Lattanzio, J.C. 2007, PASA, 24, 103
- (48) Kraft, R.P. 1994, PASP, 106, 553
- Kroupa et al. (1993) Kroupa, P., Tout, C. A., & Gilmore, G. 1993, MNRAS, 262, 545
- Lee et al. (2005) Lee, Y.-W., et al. 2005, ApJ Letters, 621, L57
- Lucatello et al. (2005) Lucatello, S., Tsangarides, S., Beers, T. C., Carretta, E., Gratton, R. G., & Ryan, S. G. 2005, ApJ, 625, 825
- Maiolino et al. (2004) Maiolino, R., Oliva, E., Ghinassi, F., Pedani, M., Mannucci, F., Mujica, R., & Juarez, Y. 2004, A & A, 420, 889
- Norris (2004) Norris, J. E. 2004, ApJ Letters, 612, L25
- Piotto et al. (2005) Piotto, G., et al. 2005, ApJ, 621, 777
- Piotto et al. (2007) Piotto, G., Bedin, L.R., Anderson, J. et al. 2007, ApJ, 661, L53
- Prantzos & Charbonnel (2006) Prantzos, A., & Charbonnel, C. 2006, A&A, 458, 135
- Salpeter (1955) Salpeter, E. E. 1955, ApJ, 121, 161
- (58) Saumon, D., Chabrier, G., & Van Horn, H.M. 1995, ApJS, 99, 713
- (59) Smith, V.V., Cunha, K., Ivans, I.I., et al. 2005, ApJ, 633, 392
- (60) Sneden, C., Kraft, R.P., Guhathakurta, P., Peterson, R.C., & Fulbright, J.P. 2004, AJ, 127, 2162
- (61) Sneden, C., Kraft, R.P., Prosser, C.F., & Langer, G.E. 1991, AJ, 102, 2001
- (62) Sneden, C., Kraft, R.P., Shetrone, M.D., Smith, G.H., Langer, G.E., & Prosser, C.F. 1997, AJ, 114, 1964
- (63) Stolzmann, W., & Blöecker, T. 2000, A&A, 361, 1152
- (64) Sweigart, A.V., & Mengel, J.G. 1979, ApJ, 229, 624
- (65) Anthony-Twarog, B. J., & Twarog, B. A. 2000, AJ, 120, 3111
- van Loon et al. (1999) van Loon, J. T., Zijlstra, A. A., & Groenewegen, M. A. T. 1999, A&A, 346, 805
- (67) Ventura, P., & D’Antona, F. 2005a, A&A, 431, 279
- (68) Ventura, P., & D’Antona, F. 2005b, A&A, 439, 1075
- (69) Ventura, P., & D’Antona, F. 2006, A&A, 457, 995
- (70) Ventura, P., & D’Antona, F. 2008a, A&A, 479, 805
- Ventura & D’Antona (2008) Ventura, P., & D’Antona, F. 2008b, MNRAS, 385, 2034
- (72) Ventura, P., D’Antona, F., & Mazzitelli, I. 2000, A&A, 363, 605
- (73) Ventura, P., D’Antona, F., & Mazzitelli, I. 2002, A&A, 393, 215
- (74) Ventura, P., D’Antona, F., Mazzitelli, I., & Gratton, R. 2001, ApJ, 550, L65
- (75) Ventura, P., Zeppieri, A., D’Antona, F., & Mazzitelli, I., 1998, A&A, 334, 953
- (76) Vitense, E. 1953, Zs.Ap., 32, 135
- Wachter et al. (2008) Wachter, A., Winters, J. M., Schröder, K.-P., & Sedlmayr, E. 2008, A&A, 486, 497