The Discovery of a Massive Cluster of Red Supergiants with GLIMPSE
Abstract
We report the discovery of a previously unknown massive Galactic star cluster at °, °. Identified visually in mid-IR images from the Spitzer GLIMPSE survey, the cluster contains at least 8 late-type supergiants, based on followup near-IR spectroscopy, and an additional 3–6 candidate supergiant members having IR photometry consistent with a similar distance and reddening. The cluster lies at a local minimum in the 13CO column density and 8 m emission. We interpret this feature as a hole carved by the energetic winds of the evolving massive stars. The 13CO hole seen in molecular maps at km s-1 corresponds to near/far kinematic distances of 6.1/8.71 kpc. We calculate a mean spectrophotometric distance of kpc, broadly consistent with the kinematic distances inferred. This location places it near the northern end of the Galactic bar. For the mean extinction of mag ( mag), the color-magnitude diagram of probable cluster members is well fit by isochrones in the age range 18–24 Myr. The estimated cluster mass is M⊙. With the most massive original cluster stars likely deceased, no strong radio emission is detected in this vicinity. As such, this RSG cluster is representative of adolescent massive Galactic clusters that lie hidden behind many magnitudes of dust obscuration. This cluster joins two similar red supergiant clusters as residents of the volatile region where the end of our Galaxy’s bar joins the base of the Scutum-Crux spiral arm, suggesting a recent episode of widespread massive star formation there.
1 Introduction
The and the Galactic Legacy Infrared Mid-Plane Survey Extraordinaire (GLIMPSE) (Benjamin et al., 2003) have opened new windows into many aspects of star formation and Galactic structure. The GLIMPSE mid-IR survey and many complementary surveys such as MIPSGAL (Carey et al., 2005) at 24 m, 2MASS (Skrutskie et al., 2006), and the Boston University Five College Radio Astronomy Observatory (BU-FCRAO) Galactic Ring Survey (GRS) in 13CO (Jackson et al., 2006) together constitute powerful new probes at 1–30 arcsecond resolutions of previously obscured components of the Milky Way. These overlapping surveys have produced many new discoveries including a new globular cluster (Kobulnicky et al., 2005) and new young open clusters (Mercer et al., 2005; Figer et al., 2006; Davies et al., 2007). A more complete census of star clusters enables a better understanding of the Galaxy’s formation and structure, its star formation history, and its current rate of star formation.
Massive stars are rare and short-lived. A typical 9 M☉ star will spend about 26 Myr on the main-sequence, while a 15 M☉ star has a MS lifetime of around 13 Myr (Meynet & Maeder, 2000). After leaving the main-sequence these stars begin their helium burning red supergiant (RSG) phase. The He-burning lifetime is about 4 Myr for 9 M☉, 2.5 Myr for 15 M☉ and even shorter for higher mass stars (Meynet & Maeder, 2000). This is a very small window for observing these evolved stars and the reason why there are relatively few of them known in the Galaxy. Bertelli et al. (1994) discovered 5 RSGs in NGC 7419, and more recently Figer et al. (2006) discovered 14 RSGs and a yellow (G-type) supergiant in single Galactic cluster. The current record holder for the most number of RSGs in a single Galactic cluster is Stephenson 2, also known as RSGC2 (Stephenson, 1990; Davies et al., 2007), which has 26 cluster RSGs. The number of massive RSGs in a cluster places strong limits on cluster age (massive stars have not all disappeared yet), cluster mass (enough initial mass to produce large numbers of high mass stars), and the duration of the star formation burst that produced the cluster, in that the stars must have formed in a relatively short period to have reached the same evolved state simultaneously. Figer et al. (2006) and Davies et al. (2007) use an evolved initial-mass function (IMF) to derive initial cluster masses of 20,000 – 40,000 M☉ for RSGC1 and RSGC2.
In this paper, we describe the discovery of another RSG cluster using methods similar to those of Figer et al. (2006). The cluster was discovered serendipitously as a conspicuous grouping of bright red stars while perusing 3-band mid-infrared color mosaics from GLIMPSE. At ° and °, the cluster lies in roughly the same direction as the RSG clusters reported in Figer et al. (2006) and Davies et al. (2007). We use archive data from , 2MASS, and the GRS, along with new near-IR spectroscopy of nine probable members to constrain the stellar content, age, and distance of this young and massive Galactic cluster.
2 Datasets Employed
2.1 Infrared Archival Data
Our discovery and analysis make use of archival data from the GLIMPSE I/II and MIPSGAL I legacy surveys. The GLIMPSE (Benjamin et al., 2003) project was conducted using the Infrared Array Camera (IRAC) (Fazio et al., 2004) wavebands centered near 3.6, 4.5, 5.8, and 8.0 .111GLIMPSE and MIPSGAL data are available from the Science Center website With four seconds of integration time per target, 5 sensitivities of 0.2, 0.2, 0.4, and 0.4 mJy were achieved for each band, respectively, on point sources with angular resolutions of 2″. In total, the GLIMPSE I implementation covers = 10–65° and 1°. Each image was calibrated by the Spitzer Science Center and further processed by the GLIMPSE team pipeline to produce point source catalogs (PSCs) and 3°2° mosaics. The MIPSGAL survey (Carey et al., 2005) covers the same region of sky as GLIMPSE but uses the Multi-band Infrared Photometer for Spitzer (MIPS) (Rieke et al., 2004) bandpasses at 24, 70, and 160 . The 24 mosaics have a resolution of 6″ and a 5 sensitivity of 1.7 mJy (Carey et al., 2005).
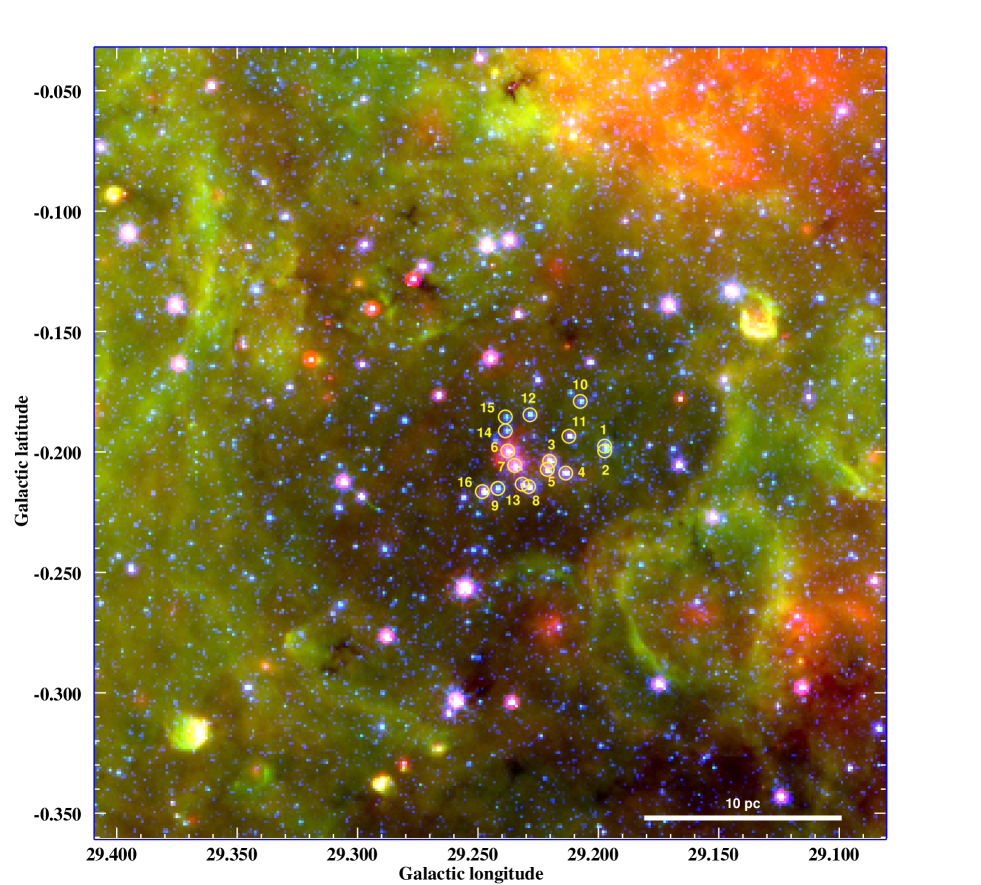
Figure 1 shows a 3-color image of the star cluster field, with IRAC [4.5] in blue, IRAC [8.0] in green, and MIPS [24] in red. Blue predominantly highlights the stellar photospheres. Green shows diffuse emission from warm molecular cloud interfaces, i.e., PAH emission from photodissociation regions excited by UV photons. Red preferentially reveals warm dust. The scale bar in the lower right shows a linear scale of 10 pc at a distance of 7.0 kpc. The grouping of bright stars near the center of the image suggests a physical association. They also lie near a local minimum in the diffuse emission, possibly a cavity sculpted by the winds and energetic photons from young massive stars. Infrared dark clouds (IRDCs) and dark filaments appear superimposed on the bright diffuse background at many locations across this field, indicating the presence of opaque, cold clouds in the foreground. A handful of very red and bright sources, often coinciding with dark clouds, surround the cluster. The color and placement of these objects suggest that they are young stellar objects (YSOs) associated with the IR emission.
We also use photometry from the University of Massachusetts Two Micron All Sky Survey (2MASS) (Skrutskie et al., 2006), which observed the sky in the near infrared for J (1.25 ), H (1.65 ), and Ks (2.16 ) bands. The project attained magnitude limits of J = 15.9, H = 15.0, and Ks = 14.3, with a signal-to-noise ratio of 10.
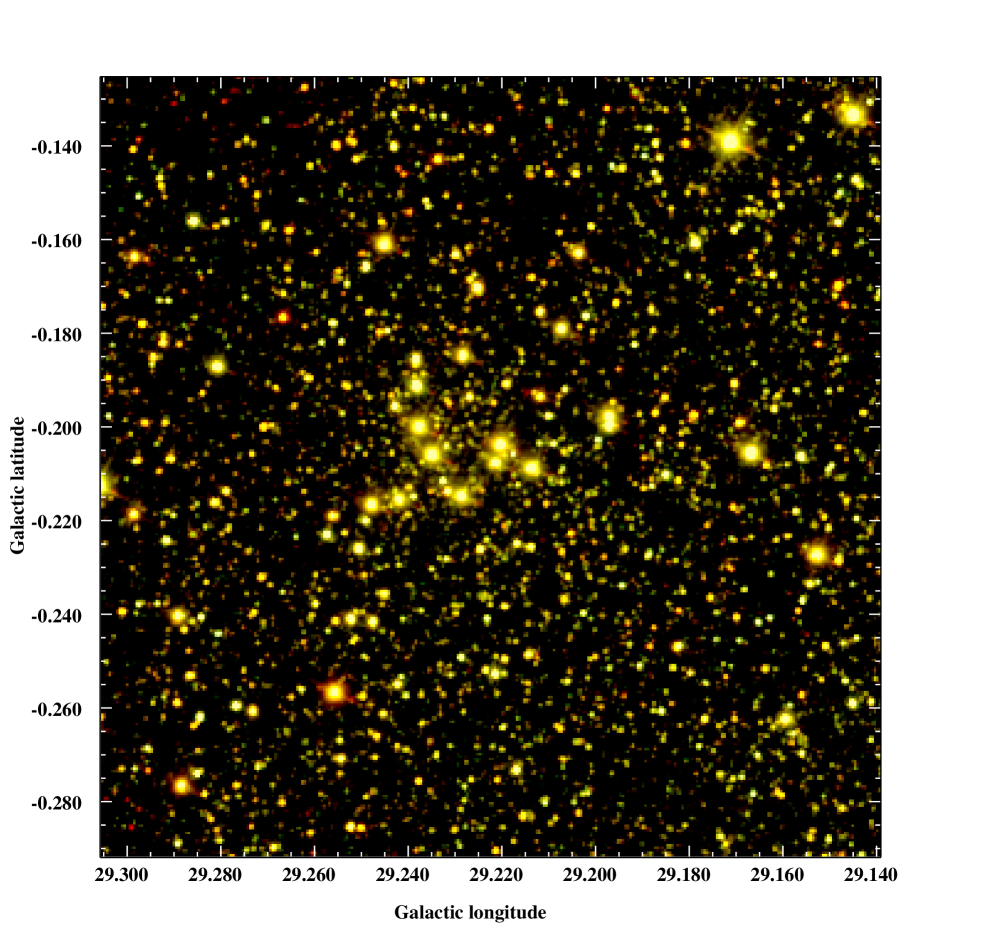
Figure 2 shows a color composite image of the cluster with the 2MASS J band in blue, the H band in green, and the band in red. The brightest cluster stars are conspicuous as a grouping of yellow-red stars near the center of the image.
Nine stars (numbered 1 through 9 in Figure 1) were chosen for spectroscopic observation based on their location (clustering) and brightness in the GLIMPSE/MIPSGAL mosaics. Table 1 lists these nine stars along with their equatorial coordinates, 2MASS JHK and GLIMPSE IRAC photometry. Most stars are saturated in the IRAC bands.
2.2 Near-IR Spectroscopy
Near-infrared spectroscopy was conducted using the Mimir instrument (Clemens et al., 2007) on the Perkins 1.8 m telescope, located outside Flagstaff, Arizona, on the UT nights of 2008 May 21, June 25–28, and September 23. Mimir is a cryogenic reimager with spectroscopic capability, delivering up to a 1010 arcmin field of view to a 10241024 InSb ALADDIN III array detector at 0.6 arcsec per pixel. Read noise is typically 17–18 e- RMS.
All spectroscopy used the JHK-grism (120 mm-1, 30° blaze angle, CaF2 substrate with 29° wedge) in conjunction with one of three long-pass (LP) filters and the wide-field, F5, camera optics to yield spectra with resolutions of 430–780, for J-band through K-band, respectively. All May and some June observations used the 1.16 m LP filter to yield spectra unaliased to 2.27 m, while the remaining June observations use the 1.90 m LP to form spectra to 2.5 m. September observations used a 1.4 m LP to simultaneously observe the full H and K bands.
The slit used has projected sizes of 1.2 arcsec (2 pixels) by 5 arcmin and was oriented North-South. Spectra were typically exposed for 15–45 seconds then moved along the spatial direction and another spectrum obtained. This A-B cycle was repeated for 5 or 6 pairs. The dome was rotated to cover the telescope beam, and exposures were taken with continuum lamps on and off in order to produce spectral flat-fields. Spectral images of an argon lamp positioned over the slit were obtained for wavelength calibration. For calibration of the wavelength dependence of atmospheric transmission, spectroscopy of bright A0V stars was performed using all of the same steps, for stars chosen to be within 15 degrees and 0.1 airmasses of the target stars.
Data reduction used custom IDL-based programs that included measuring and correcting the non-linear response of the InSb photovoltaic pixels, using the fourth-order method described in Clemens et al. (2007), in addition to the usual dark and flat-field corrections. Wavelength calibration utilized the argon spectra to ascertain the 2-D spatial-dispersion coefficients necessary to remap the spectral images into uniformly dispersed versions. Typical dispersion solution scatter was at or under 0.1 pixels (0.14 nm) for all argon spectra. Target spectral images were flattened, interpolated, and remapped to 20 subpixels for each raw pixel, then rebinned to twice the original dispersion to achieve a fixed channel spacing and common reference wavelength.
Spectra were modeled on the images as sloped lines with “bow tie” spatially-broadened extrema, due to the grism action. Spectra were extracted from the modeled locations by fitting locally sloped backgrounds at each spectral channel outside the spatial extent covered by the spectra, then integrating the signal above the background over the 2–3 rows showing significant emission. Noise was estimated for each extracted spectral channel based on gaussian read noise and poisson background and signal contributions. This somewhat overestimates the noise for these 2:1 synthetic channels. Relative scaling factors for each of the 10–12 spectra for a target were found across either the H- or K-band. For each spectral channel, the 10–12 scaled values were tested to remove bad pixels or cosmic rays, using median filtering. The surviving data were averaged using weighting by inverse noise squared.
Telluric spectra were developed using the A0V standard star extracted spectra and the SpeXTool program XTelcor by Cushing et al. (2004) and used to correct the target star spectra. The final spectra were flattened by identifying wavelengths free of lines, fitting baselines, and dividing by the baseline functions to yield relative intensity spectra. The resulting spectra, normalized by their error-propagated noise spectra, showed signal-to-noise ratios of 200 - 450.
2.3 13CO Molecular Line Data
As a means of assessing the molecular environment of the cluster, we used data cubes from the BU-FCRAO GRS222GRS data can be obtained from the Boston University website . (Jackson et al., 2006), which mapped the 13CO J = 1 0 molecular line in the first Galactic quadrant from = 18° to 55.7° and 1°. The FCRAO 14 m telescope has a beamsize of 46″ FWHM; the spectra were smoothed to a velocity resolution of 0.21 km s-1, and cover a local standard of rest (LSR) velocity range from -5 to 135 km s-1. The RMS channel sensitivity of the GRS is 0.4 K .
3 Analysis
3.1 Near-IR Spectra
Near-infrared spectra of the first nine potential cluster members are displayed in Figures 3 & 4. Solid lines show portions of the normalized H-band and K-band spectra for each star, shifted by arbitrary offsets for clarity. Dashed lines show H-band spectra from Meyer et al. (1998) and K-band spectra from Wallace & Hinkle (1997) 333The data were obtained from the NOAO Digital Library . for the nearest available spectral type. The spectra of Meyer et al. (1998) and Wallace & Hinkle (1997) have a resolution R=3000, which we smoothed by a factor of 10 to match the resolutions of our data. Eight of the nine stars (S1 and S3 through S9) show deep CO bandhead features near 2.3 m, characteristic of cool, evolved stars. These spectra are most consistent with late-type giants or supergiants.
Star S2, unlike the rest, is best matched with an early A or late B supergiant spectrum. This determination is based on the presence of strong Brackett series features in the H-band and Brackett near 2.17 m. The H-band Brackett lines of S2 were only about half as wide as the same lines in the A0V comparison stars, confirming its low-gravity, supergiant status. The lack of molecular absorption features (e.g., CO) is another indication that S2 is an early-type star.
Following the method outlined by Figer et al. (2006) (see their Figure 8), we measured the equivalent width (EW) of the first 12CO overtone feature at 2.30 m for each star (except S2 as it shows no CO absorption). EW values were found by setting the continuum level to be the average value of the normalized flux between 2.28 and 2.30 and integrating the absorption between 2.30 and the pseudocontinuum longward of 2.32 . The same method was used for the observed stars as well as stars with known spectral types from Wallace & Hinkle (1997). Figure 5 shows the correlation between EW and spectral type for the atlas stars of supergiant (open triangles) and giant (open diamonds) luminosity classes. The solid line is a least-squares fit to 14 G3–M6 supergiants, and the dashed line is a least-squares fit to 8 G7–M4 giants. This linear dependence extends all the way down to G3 spectral classes, however, we only show spectral types K0 to M7 in Figure 5 for clarity. The giants show systematically lower EW than supergiants for a given spectral type. The strong correlation between EW and spectral type, along with the systematic differences between giants and supergiants, shows that even at relatively low spectral resolution, our IR spectra can be used to discern spectral and luminosity classes. Typical values for the EW of cluster members are 45 to 65 Å, which we used to assign the spectral types according to the best-fit line; these are shown as solid diamonds in Figure 5. We have estimated our uncertainty on the EW to be 5 Å and given the slope of the least-squares fit, this corresponds to 2 sub-types. Table 1 lists these adopted spectral types.
3.2 IR Photometry
Figure 6 is a 2MASS J-H vs. H-Ks color-color diagram showing the nine stars with spectral types (filled diamonds), bright (K) stars within 4 arcmin of the cluster center (filled circles), and field stars in Figure 1 (dots). Open triangles with labels denote standard JHKs colors for supergiant stars.444The photometric data is in the 2MASS JHKs color system, so we used transformations from Carpenter (2001) and Bessell & Brett (1988) to convert the data from Whittet & van Breda (1980), Elias et al. (1985) and Koornneef (1983) to the 2MASS filter system. The dotted line is the reddening vector using the Cardelli et al. (1989) extinction law, and the solid line is an empirical reddening vector based on the slope of the locus of points. This was done to attempt to correct for the deviation in the data from the Cardelli et al. (1989) reddening. The difference between the slopes corresponds to (J-H) = 0.25 over 12 magnitudes of visual extinction. Since J-H offset is small compared to our estimated error, we still adopt the Cardelli et al. (1989) reddening law for our data analysis. Eight of the nine stars with near-IR spectral measurements occupy a limited region of the color-color diagram — J-H 2.0, H-K 1.0 — consistent with similarly reddened late-type supergiants. S2 has a much different color than the rest of the stars, suggesting an earlier spectral type. Of the other bright stars without spectral types, S14 is similar to S2 and less red than most cluster members, while S11, S13, and S16 are more red, suggesting that they may be more heavily extincted. Stars S10 and S12 have similar colors to the majority of supergiants, suggesting that they may also be RSG cluster members. Using the reddening law of Cardelli et al. (1989), we converted the 2MASS colors, J–Ks and H–Ks, into an average extinction. We find a mean extinction of (A).
Figure 7 is an enlarged version of Figure 6, with the fiducial supergiant colors reddened by using the empirical relation metioned previously. Most of the stars show colors matching K through M supergiants, with some differential extinction among cluster members. However, S2 does not match the expected A0I supergiant at H–K s = 0.77 and J–H s = 2.1. S2 appears to be less reddened by 1–2 magnitudes. This indicates that S2 (and S14) are likely foreground objects.
3.3 Molecular Environment and a Kinematic Distance
We used the GRS 13CO data cubes to survey the molecular environment near this RSG cluster. Figure 9 shows a plot of the 13CO brightness temperature versus LSR velocity averaged across the field of view pictured in Figure 1. This figure shows two strong 13CO peaks at LSR velocities of roughly 79 and 95 km s-1 and several smaller peaks at 8, 47, 64, and 101 km s-1. The abundance of 13CO components shows that this is a complex sightline with many molecular complexes at various distances. Numbers above each peak indicate the corresponding near and far heliocentric kinematic distances of =5.0/9.8 kpc and 6.1/8.7 kpc for the two major peaks and 0.7/14.1 kpc, 3.2/11.6 kpc, 4.2/10.6 kpc, and 7.4 kpc555This is the unique tangent-point distance corresponding to 103 km s-1. for the lesser peaks, respectively. The numbers in parentheses above each peak indicate the Galactocentric distance for the given velocity. These distances are derived from the Galactic rotation curve of Clemens (1985), assuming kpc, 220 km s-1. The more recent rotation curve of Levine et al. (2008) yields very similar distances for the same and . Adopting kpc instead (Eisenhauer et al., 2005) would reduce all distances by about 10%. We esitimate the kinematic distance uncertainty at 15% based on the width of the 13CO features.
Maps of integrated intensity were created for each of the five spectral features and compared to the GLIMPSE images. Four of the features showed no correlation between the CO and GLIMPSE images. For the fifth feature, with a peak at 95 km s-1, a strong correlation of the CO distribution with the GLIMPSE 8 m distribution was seen, as was a distinct anticorrelation with the location of the stellar cluster.
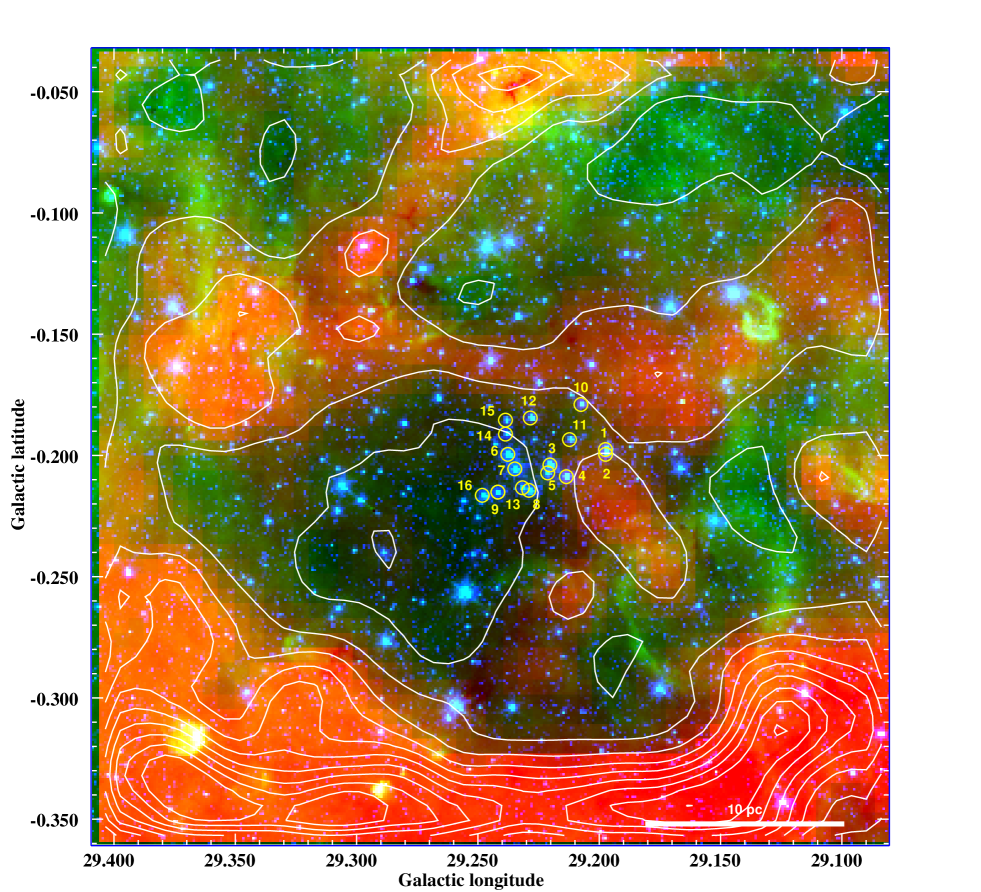
In Figure 10, we overlay a map of the GRS 13CO brightness temperature at 95 km s-1, averaged between 86–101 km s-1, on the GLIMPSE images. The GLIMPSE [4.5] and [8.0] bands are shown in blue and green, respectively, while the 13CO is shown in red, along with white contours. This velocity range exhibits a striking absence of molecular gas at the location of the cluster while the surrounding regions are 13CO-bright. This 13CO minimum coincides with the 8.0 hole discussed earlier in connection with Figure 1. We interpret this feature to be a hole in the ISM formed by the winds of massive stars that have already evolved over the lifetime of the cluster. This velocity range, which peaks at 94 km s-1, has a near kinematic distance of 6.1 kpc and a far kinematic distance of 8.7 kpc. Distinguishing between these two possiblities requires an independent distance measurement.
3.4 A Spectrophotometric Cluster Distance
Spectroscopic parallax is commonly used to find distances when the relation between spectral type and absolute magnitude is well-known and has small dispersion (e.g., for main sequence stars). Red supergiants, however, exhibit a large range of luminosities, spanning several magnitudes at any given spectral type. This is seen in the evolutionary tracks from Marigo et al. (2008), which are nearly vertical at the coolest temperatures. The large dispersion of abolute magnitudes among red supergiants in Levesque et al. (2005) supports this empircally. In order to estimate a spectrophotometric distance for the cluster, we calculated the mean absolute V magnitude and standard deviation for RSG spectral types K3 through M4.5 (representative of our sample) from Levesque et al. (2005). By adopting a mean intrinsic V-K color of 4.2 (Levesque et al., 2005), we derive a mean absolute K magnitude for red supergiants of . Given our mean observed K magnitude of 5.75 and extinction for our sample (excluding the possible foreground star S2), we estimate a distance of kpc.
Since the spectrophotometric distance is highly uncertain, we can only broadly constrain the distance of the cluster using spectroscopic parallax to the broad range 4 – 11 kpc, which encompasses both kinematic distances. For the purposes of determining a cluster age below, we will adopt the spectrophotometric distance of 7.0 kpc.
3.5 Cluster Age
Figure 8 shows a Ks vs. H-Ks color-magnitude diagram, along with the fiducial supergiant sequence, at a distance of 7.0 kpc and reddened by AV = 12. Symbols are the same as Figure 6. The solid, dotted, and dashed curves are 14, 18, and 24 Myr isochrones666Isochorones obtained from from Marigo et al. (2008). They have been reddened by AV = 12 and placed at a distance of 7.0 kpc. The majority of the cluster stars are consistent with being reddened supergiants at 7.0 kpc for ages between 14 and 24 Myr. Note that two objects with photometry but lacking spectroscopy, S10 and S12, fall in the same region as spectroscopically confirmed RSGs, bringing the total number of probable red supergiants in the cluster to ten. Another object, S15, closely matches the G0I fiducial point. There are five other candidates, S2, S11, S13, S14, and S16 that lie very close to the center of the cluster spatially, but do not occupy the same color-magnitude space. The A0 I star, S2, is much less red and nearly two magnitudes brighter than it should be if it were a cluster member. As stated previously we consider S2 to be a foreground star, not associated with the cluster. Based on the same criteria (but lacking spectroscopy) S14 is also likely to be a foreground object. Stars S11, S13, and S16 may be background objects or possibly cluster members enshrouded by additional intracluster or circumstellar dust. Massey et al. (2005) show that supergiants may be surrounded by up to 5 visual magnitudes of circumstellar extinction. Thus, we consider stars S11, S13, and S16 as candidate cluster supergiants, given their brightness and proximity to the cluster core. From Figure 8 we are then able to conclude that the cluster contains 8 spectroscopically confirmed supergiants as well as 6 additional cluster candidates.
The most massive stars remaining in each isochrone are 18.6 M☉, 14.9 M☉, and 12.6 M☉ corresponding to ages of 14 Myr, 18 Myr, and 24 Myr. These stars are the most luminous objects in the cluster in the near-IR, so the excellent agreement between the tips isochrones and the cluster supergiants indicates that the data are consistent with an age range of 18–24 Myr. Examination of the the 20-cm radio continuum map of this region from the NRAO VLA Sky Survey (Condon et al., 1998) shows no sources of emission at the location of the cluster, consistent with an older age and lack of ionizing photons from the most massive stars.
3.6 Cluster Stellar Mass
The eight confirmed and 3–6 additional candidate red supergiants in the cluster imply a large total stellar mass, and, given the short relative lifetime of the RSG phase, a short star formation timescale. Davies et al. (2008) compute Monte-Carlo population synthesis models with a Salpeter IMF (Salpeter, 1955) and Geneva isochrones (Meynet & Maeder, 2000) to estimate the number of red supergiants as a function of age for a range of initial cluster masses. Based on their Figure 8, a cluster containing 10 RSGs at an age of 18–24 Myr has a initial mass of 20,000 M⊙. In this cluster, all stars except the most luminous supergiants are faint due to its distance and reddening, which means the underlying cluster is below the detection threshold for 2MASS.
4 Discussion and Conclusions
This newly discovered cluster resembles two other RSG clusters in terms of stellar mass, age, the high number of red supergiants, and placement in the Galaxy. Table 2 summarizes the locations and derived parameters for the clusters RSGC1 (Figer et al., 2006; Davies et al., 2008), RSGC2 Stephenson 2 (Stephenson, 1990; Davies et al., 2007), and the present cluster. We have listed the distances for each cluster based on published data and computed the Galactocentric distance, , based on a solar Galactocentric distance of 7.6 kpc (Eisenhauer et al., 2005). Although the uncertainties of the spectrophotometric distances are several kiloparsecs, the resulting locations at °and 3.5–3.7 kpc indicate that these clusters may lie within a few hundred parsecs of each other. Davies et al. (2007) suggest that this is where the Scutum-Crux spiral arm meets the Galactic bulge and is within a stellar ring proposed by Bertelli et al. (1995). This location may also lie near the northern end of the Galactic bar, the parameters of which are still uncertain. There is evidence for at least two non-axisymmetric structures in the inner Galaxy, a vertically thick triaxial bulge/bar of half-length 3.5 kpc and angle 20–35 degrees (Bissantz & Gerhard, 2002; Gerhard, 2001; Babusiaux & Gilmore, 2005) and a vertically thinner “Long Bar” of half-length 4.4 kpc and angle 40–45 degrees (Hammersley et al., 2000; Benjamin et al., 2005). RSGC1, RSGC2, and this new cluster lie near the end of the Long Bar, perhaps where it meets the Scutum-Crux spiral arm and or the Molecular Ring.
Figure 11 plots the locations of RSGC1 and RSGC2 (asterisk) and the newly discovered cluster (triangle). Thick dashed lines show the spiral arms as defined by Nakanishi & Sofue (2006). Thin contours show the stellar bar as modeled by Bissantz & Gerhard (2002) from 2MASS near-IR photometry, while the thick solid curve shows the 4.4 kpc radius bar inferred by Benjamin et al. (2005) from mid-IR photometry. The location of all three RSG clusters near the end of the bar is consistent with recent star formation, possibly induced by radial gas flows along the bar. Numerical simulations show radial flows resulting from barred potentials (Schwarz, 1981; Combes & Gerin, 1985; Englmaier & Gerhard, 1997; Piner et al., 1995; Rodriguez-Fernandez & Combes, 2008). Observational studies of star formation in other galaxies also reveal enhanced activity associated with bars, sometimes along the bars themselves and sometimes near the ends of bars where spiral arms or “spurs” attach to the bars (Martin & Friedli, 1997; Sheth et al., 2002). In cases where star formation occurs along bars, it is displaced toward the leading side of the stellar bar and peaks outside of the dust and molecular lanes that run along the bar (Martin & Friedli, 1997; Sheth et al., 2002). For example, Downes et al. (1996) present CO maps of the barred spiral galaxy NGC 1530 showing concentrations of molecular material near the bar ends at 4 kpc from the nucleus. The accompanying optical image appears to show enhanced star formation just outside this region near the bar ends. Sheth et al. (2000) report that H emission peaks near the ends of the 4 kpc stellar bar in NGC 5383. The locations of the RSG clusters in Figure 11 near one end of the Milky Way’s bar at a 4 kpc radius hint that a similar phenomenon may be happening in our galaxy.
Taken together, the discovery of this new cluster raises the total count of RSGs in the Galaxy and adds evidence for a localized burst of recent massive star formation. The accumulating data point toward widespread, high-mass star formation in this vicinity over the last 20 Myr. With a stellar mass of roughly 20,000 M⊙ and a population containing 8–14 red supergiants, this ranks among the more massive clusters in the Galaxy.
References
- Babusiaux & Gilmore (2005) Babusiaux, C., & Gilmore, G. 2005, MNRAS, 358, 1309
- Beauchamp et al. (1994) Beauchamp, A., Moffat, A. F. J., & Drissen, L. 1994, ApJS, 93, 187
- Benjamin et al. (2003) Benjamin, R. A., et al. 2003, PASP, 115, 953
- Benjamin et al. (2005) Benjamin, R. A., et al. 2005, ApJ, 630, L149
- Bertelli et al. (1994) Bertelli, G., Bressan, A., Chiosi, C., Fagotto, F., & Nasi, E. 1994, A&AS, 106, 275
- Bertelli et al. (1995) Bertelli, G., Bressan, A., Chiosi, C., Ng, Y. K., & Ortolani, S. 1995, A&A, 301, 381
- Bessell & Brett (1988) Bessell, M. S., & Brett, J. M. 1988, PASP, 100, 1134
- Bissantz & Gerhard (2002) Bissantz, N., & Gerhard, O. 2002, MNRAS, 330, 591
- Cardelli et al. (1989) Cardelli, J. A., Clayton, G. C., & Mathis, J. S. 1989, ApJ, 345, 245
- Carey et al. (2005) Carey, S. J., et al. 2005, BAAS, 37, 1252
- Carpenter & Sanders (1998) Carpenter, J. M., & Sanders, D. B. 1998, AJ, 116, 1856
- Carpenter (2001) Carpenter, J. M. 2001, AJ, 121, 2851
- Clark et al. (2009) Clark, J. S, Negueruela, I., Davies, B., Larionov, V. M., Ritchie, B. W., Figer, D. F., Messineo, M., Crowther, P. A., & Arkharov, A. 2009, arXiv:0903.1754v1 [astro-ph.GA]
- Clemens (1985) Clemens, D. P. 1985, ApJ, 295, 422
- Clemens et al. (2007) Clemens, D. P., Sarcia, D., Grabau, A., Tollestrup, E. V., Buie, M. W., Dunham, E., & Taylor, B. 2007, PASP, 119, 1385
- Combes & Gerin (1985) Combes, F. & Gerin, M. 1985, A&A, 150, 327
- Condon et al. (1998) Condon, J. J., Cotton, W. D., Greisen, E. W., Yin, Q. F., Perley, R. A., Taylor, G. B., & Broderick, J. J. 1998, AJ, 115, 1693
- Cushing et al. (2004) Cushing, M. C., Vacca, W. D., & Rayner, J. T. 2004, PASP, 116, 362
- Davies et al. (2007) Davies, B., Figer, D. F., Kudritzki, R.-P., MacKenty, J., Najarro, F., & Herrero, A. 2007, ApJ, 671, 781
- Davies et al. (2008) Davies, B., Figer, D. F., Law, C. J., Kudritzki, R.-P., Najarro, F., Herrero, A., & MacKenty, J. W. 2008, ApJ, 676, 1016
- Downes et al. (1996) Downes, D., Reynaud, D., Solomon, P. M., & Radford, S. J. E. 1996, ApJ, 461, 186
- Eisenhauer et al. (2005) Eisenhauer, F., et al. 2005, ApJ, 628, 246
- Elias et al. (1985) Elias, J. H., Frogel, J. A., & Humphreys, R. M. 1985, ApJS, 57, 91
- Englmaier & Gerhard (1997) Englmaier, P., & Gerhard, O. 1997, MNRAS, 287, 57
- Fazio et al. (2004) Fazio, G. G., et al. 2004, ApJS, 154, 10
- Figer et al. (2006) Figer, D. F., MacKenty, J. W., Robberto, M., Smith, K., Najarro, F., Kudritzki, R. P., & Herrero, A. 2006, ApJ, 643, 1166
- Gerhard (2001) Gerhard, O. E. 2001, in Galaxy Disks and Disk Galaxies, 230, 21
- Hammersley et al. (2000) Hammersley, P. L., Garzón, F., Mahoney, T. J., López-Corredoira, M., & Torres, M. A. P. 2000, MNRAS, 317, L45
- Indebetouw et al. (2005) Indebetouw, R., et al. 2005, ApJ, 619, 931
- Jackson et al. (2006) Jackson, J. M., et al. 2006, ApJS, 163, 145
- Kobulnicky et al. (2005) Kobulnicky, H. A., et al. 2005, AJ, 129, 239
- Koornneef (1983) Koornneef, J. 1983, A&A, 128, 84
- Kutner & Ulich (1981) Kutner, M. L., & Ulich, B. L. 1981, ApJ, 250, 341
- Lançon et al. (2007) Lançon, A., Hauschildt, P. H., Ladjal, D., & Mouhcine, M. 2007, A&A, 468, 205
- Levesque et al. (2005) Levesque, E. M., Massey, P., Olsen, K. A. G., Plez, B., Josselin, E., Maeder, A., & Meynet, G. 2005, ApJ, 628, 973
- Levine et al. (2008) Levine, E. S., Heiles, C., & Blitz, L. 2008, ApJ, 679, 1288
- Marigo et al. (2008) Marigo, P., Girardi, L., Bressan, A., Groenewegen, M. A. T., Silva, L., & Granato, G. L. 2008, A&A, 482, 883
- Martin & Friedli (1997) Martin, P., & Friedli, D. 1997, A&A, 326, 449
- Massey (2003) Massey, P. 2003, ARA&A, 41, 15
- Massey et al. (2005) Massey, P., Plez, B., Levesque, E. M., Olsen, K. A. G., Clayton, G. C., & Josselin, E. 2005, ApJ, 634, 1286
- Massey et al. (2007) Massey, P., Plez, B., Levesque, E. M., Olsen, K. A. G., Silva, D. R., & Clayton, G. C. 2007, ArXiv e-prints, 708, arXiv:0708.2847
- Mercer et al. (2005) Mercer, E. P., et al. 2005, ApJ, 635, 560
- Meyer et al. (1998) Meyer, M. R., Edwards, S., Hinkle, K. H., & Strom, S. E. 1998, ApJ, 508, 397
- Meynet & Maeder (2000) Meynet, G., & Maeder, A. 2000, A&A, 361, 101
- Molinari et al. (1996) Molinari, S., Brand, J., Cesaroni, R., & Palla, F. 1996, A&A, 308, 573
- Nakanishi & Sofue (2006) Nakanishi, H., & Sofue, Y. 2006, PASJ, 58, 847
- Nakashima & Deguchi (2006) Nakashima, J.-i., & Deguchi, S. 2006, ApJ, 647, L139
- Pineda et al. (2008) Pineda, J. E., Caselli, P., & Goodman, A. A. 2008, ApJ, 679, 481
- Piner et al. (1995) Piner, B. G., Stone, J. M., & Teuben, P. J. 1995, ApJ, 449, 508
- Rieke et al. (2004) Rieke, G. H., et al. 2004, ApJS, 154, 25
- Rodriguez-Fernandez & Combes (2008) Rodriguez-Fernandez, N. J., & Combes, F. 2008, A&A, 489, 115
- Salpeter (1955) Salpeter, E. E. 1955, ApJ, 121, 161
- Schwarz (1981) Schwarz, M. P. 1981, ApJ, 247, 77
- Sheth et al. (2000) Sheth, K., Regan, M. W., Vogel, S. N., & Teuben, P. J. 2000, ApJ, 532, 221
- Sheth et al. (2002) Sheth, K., Vogel, S. N., Regan, M. W., Teuben, P. J., Harris, A. I., & Thornley, M. D. 2002, AJ, 124, 2581
- Skrutskie et al. (2006) Skrutskie, M. F., et al. 2006, AJ, 131, 1163
- Stephenson (1990) Stephenson, C. B. 1990, AJ, 99, 1867
- Szymczak et al. (2002) Szymczak, M., Kus, A. J., Hrynek, G., Kěpa, A., & Pazderski, E. 2002, A&A, 392, 277
- Wallace & Hinkle (1997) Wallace, L., & Hinkle, K. 1997, ApJS, 111, 445
- Whittet & van Breda (1980) Whittet, D. C. B., & van Breda, I. G. 1980, MNRAS, 192, 467
| Star # | StatusaaMembership status. M denotes a member, F a foreground object, and C a cluster candidate. | GLIMPSE ID | R.A.(J2000) | Dec.(J2000) | J | H | Ks | [3.6]bbEllipses indicate no listing in the GLIMPSE Point Source Catalog owing to saturation. | [4.5]bbEllipses indicate no listing in the GLIMPSE Point Source Catalog owing to saturation. | [5.8] | [8.0] | S.T. |
|---|---|---|---|---|---|---|---|---|---|---|---|---|
| 1 | M | G029.197400.1975 | 18:45:19.38 | 03:24:48.1 | 9.06 | 6.97 | 6.04 | 5.24 | 5.20 | K5 I | ||
| 2 | F | G029.197300.1995 | 18:45:19.81 | 03:24:51.6 | 8.37 | 7.13 | 6.50 | 5.70 | 5.75 | A0 I | ||
| 3 | M | G029.220600.2037 | 18:45:23.26 | 03:23:44.0 | 8.51 | 6.52 | 5.51 | 4.45 | 4.20 | M1 I | ||
| 4 | M | G029.213900.2087 | 18:45:23.59 | 03:24:13.8 | 8.55 | 6.54 | 5.58 | 4.73 | 4.50 | M0 I | ||
| 5 | M | G029.221500.2075 | 18:45:24.17 | 03:23:47.2 | 9.12 | 7.10 | 6.20 | 5.22 | 4.84 | K4 I | ||
| 6 | M | G029.238000.1999 | 18:45:24.34 | 03:22:42.0 | 8.54 | 6.43 | 5.35 | 4.19 | 4.14 | M3 I | ||
| 7 | M | G029.235100.2059 | 18:45:25.31 | 03:23:01.0 | 8.42 | 6.34 | 5.31 | 4.08 | 4.04 | M2 I | ||
| 8 | M | G029.229000.2147 | 18:45:26.52 | 03:23:35.2 | 8.53 | 6.62 | 5.75 | 4.92 | 4.63 | K5 I | ||
| 9 | M | G029.242100.2154 | 18:45:28.12 | 03:22:54.5 | 9.34 | 7.26 | 6.29 | 5.49 | 5.44 | K4 I | ||
| 10 | C | G029.207600.1790 | 18:45:16.55 | 03:23:44.6 | 9.65 | 7.43 | 6.43 | 5.57 | 5.52 | |||
| 11 | C | G029.212100.1935 | 18:45:20.13 | 03:23:54.1 | 11.69 | 8.80 | 7.39 | 5.71 | 5.54 | |||
| 12 | C | G029.228600.1846 | 18:45:20.03 | 03:22:46.8 | 9.53 | 7.29 | 6.30 | 5.46 | 5.43 | |||
| 13 | C | G029.231700.2137 | 18:45:26.60 | 03:23:24.7 | 11.26 | 8.78 | 7.46 | 6.01 | 5.81 | |||
| 14 | F | G029.238500.1911 | 18:45:22.53 | 03:22:26.4 | 8.40 | 7.09 | 6.47 | 6.12 | 6.07 | |||
| 15 | C | G029.238600.1854 | 18:45:21.32 | 03:22:16.2 | 10.16 | 8.39 | 7.49 | 7.06 | 6.66 | 6.69 | ||
| 16 | C | G029.248000.2166 | 18:45:29.00 | 03:22:37.5 | 9.51 | 7.08 | 5.89 | 4.79 | 4.61 |
| Name | b | R.A.(J2000) | Dec.(J2000) | N RSGs | Age | D | Mass | |||
|---|---|---|---|---|---|---|---|---|---|---|
| (°) | (°) | (Myr) | (kpc) | (mag) | () | (kpc) | ||||
| this cluster | 29.2 | 0.20 | 18:45:20 | 03:24:43 | 8–14 | 18–24 | 7.0 | 12 | 20,000 | 3.9 |
| RSGC1aaFiger et al. (2006) | 25.2 | 0.15 | 18:37:58 | 06:52:53 | 14 | 122 | 5.8,6.5ccNakashima & Deguchi (2006) | 24 | 30,000 40,000 | 3.5 |
| RSGC2bbDavies et al. (2007) | 26.2 | 0.06 | 18:39:20 | 06:01:41 | 26 | 173 | 5.8 | 13 | 40,000 | 3.5 |