QPO Frequency - Color Radius Connection in GRS 1915+105: a Possible Turnover supporting AEI predictions
Abstract
It is widely believed that the low frequency quasi-periodic X-ray oscillations observed in microquasars are correlated to, but do not originate at, the physical radius of the inner edge of the accretion disk. Models relating the QPO frequency and color radius are hindered by observations showing contradicting trend correlations between the microquasars GRO 1655-40, XTE J1550-564 and GRS 1915+105. The first shows a negative correlation and the latter two a positive one. By taking into account relativistic rotation in the accretion disk, the Accretion-Ejection Instability (AEI) model predicts a turnover in the frequency-radius relationship, and has been successfully compared with observations of GRO J1655-40 and GRS 1915+105. We present further evidence supporting the AEI model prediction by using observations of the microquasar GRS 1915+105. By combining a data set including -, - and -class X-ray light curves, we observe positive, negative and null correlations in the frequency-radius relationship. This is the first time a single source has shown a possible inversion in the QPO frequency-color radius curve predicted by the AEI model.
1 Introduction
Microquasars are X-ray binary stars featuring both accretion onto a compact object and relativistic jet ejection. To date, only a handful of microquasars are known. The most extensively studied is the archetype microquasar GRS 1915+105, which was discovered in 1992 (Castro-Tirado et al., 1992) and has been since observed at multiple wavelengths from the radio to the gamma-ray. Continued radio, infrared, and X-ray observations have led to the classification of GRS 1915+105’s radio jets into three types: (1) “steady” radio jets, (2) discrete plasma ejection events of minute duration in the infrared and radio, and (3) large superluminal jets akin to the 1994 event that earned GRS 1915+105 the name “microquasar” (Mirabel & Rodriguez, 1994). The discrete jets are associated with radio, infrared, and X-ray oscillatory behavior. The discrete jets are compact (extending a few hundred AU), and have a velocity 90% of the speed of light. They range in strength from mJy in the infrared and radio (e.g., Eikenberry et al., 1998; Rothstein et al., 2005; Yadav, 2006).
It is well established that the infrared and radio flares marking the discrete jet ejections in the source are associated with spectrally-hard dips in the X-ray light curves (Eikenberry et al., 1998; Mirabel et al., 1998; Fender & Pooley, 1998; Klein-Wolt et al., 2002; Rodriguez et al., 2008). These spectrally-hard dips are also associated with Hz variable low frequency quasi-periodic oscillations (LFQPOs). Despite the number of multi-wavelength observations of discrete jet ejection events in GRS 1915+105, the source of the LFQPO and the mechanism for launching the relativistic jet remain mostly unknown.
Models explaining the LFQPO tend to tie the QPO frequency to a magnetoacoustical frequency (e.g., Titarchuk & Fiorito, 2004) or to the Keplerian frequency at some radius in the disk (e.g., Tagger & Pellat, 1999). In the case of neutron star a different approach to the low frequency modulation was proposed, where the low frequency, normal branch oscillation, is a consequence of non-linear interaction between the KHz QPOs (Horak et al., 2004). Previous observations have shown that the color radius of GRS 1915+105 is consistent with a monotonic Keplerian scaling. However, observations of the microquasar GRO 1655-40 show an inverted relationship compared with other microquasars such as XTE J1550-564 or GRS 1915+105 (Sobczak et al., 2000). In 1999, Tagger & Pellat proposed the Accretion-Ejection Instability (AEI) as a possible explanation for the LFQPOs in microquasars. It was later found that the AEI predict an inversion in the QPO frequency - color radius relationship (Varniere et al., 2002) which was observed during the 1998 outburst of GRO J-. In this letter we present new evidence that the turnover predicted by the AEI model is observed in the source GRS 1915+105. Our observational data set covering multiple X-ray states shows the turnover. This is the first recorded inversion in the QPO frequency-inner radius trend found within a single source and lends credence to the AEI model
2 The AEI Model
The overall AEI model is described extensively in Tagger & Pellat (1999) and reviewed briefly in Varniere et al (2007). Caunt & Tagger (2001) perform 2D numerical simulations of the AEI. Tagger et al. (2004) presented a scenario for the class of GRS 1915+105 based on the identification of the LFQPO with the AEI. Here we will summarize the salient points and the observational tests of the AEI as the origin of the LFQPO.
The AEI is a global instability occurring in the inner region of a magnetized disk close to the equipartition namely when the magnetic pressure is of the order of the gas pressure. It is characterized by a spiral wave developing in the inner region of the disk. At the corotation radius between the accreting gas and the spiral wave, a Rossby vortex develops and stores accretion energy and angular momentum. In the presence of a low density corona the Rossby vortex will twist the foot-point of the magnetic field line. This causes an Alfven wave to be emitted toward the corona, therefore linking accretion and ejection(Varniere & Tagger, 2002).
This instability is stronger when the magnetic field is of the order of equipartition with the gas pressure and require
| (1) |
where and are is the epicyclic and rotation frequency (in a Keplerian disk ), is the surface density and is the equilibrium magnetic field. This configuration and requirement of equipartition, although unusual for disk where turbulence is studied, are coherent with most of the MHD jet model and therefore adapted to the state we are studying. Also, because of the profile of magnetic field, the equipartition only happen in the inner most region of the disk leaving the outer part of the disk with a low (sub-equipartition) magnetic field.
The AEI is a promising explanation for the LFQPO. First of all it is an instability, therefore it does not require external excitation, but grows naturally. It is also able to account for the following observational characteristics:
- -
-
the rotation frequency of the dominant mode, i.e the one-armed spiral, predicted by the AEI is a few tenths of the Keplerian frequency at the inner edge of the disk. This frequency is consistent with the LFQPO frequency (Tagger & Pellat, 1999).
- -
-
based on variations in disk properties at the location of the spiral wave, the AEI partially reproduces the observed X-ray flux modulation.
- -
-
non-linear simulations show that the rotating pattern of the AEI remains nearly steady, and thus is able to account for persistent LFQPOs (Caunt & Tagger, 2001)
- -
-
the AEI transfers energy and angular momentum toward the corona by Alfven Waves, thus providing a supply of Poynting flux that may produce the compact jet often observed in the low-hard state (Varniere & Tagger, 2002).
- -
-
by including General Relativity through the existence of a last stable orbit and orbital velocity profile, the AEI explains the observed turnover in the correlation between the color radius (= inner disk radius, as determined by the spectral fits) and the LFQPO frequency (Rodriguez et al., 2002; Varniere et al., 2002).
Because of these promising features, we are motivated to further study the AEI as a LFQPO model and compare the predictions to observations. In particular, we are interested in finding objects which show all of the aspects of the QPO frequency - inner radius relationship predicted by the AEI.
3 GRS 1915+105 X-ray Observations
GRS 1915+105 reveals its complexity through a broad display of multi-wavelength behavior. For a more complete review, see Muno et al. (1999); Belloni et al. (2000); Eikenberry et al. (2000); Rothstein et al. (2005). To summarize, GRS 1915+105 has wild X-ray variability and several distinct X-ray light-curve classes with unique (but repeatable) appearance, count rate, and color. Although there are at least 12 distinct light-curve classes (Belloni et al., 2000), our analysis focuses on three which have been positively linked to the discrete jet ejections: -, -, and -class. These three classes have spectrally hard dips followed by soft X-ray flares and infrared flares. For more complete reviews of the associated X-ray and infrared behavior, see Eikenberry et al. (2000); Rothstein et al. (2005); Mikles et al. (2006).
The X-ray data analysis is described in detail in Mikles et al. (2006), and summarized here. From three RXTE observations of GRS 1915+105 taken on 14 August 1997, 9 September 1997, and 10 July 2002111This observation is composed of several small window. We only too the beginning of the observation which was in the -class., listed in Table 1, we extract Proportional Counter Array (PCA) Standard-1 light curves and identify regions showing a hard X-ray dip. The regions were chosen as representative of the X-ray behavior associated with the particular light-curve state at the time of the observations: one -class, one -class, and one -class. In addition to the spectrally hard dip region for each class, we also examine the X-ray oscillations in the -class that precede the spectrally hard dip. This region shows brief hard dips associated with low-frequency QPOs and X-ray mini-flares (Rothstein et al., 2005). For each observation, we extract binned mode 8-millisecond light curves in the keV range and 4-second resolution binned and event X-ray spectra in the keV range.
By using a FFT, we calculate the power density spectrum (PDS) from the binned mode 8-millisecond light curve. We fine-bin the PDS using Fourier interpolation and track the peak frequency at 4-second resolution (see e.g. Ransom et al., 2002). We determine the QPO frequency by fitting a Moffat function to the PDS in the Hz frequency range. Further discernment of the QPO frequency from noise peaks for the - and -class hard dip observations is described in Mikles et al. (2006). For the -class oscillation region and the -class dips, the QPO is clearly present above 4 Hz, and lower frequency peaks are discounted as noise.
We fit the spectra with a combination of absorbed multi-temperature disk blackbody and power law models (wabs*(diskbb+powerlaw)). The multi-temperature blackbody models the thermal emission from a geometrically thin accretion disk around a compact object, recognizing that the temperature of the disk increases at low radii close to the compact object. This model is characterized by the X-ray flux, the temperature and and radius at the inner part of the accretion disk. We exclude spectral fits with or with poorly constrained blackbody radii, and are left with over 200 data points to build the relation between the frequency of the QPO and the inner radius of the accretion disk, shown in Fig. 1.
The choice of the simple black body model used in fitting the spectra is dictated by two things. First, rather than testing different models we simply want to compare the results from different classes, and therefore we chose to use the simplest, standard model of diskbb from XSPEC. Second, since our spectra are taken at 4s intervals, we would gain relatively little by employing more complicated models. Although this model oversimplifies the complex dynamics of the magnetized accretion disk, it allows for greater consistency in the analysis with a broader sample and eliminates the need to deconstruct partial correlation of features in a more complex model.
In Figure 1, we plot the X-ray light-curve and radius evolution for the three data sets used in this analysis.
The color radius is determined by fitting a geometrically thin accretion disk model which, while fairly standard, oversimplifies the complex dynamics of the magnetized accretion disk. Still, when we fit the X-ray spectra using XSPEC 11.3, the blackbody normalization gives a radius often too small. Merloni et al. (2000) performed a reliability study of the radii determination using diskbb in XSPEC. They created a series of model X-ray spectra, added noise and accounted for detection quirks, and found that the XSPEC radius fits were not fully reliable under a low disk flux condition. They also found that no single correction factor can be applied in that case to correct the fitted color radius to the inner radius. Nevertheless, the diskbb model often give acceptable value for the radius (within was could be expected knowing the mass), even in the Hard state where the disk flux is low, and allow simpler comparison between different observations. Also, in the Very High state, or Steep Power Law (state with both the disk and the power-law contribute significantly to the spectrum) the diskbb model systematically underestimates the disk radius.
So long as the XSPEC model assumptions are reasonable for the system, we expect some correlation to exist between the color radius, , and the inner disk radius, . Thus, even though the value of the color radius is low, it still traces the evolution of the inner disk. Often, the color radius and inner disk radius are related by a hardening factor, , such that (Shimura & Takahara, 1995). For a more complete discussion of the hardening factor, see, e.g., Shimura & Takahara (1995); Merloni et al. (2000); Rodriguez et al. (2002). The value of the hardening factor is found to be , and depends on several physical parameters in the system, such as viscosity and accretion rate (Shimura & Takahara, 1995). Given that we are measuring the QPO frequency - radius relationship while in a spectrally hard dip, where the blackbody emission contributes weakly to the total flux, our radius fits should be taken with caution. However, we proceed with our analysis assuming that traces the trend of the inner radius evolution with reasonable accuracy.
4 Radius-Frequency plot: data and theory
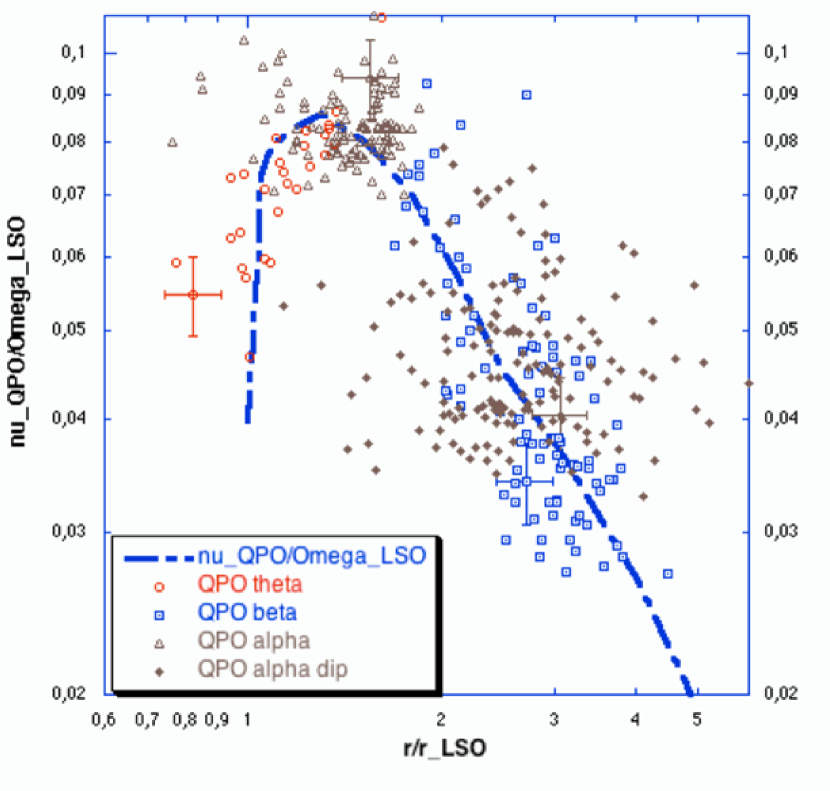
In Figure 2, we show the predictions of the AEI against the observational data presented above. We see that, at higher color radii (about 60 km in the case of GRS 1915+105), the model predicts a Keplerian relationship . For small radii the AEI prediction deviates from a purely Keplerian relationship. At radii between (about 40 km 60 km) the deviation is small, and for lower radii ( 40 km), the correlation reverses.
The three classes are ordered around the curve. The -class observations are on the left, meaning that in this state, the inner edge of the accretion disk extends closer to its last stable orbit. The oscillation at the beginning of the -class observations cluster toward the top of the curve, at a relatively constant QPO frequency while the later dip is better fitted on the keplerian side. Finally, the -class observations fall in the more usual, close to Keplerian, portion of the curve as was observed before (Rodriguez et al., 2002). The discovery of this inversion in the QPO frequency-inner radius trend is the first record of an inversion within a single source and lends credence to the AEI model. The AEI model is currently one of the only QPO frequency models that accounts for this heretofore unexplained reversal in the frequency-radius trend.
Although there is an apparent spread of the observational points around the model predictions, it is a serious concern only at low radii where the fits are known to have difficulties. We kept all the points, even the one with an unrealistically low color radii compared with the Schwarzshild radii expected from a black hole.
Still, the AEI model is an improvement over LFQPO models that predict simple Keplerian scaling in the LFQPO frequency - radius relationship. Despite inherent problems in radius estimation, it is interesting (and promising) that the -class data, which have lower radii than the -class data, fall within the same 2 - 10 Hz frequency range and are hence consistent with the turnover predicted in the AEI model. It suggests that while the instantaneous estimates of the color radius may be in error, the trend predicted by the XSPEC model fits is statistically accurate and useful for testing models. This new evidence of a turnover in the QPO frequency - color radius trend is a very exciting step toward validating the AEI model.
Notably, in the -class, the inner radius always stays close to the last stable orbit which is often referred as the position where the High-Frequency QPO form (see e.g. Tagger & Varniere, 2006). Recent observations by (Belloni et al., 2006) confirmed the presence of HFQPO in the -class. Following Tagger & Varniere (2006), HFQPOs can occur when the inner edge of the disk is less than which corresponds to the maximum of , but with a lower amplitude as the inner edge of the disk gets away from the last stable orbit.
5 Conclusions
We observe three different classes of X-ray oscillation in GRS 1915+105 and find that our QPO frequency - color radius correlations fall over multiple regimes of the theoretical curve predicted by the AEI model. Although the trend we observe in the QPO frequency - radius relation of GRS 1915+105 should be taken with caution, especially at low radii, this set of observations captures a very important observational prediction of the AEI model and behaviorally links GRS 1915+105 to the microquasar GRO 1655-40. We can further refine this result by gathering archival data of GRS 1915+105 in different X-ray spectral states, specifically targeting times when multi-wavelength observations are available. In this way, we can test the validity of the model in predicting both jet ejection strength and the QPO behavior. Additionally, we can expand the analysis to multiple microquasar systems and test the applicability of the model. For example, the microquasar GRO 1655-40 has been observed in the non-Keplerian regime, but additional observations may show that this source, like GRS 1915+105, can display behaviors consistent with multiple regimes. In comparing multiple sources exhibiting QPOs, we can determine whether most X-ray binary sources stay confined to a single part of the frequency-radius curve or whether all microquasars have a range of variability (and associated jet ejections) similar to GRS 1915+105. Ultimately, by testing observations against theory, we can determine whether we are able to accurately predict larger jet ejections via QPO observations so that we can study ejection events more closely.
References
- Belloni et al. (2000) Belloni, T., Klein-Wolt, M., Méndez, M., van der Klis, M., & van Paradijs, J. 2000, A&A, 355, 271
- Belloni et al. (2006) Belloni, T., Soleri, P., Casella, P., Méndez, M., Migliari, S., 2006, MNRAS, 369, 305
- Castro-Tirado et al. (1992) Castro-Tirado, A., Brandt, S., Lund, N., et al. 1994, ApJS, 92,469
- Caunt & Tagger (2001) Caunt, S.E. & Tagger, M., 2001, A&A, 367, 1095
- Eikenberry et al. (1998) Eikenberry, S. S., Matthews, K., Morgan, E. H., Remillard, R. A., & Nelson, R. W. 1998, ApJ, 494, L61
- Eikenberry et al. (2000) Eikenberry, S. S., Matthews, K., Muno, M., Blanco, P. R., Morgan, E. H., & Remillard, R. A. 2000, ApJ, 532, L33
- Fender & Pooley (1998) Fender, R. P., & Pooley, G. G. 1998, MNRAS, 300, 573
- Greiner et al. (2001) Greiner, J., Cuby, J. G., McCaughrean, M. J., Castro-Tirado, A. J., & Mennickent, R. E. 2001, A&A, 373, L37
- Klein-Wolt et al. (2002) Klein-Wolt, M., Fender, R. P., Pooley, G. G., Belloni, T., Migliari, S., Morgan, E. H., & van der Klis, M. 2002, MNRAS, 331, 745
- Horak et al. (2004) Horak, J. Abramowicz, M..; Karas, V.; Kluzniak, W., 2004, PASJ, 56, 819-822.
- Merloni et al. (2000) Merloni, A., Fabian, A. C., & Ross, R. R. 2000, MNRAS, 313, 193
- Mikles et al. (2006) Mikles, V. J., Eikenberry, S. S., & Rothstein, D. M. 2006, ApJ, 637, 978
- Mirabel et al. (1998) Mirabel, I. F., Dhawan, V., Chaty, S., Rodriguez, L. F., Marti, J., Robinson, C. R., Swank, J., & Geballe, T. 1998, A&A, 330, L9
- Mirabel & Rodriguez (1994) Mirabel, I. F., & Rodriguez, L. F. 1994, Nature, 371, 46
- Muno et al. (1999) Muno, M. P., Morgan, E. H., & Remillard, R. A. 1999, ApJ, 527, 321
- Ransom et al. (2002) Ransom, S. M., Eikenberry, S. S., & Middleditch, J. 2002, AJ, 124, 1788
- Rodriguez et al. (2002) Rodriguez, J., Varniere, P., Tagger, M., & Durouchoux, P. 2002, A&A, 387, 487
- Rodriguez et al. (2008) Rodriguez, J., Shaw, S. E., Hannikainen, D. C., Belloni, T., Corbel, S., Cadolle Bel, M., Chenevez, J., Prat, L., Kretschmar, P., Lehto, H. J., Mirabel, I. F., Paizis, A., Pooley, G., Tagger, M., Varniere, P., Cabanac, C., Vilhu, O. 2008, ApJ, 675, 1449
- Rothstein et al. (2005) Rothstein, D. M., Eikenberry, S. S., & Matthews, K. 2005, ApJ, 626, 991
- Shimura & Takahara (1995) Shimura, T., & Takahara, F. 1995, ApJ, 445, 780
- Sobczak et al. (2000) Sobczak, G. J., McClintock, J. E., Remillard, R.A., Cui, W., Levine, A.M., Morgan, E.H., Orosz, J.A., Bailyn, C.D. 2000, ApJ, 531, 537
- Tagger & Pellat (1999) Tagger, M., & Pellat, R. 1999, A&A, 349, 1003
- Tagger et al. (2004) Tagger,M., Varniere,P. , J.Rodriguez & R.Pellat, 2004, ApJ, 607, 410.
- Tagger & Varniere (2006) Tagger, M. & Varniere, P., 2006, ApJ, 652, 1457.
- Titarchuk & Fiorito (2004) Titarchuk, L., & Fiorito, R. 2004, ApJ, 612, 988
- Varniere et al. (2002) Varniere, P., Rodriguez, J., & Tagger, M. 2002, A&A, 387, 497
- Varniere & Tagger (2002) Varniere, P. & Tagger, M. 2002, A&A, 394, 329.
- Varniere et al (2007) P. Varniere, M. Tagger, J. Rodriguez and M. Cadolle Bel, proceeding of ”Semaine de l’Astrophysique Francaise” held in Grenoble June 2007.
- Yadav (2006) Yadav, J. S. 2006, ApJ, 646, 385
| Class | RXTE DATA ID | Date Observed | Start Time |
|---|---|---|---|
| 20186-03-03-01 | 1997 Aug 14 | 04:20:52 | |
| 50125-01-04-00 | 2002 Jul 27 | 07:15:00 | |
| 30182-01-03-00 | 1998 Jul 10 | 05:05:57 |