The extremely collimated bipolar H2O jet from the NGC 1333–IRAS 4B protostar
Abstract
Context. We have performed observations of water maser emission towards a sample of low-mass protostars, in order to investigate the properties of jets associated with the earliest stages of star formation and their interaction with the surrounding medium.
Aims. The main aim is to measure the absolute positions and proper motions of the H2O spots in order to investigate the kinematics of the region from where the jet is launched.
Methods. We imaged the protostars in the nearby region NGC 1333–IRAS 4 in the water maser line at 22.2 GHz by using the VLBA in phase-reference mode at the milliarcsecond scale over four epochs, spaced by one month to measure proper motions.
Results. Two protostars (A2 and B) were detected in a highly variable H2O maser emission, with an active phase shorter than four weeks. The H2O maps allow us to trace the fast jet driven by the B protostar: we observed both the red- and blue-shifted lobes very close to the protostar, 35 AU, moving away with projected velocities of 10–50 km s-1. The comparison with the molecular outflow observed at larger scale suggests a jet precession with a 18 yr-1 rate. By measuring the positional spread of the H2O spots we estimate a jet width of 2 AU at a distance of 12 AU from the driving protostar.
Key Words.:
Stars: formation – Radio lines: ISM – ISM: jets and outflows – ISM: molecules – ISM: individual objects: NGC 1333-IRAS 41 Introduction
The formation of a star is accompanied by a period of strong mass ejection in which two lobes of supersonic gas move away from the newly born object forming bipolar jets, strongly interacting with the natal cloud. The launching process of jets is still not well known, nor is the precise launch region, i.e. whether the jet originates from the interface between the star’s magnetosphere and disk or from a wide range of disk radii (e.g. Shang et al., 2007; Pudritz et al., 2007). Most investigations of the jet origin so far have been made in atomic microjets from optically visible T Tauri stars, thanks to the high angular resolution available in the optical range (Ray et al., 2007; Bally et al., 2007). As a next step, it is crucial to investigate the properties of jets driven by protostars, the so-called Class 0 objects (André et al., 1990), which are still hidden in the innermost part of the star forming region. However, observations of these regions in the optical and even in the IR spectral windows are not straightforward, being hampered by the high attenuation associated with these high density parts of the cloud.
In this context, water (H2O) masers at 22 GHz represent a unique tool to investigate the mechanism of jet formation and collimation in the earliest star forming phases. On the one hand, single-dish surveys show for Class 0 objects a definitely higher detection rate than that found for the more evolved Class I ones (e.g. Furuya et al., 2003). On the other hand, images taken with the VLA interferometer have confirmed a close association between water masers and protostars, finding the H2O spots concentrated within several hundred AU of the central star (e.g. Terebey et al., 1989; Chernin, 1995; Meehan et al., 1998; Furuya et al., 2005).
However, there are only a few high angular resolution studies available, using the Very Long Baseline Interferometry (VLBI), which is needed to trace the innermost part of the jet/disk system at the sub-AU-scales, in the closest vicinity of the exciting object. Claussen et al. (1998) and Furuya et al. (2000) observed respectively the HH212 and S106 FIR protostars, tracing with the H2O maser spots the curved bow shocks thought to travel along a jet. More recently, Moscadelli et al. (2006) reported multi-epoch VLBI observations of water masers towards a sample of low-mass protostars in the Serpens region and towards RNO 15-FIR. For the Serpens Class 0 objects, Moscadelli et al. (2006) found high-velocity spots located perpendicular to the jet axis: the authors suggest that such maser emission originates at the base of the jet, tracing the interaction between the jet itself and the accretion disk. For RNO 15-FIR, water masers are distributed along a line, suggesting their association with a collimated flow, in agreement with the results obtained by Marvel et al. (2008) for the NGC 1333–IRAS 4B region. Thus, the origin of H2O masers in low-mass protostars is far from being fully understood, calling for further observations at AU-scales.
Here, we report the results of a multi-epoch H2O maser survey towards the NGC 1333–IRAS 4 cluster of protostars, performed with 0.28 AU resolution and in phase-reference mode. Our main aim is twofold: (i) to measure the absolute positions and proper motions of the maser spots in order to study the kinematics of the disk/jet systems, (ii) to provide new observations of low-mass protostars allowing a step ahead in the discussion of the origin of jets.
2 NGC 1333–IRAS 4
NGC 1333 is a well-known star forming region containing a large number of protostars and located at a distance of 235 pc, according to the recent observations Hirota et al. (2008) performed with VERA (VLBI Exploration of Radio Astrometry). The IRAS 4 region is split into three star forming sites, called 4A, 4B, and 4C, which can be identified in the continuum, from cm- to submm-wavelengths (Sandell et al., 1991; Lefloch et al., 1998; Rodríguez et al., 1999). High angular resolutions cm- and mm-observations (Looney et al., 2000; Reipurth et al., 2002) have revealed that IRAS 4A is a binary system composed of A1 and A2 and is driving a highly collimated outflow in the northeast-southwest direction (Choi, 2005). IRAS 4B is also associated with a bipolar outflow located in the North-South direction (Choi, 2001). IRAS 4C has been revealed as a water maser source by single-dish observations (Haschick et al., 1980), although it was not detected by later interferometric surveys (Rodríguez et al., 2002; Furuya et al., 2003; Park & Choi, 2007). All these characteristics make IRAS 4 an excellent laboratory in which to study multiple star formation.
The IRAS 4 star forming region has been observed in the 22 GHz H2O maser line by Park & Choi (2007) using the VLA and a resolution of 80 mas. These authors found no emission towards the A1, whereas they observed six maser spots close to A2. Since the A2 maser group shows velocities close to the systemic velocity, Park & Choi (2007) interpreted such H2O spots as a tracer of a circumstellar disk. On the other hand, Marvel et al. (2008) reported VLBA observations of H2O masers towards NGC 1333–IRAS 4B, finding two groups of maser spots expanding away from each other at velocities of 78 km s-1 along a direction different from that of the large scale outflow, already traced with fews H2O spots by Park & Choi (2007). The disagreement found by Marvel et al. (2008) calls for further analysis in order to clarify which are the driving sources and whether NGC 1333–IRAS 4B has a companion as has been proposed by Marvel et al. (2008).
3 Observations
| Source | ||
|---|---|---|
| (h m s) | ( ) | |
| IRAS 4A1+A2 | 03:29:10.456 | +31:13:32.05 |
| IRAS 4B | 03:29:11.960 | +31:13:08.06 |
| IRAS 4C | 03:29:13.530 | +31:13:58.07 |


Using the VLBA network, we observed H2O maser emission at 22.2 GHz in phase-reference mode over four epochs spaced by about four weeks during 2003 (Apr 1st, May 14th, June 11th, July 07th). The duration of each observation was 10 hours in total.
As the four protostars (IRAS 4A1, 4A2, 4B, and 4C) fell in the primary beam of the antenna, during the observation we tracked their geometric barycenter. As phase centers, we used the coordinates reported by Rodríguez et al. (1999) (Table 1) in their VLA survey. Data were recorded in dual circular polarization with a velocity resolution (i.e. channel width) of 0.1 km s-1 and a total velocity coverage of about 55 km s-1. To be able to measure and compare the relative position of the water maser emission across the epochs, we used the phase-reference technique using the close phase calibrator 0333+321 (1.5 degree away). For this, we adopted a cycle time of 1 minute which left us about 20 seconds of integration time on our calibrator and our target including slewing time of the antennas, for a total coherent integration time on our target sources of about 2.5 h.
Data were correlated at the VLBA correlator in Socorro (New Mexico, USA) we made three separate passes (one per source), using the coordinates of each three sources (IRAS 4 A,B,C) with an integration time of 2 seconds. The data reduction was performed using the Astronomical Image Processing System (AIPS) package. The determination of the phase calibration was done following the standard method for spectral line VLBI data. The amplitude was calibrated using the template spectra method. The calibrator used to calculate the bandpass correction was 3C84, and the single-band delay corrections which was later applied to the spectral line sources was derived from the ICRF calibrator . The fringe rates were estimate by selecting a bright and simple-structured channel and residual phase errors were removed later in a self-calibration process. The corrections were subsequently applied to the maser source to generate the channel maps. The final restoring beam of 1.2 x 1.2 mas and each channel was clean down to a final residual rms noise of about 15 mJy.
4 Results and discussion
In the first epoch (Apr 1st), no emission was detected towards the four sources. In particular, IRAS 4C has never been detected in H2O, confirming the results from previous interferometric studies (see Sect. 2). The other protostars (IRAS 4A1+4A2 and IRAS 4B) presented water emission in two of the four epochs observed. This confirms the high variability of the H2O spots associated with low-mass young stellar objects (Wilking et al., 1994; Claussen et al., 1996; Marvel et al., 2008), with an active phase shorter than four weeks. Table 2 summarises the position, radial velocity, and flux of the observed H2O spots.
4.1 NGC 1333-IRAS 4B


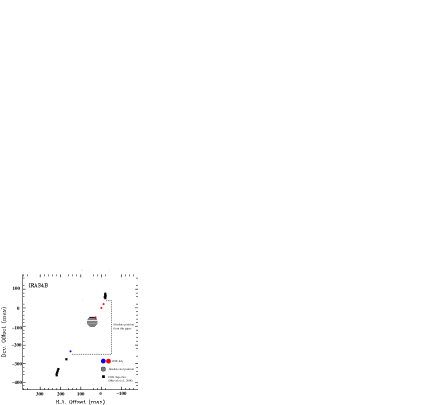
In IRAS 4B water emission was detected on June 11th and July 07th. Figure 1 reports the July 07th map: up to 13 H2O spots (labelled ‘a’ to ‘m’) showing a remarkable degree of collimation are seen. As a reference, the cross in Fig. 1 reports the coordinates of B following Reipurth et al. (2002) who gave the position of the NGC 1333 protostars, observed at 3.6 cm, with a 50 mas uncertainty (dotted circle). The spot ‘f’ is the closest one to the B coordinates, being inside the uncertainty area. Two boxes located at about (–70 mas,+100 mas) and (+70 mas,–130 mas) mark the regions where the majority of the spots have been detected and that are shown in the zoom-in of Fig. 2. In particular, these spots (‘a’ to ‘c’: Upper panels; ‘g’ to ‘m’: Lower panels) are the only ones detected in two epochs (Jun 11th and July 07th). The high degree of variability of the H2O maser emission is clearly shown by the comparison between the integrated emission maps of different epochs, as well as the H2O line profiles reported in Figs. 3 and 4 . Note that the present angular resolution does not allow us to disentangle spots ‘i’ and ‘j’ as well as spots ‘k’ and ‘l’. However, these spots are well identified by different radial velocities, as shown by the spectra and by the channel maps of Fig. 5.
The NW water emission (spots ‘a’ and ‘f’) is red-shifted, with velocities between +11.9 and +16.8 km s-1 ( = +7.25 km s-1; Mardones et al. (1997), whereas the SE emission (spots ‘g’ and ‘m’) is blue-shifted (–0.1 to +0.4 km s-1). Thus, the positions and velocities of the water spots suggest that they are tracing a jet with a position angle of P.A. –32 and driven by the 4B protostar.
The pattern formed by the ‘a’, ‘b’, and ‘c’ spots has been identified in both Jun 11th and July 07th epochs. Consequently, we have been able to derive the apparent proper motion (see Fig. 6), once having taken into account the parallax motion (including differential Galactic rotation) of such emission. Water masers are moving towards the NW direction with projected velocities in the range 10–40 km s-1 (see black arrows). The SE spots show different patterns in the two epochs: we can therefore only arbitrarily assume they are tracing the same components and then derive a typical proper motion: 40–50 km s-1. Table 3 reports the derived proper motions. These values are well in agreement with the results found by Marvel et al. (2008), who found with their observations performed in 1998 a total separation velocity of 78 km s-1. Note that for both the NW and SW spots, the measured directions have a position angle between –30 and –45, in agreement with the jet position angle, again indicating a very collimated flow from the B protostar. By using the measured proper motions and the radial velocity of the spots, we derive a high inclination to the plane of the sky between 10 and 35, in agreement with the observed definite separation between the red and blue lobes of the jet.
Figure 7 compares the position angle and the length of the H2O jet as observed in 1998 by Marvel et al. (2008) and in 2003 by us. Since the 1998 data are not in phase-reference mode we cannot positionally overlap the two maps and thus the plot of Fig. 7 is just indicative. However, it is possible to see that, after 5 years, the position angle, taking into account the corresponding uncertainties, remains nearly the same (–29 vs. –32). Interestingly, a chain of water maser spots with the same inclination (–29) was observed in 2006 by Park & Choi (2007), see their Fig. 3 in their VLA survey.
The morphology and the kinematics of the H2O spots can be compared with the molecular outflow detected in several species (CO, CS, HCN, CH3OH, SiO, H2CO) at larger scales (HPBWs between 1 and 5) by Choi (2001) and Jørgensen et al. (2007) and thought to be driven by IRAS 4B. The molecular maps indicate a clear bipolar structure, with a northern red-shifted lobe and a southern blue-shifted lobe, as shown by the H2O jet. The present maps suggest that, thanks to the H2O spots, we are tracing the jet sweeping up the surrounding gas and creating the larger scale molecular outflow. However, the molecular outflow is located along the north-south direction, although the blue lobe slightly bends to S-SE. Therefore its position angle ( ) is different from that of the H2O chain. As the inclination angle of 10-35 degrees excludes projection effects, either the molecular outflow is driven by another jet, not detected in H2O, and driven by an unresolved companion of IRAS 4B, or the difference between the position angles is due to deflection or precession. In the first case, the jet could be bended by its interaction with the surrounding high-density medium. However, this effect seems to be ruled out for two main reasons: (i) the northern red-shifted and the southern blue-shifted lobes are rotated by the same angle, and (ii) according to C18O and CS maps (Choi, 2001; Jørgensen et al., 2007), there is no evidence of high-density clumps located along the main axis which could deflect the jet direction. On the other hand, if precession has occured the jet should have changed about 30 in around 110 years, which is the dynamical scale of the molecular outflow, using the arcsec-scale maps of Jørgensen et al. (2007) and assuming a typical velocity of 100 km s-1. In fact, the dynamical scale of the maser emission is of the order of a year. In other words, we should conclude that the IRAS 4B is precessing with a definitely high rate: 18 yr-1.
| Spot | epoch | a | |||
| (2003) | (mas) | (mas) | (km s-1) | (mJy) | |
| IRAS 4B | |||||
| a | Jun 11 | 66.0 | 95.0 | +15.6(0.1) | 21435(1850) |
| Jul 07 | 66.8 | 96.0 | +15.9(0.1) | 981(6) | |
| b | Jun 11 | 65.8 | 93.2 | +15.6(0.1) | 5305(45) |
| Jul 07 | 66.2 | 93.8 | +15.1(0.2) | 2603(19) | |
| c | Jun 11 | 66.5 | 97.0 | +15.8(0.1) | 2375(110) |
| Jul 07 | 68.4 | 98.5 | +15.5(0.1) | 1709(12) | |
| d | Jun 11 | – | – | – | 16 |
| Jul 07 | –33.0 | 40.0 | +16.8(0.1) | 25013(1202) | |
| e | Jun 11 | – | – | – | 8 |
| Jul 07 | –75.0 | 120.0 | +17.0(0.1) | 850(59) | |
| f | Jun 11 | – | – | – | 20 |
| Jul 07 | –28.0 | 26.0 | +11.9(0.2) | 230(25) | |
| g | Jun 11 | 89.0 | 135 | +0.2(0.2) | 31(2) |
| Jul 07 | – | – | – | 5 | |
| h | Jun 11 | 89.1 | 136.6 | –0.1(0.1) | 164(5) |
| Jul 07 | – | – | – | 4 | |
| i | Jun 11 | 90.1 | 137.5 | +0.2(0.1) | 40(2) |
| Jul 07 | – | – | – | 5 | |
| j | Jun 11 | – | – | – | 6 |
| Jul 07 | 90.5 | –138.0 | –0.2(0.1) | 40(2) | |
| k | Jun 11 | – | – | – | 3 |
| Jul 07 | 90.7 | –138.5 | +0.1(0.2) | 49(4) | |
| l | Jun 11 | – | – | – | 6 |
| Jul 07 | 91.55 | –138.5 | +0.4(0.2) | 13(2) | |
| m | Jun 11 | – | – | – | 3 |
| Jul 07 | 91.55 | –139.2 | 0.0(0.1) | 31(3) | |
| IRAS 4A2 | |||||
| a | May 14 | 00.0 | 00.0 | +8.3(0.1) | 330455(16010) |
| Jun 11 | -0.2 | 2.0 | +5.8(0.1) | 62545(4913) | |
| b | May 14 | – | – | – | 19 |
| Jun 11 | -3.1 | 7.0 | +8.4(0.1) | 10512(990) | |
a When H2O emission is detected, we report here the peak flux and the corresponding Gaussian fit uncertainty, otherwise we report the 1 r.m.s. as upper limit.
| Spot | ||||
|---|---|---|---|---|
| (mas) | (mas) | (km s-1) | (km s-1) | |
| a | –0.96 | +1.33 | 15.1 W | 20.9 N |
| b | –0.59 | +0.53 | 9.3 W | 0.8 N |
| c | –1.86 | +1.73 | 28.9 W | 27.1 N |
| h,k | +1.50 | –3.02 | 23.5 E | 47.0 S |
| i,m | +1.50 | –1.91 | 23.5 E | 28.9 S |
Marvel et al. (2008) noted that, in the case where the large scale outflow was created 110 years ago by a clock-wise precessing jet observed now in the water emission, the H2O spots could be created by the impact of the jet against the walls of the outflow cavities. In this scenario, the maser spots, which require extremely high-density ( 107–109 cm-3, e.g. Elitzur et al., 1989; Kaufman & Neufeld, 1996) conditions, could originate in shocked layers compressed and accelerated at the interface with the surrounding medium. In particular, the maser amplification could be favoured at the border of the cavity, where the optical path along the line of sight is longer. This would also explain the high variability associated with water masers. Actually, if we assume that maser emission is produced in the thin layer at the border of the cavity, any small change of geometry associated with these regions, expected to be turbulent representing the interface between mass loss and molecular cloud, would definitely change the optical path, thus affecting the maser intensity. This possible geometrical effect also would produce a change in the projected velocity, as confirmed by the spectra reported in Figs. 3 and 4. Interestingly, Marvel et al. (2008) predicted that further VLBA observations would reveal new masers south (north) of the NW (SE) maser groups. The comparison of our data with those of Marvel et al. (2008) presented in Fig. 7 seems to support this scenario, indicating for the H2O map obtained in 2003 a separation between the red- and blue-shifted emission smaller than that observed by Marvel et al. (2008) in 1998. Future phase referencing VLBA observations would be instructive to check the validity of this hypothesis.

Finally, it is tempting to give an estimate of the width of the H2O jet by using the angle defined by the positions of IRAS 4B and spots ‘e’ and ‘f’ (16), and then measuring the width of this cone at the border of the IRAS 4B uncertainty area. In this way we obtain a width of 2 AU at a distance of 12 AU from the driving protostar. Clearly, we cannot exclude that we are measuring the width of a cavity swept-up by the jet itself. However, as far as we know, this is the first attempt to estimate a Class 0 jet width so close to the protostar. Another estimate has been inferred for the HH212 jet by using the H2O spots imaged by Claussen et al. (1998). In HH212 the width is 18 AU at 50 AU from the driving source, indicating a decrease of the jet collimation moving away from the driving protostar. If we compare the IRAS 4B jet width with the range spanned by atomic microjets from more evolved Class II sources surrounded only by thin disks (see Fig. 2 of Cabrit et al., 2007), there is no evidence of a higher jet collimation in Class 0 sources embedded in very dense cores. This confirms the conclusion reported by Cabrit et al. (2007), who concluded that collimation is not due to external pressure, requiring that jets from young stellar objects are self-collimated by internal magnetic stresses.

4.2 NGC 1333-IRAS 4A1+A2
In IRAS 4A, maser emission was detected in the second and third epochs (May 14th, Jun 11th). Figure 8 (Left panel) summarizes the obtained maps: only two spots (named ‘a’ and ‘b’) were detected. The maps are centered on the coordinates of spot a as detected in May 14th: = 03h 29m 104197221, = +31 13 32286030. The velocities of the spots lie in the +5.8,+6.4 km s-1 range, thus being slightly blue-shifted with respect to the ambient velocity (+7.25 km s-1, Mardones et al., 1997). Figure 8 (Right panel) reports the highly variable H2O spectra. Although the positions of the protostars are known with higher uncertainty (50 mas) than the H2O spots (1 mas), the comparison between these positions shows that the maser spots are very close to the A2 protostar, being located at about 17 AU in the northern direction (offset: +16 mas, –74 mas). On the other hand, A1 is definitely more distant from the maser spots, at about 430 AU in the SE direction (+1405 mas, –1235 mas). This confirms the association of maser emission with A2, as also found by Park & Choi (2007). These authors interpreted their VLA maps as mainly a sign of a circumstellar disk with, in addition, a few spots related to a jet (see their Fig. 2). Unfortunately, despite the high resolution of the present data, since we have detected only two spots we cannot infer any information about the morphology and the kinematics of the masering gas or discuss if the A2 water masers are tracing either a disk, a jet or a wide-angle cavity, as discussed for the IRAS 4B case.

5 Summary
We imaged the group of protostars in the NGC 1333 IRAS 4 region in the H2O maser line at 22.2 GHz by using the VLBA in phase-reference mode. The maps allow us to detect a chain of water maser spots tracing the fast ( 50 km s-1) jet driven by the IRAS 4B protostar. We observed both the blue- and the red-shifted lobes very close to IRAS 4B, 35 AU. The H2O chain is extremely collimated suggesting a jet width of 2 AU. The comparison with the large scale molecular outflow suggests the jet is precessing with a rate of 18 yr-1.
Acknowledgements.
We thank C. Goddi and L. Moscadelli for helpful discussions and suggestions.References
- André et al. (1990) André, P., Martín-Pintado, J., Despois, D., & Montmerle, T. 1990, A&A, 236, 180
- Bally et al. (2007) Bally, J., Reipurth, B., & Davis, C. J. 2007, in Protostars and Planets V, ed. B. Reipurth, D. Jewitt, & K. Keil, 215–230
- Cabrit et al. (2007) Cabrit, S., Codella, C., Gueth, F., et al. 2007, A&A, 468, L29
- Chernin (1995) Chernin, L. M. 1995, ApJ, 440, L97
- Choi (2001) Choi, M. 2001, ApJ, 553, 219
- Choi (2005) Choi, M. 2005, ApJ, 630, 976
- Claussen et al. (1998) Claussen, M. J., Marvel, K. B., Wootten, A., & Wilking, B. A. 1998, ApJ, 507, L79
- Claussen et al. (1996) Claussen, M. J., Wilking, B. A., Benson, P. J., et al. 1996, ApJS, 106, 111
- Elitzur et al. (1989) Elitzur, M., Hollenbach, D. J., & McKee, C. F. 1989, ApJ, 346, 983
- Furuya et al. (2003) Furuya, R. S., Kitamura, Y., Wootten, A., Claussen, M. J., & Kawabe, R. 2003, ApJS, 144, 71
- Furuya et al. (2005) Furuya, R. S., Kitamura, Y., Wootten, A., Claussen, M. J., & Kawabe, R. 2005, A&A, 438, 571
- Furuya et al. (2000) Furuya, R. S., Kitamura, Y., Wootten, H. A., et al. 2000, ApJ, 542, L135
- Haschick et al. (1980) Haschick, A. D., Moran, J. M., Rodríguez, L. F., et al. 1980, ApJ, 237, 26
- Hirota et al. (2008) Hirota, T., Bushimata, T., Choi, Y. K., et al. 2008, PASJ, 60, 37
- Jørgensen et al. (2007) Jørgensen, J. K., Bourke, T. L., Myers, P. C., et al. 2007, ApJ, 659, 479
- Kaufman & Neufeld (1996) Kaufman, M. J. & Neufeld, D. A. 1996, ApJ, 456, 611
- Lefloch et al. (1998) Lefloch, B., Castets, A., Cernicharo, J., Langer, W. D., & Zylka, R. 1998, A&A, 334, 269
- Looney et al. (2000) Looney, L. W., Mundy, L. G., & Welch, W. J. 2000, ApJ, 529, 477
- Mardones et al. (1997) Mardones, D., Myers, P. C., Tafalla, M., et al. 1997, ApJ, 489, 719
- Marvel et al. (2008) Marvel, K. B., Wilking, B. A., Claussen, M. J., & Wootten, A. 2008, ApJ, 685, 285
- Meehan et al. (1998) Meehan, L. S. G., Wilking, B. A., Claussen, M. J., Mundy, L. G., & Wootten, A. 1998, AJ, 115, 1599
- Moscadelli et al. (2006) Moscadelli, L., Testi, L., Furuya, R. S., et al. 2006, A&A, 446, 985
- Park & Choi (2007) Park, G. & Choi, M. 2007, ApJ, 664, L99
- Pudritz et al. (2007) Pudritz, R. E., Ouyed, R., Fendt, C., & Brandenburg, A. 2007, in Protostars and Planets V, ed. B. Reipurth, D. Jewitt, & K. Keil, 277–294
- Ray et al. (2007) Ray, T., Dougados, C., Bacciotti, F., Eislöffel, J., & Chrysostomou, A. 2007, in Protostars and Planets V, ed. B. Reipurth, D. Jewitt, & K. Keil, 231–244
- Reipurth et al. (2002) Reipurth, B., Rodríguez, L. F., Anglada, G., & Bally, J. 2002, AJ, 124, 1045
- Rodríguez et al. (1999) Rodríguez, L. F., Anglada, G., & Curiel, S. 1999, ApJS, 125, 427
- Rodríguez et al. (2002) Rodríguez, L. F., Anglada, G., Torrelles, J. M., et al. 2002, A&A, 389, 572
- Sandell et al. (1991) Sandell, G., Aspin, C., Duncan, W. D., Russell, A. P. G., & Robson, E. I. 1991, ApJ, 376, L17
- Shang et al. (2007) Shang, H., Li, Z.-Y., & Hirano, N. 2007, in Protostars and Planets V, ed. B. Reipurth, D. Jewitt, & K. Keil, 261–276
- Terebey et al. (1989) Terebey, S., Vogel, S. N., & Myers, P. C. 1989, ApJ, 340, 472
- Wilking et al. (1994) Wilking, B. A., Claussen, M. J., Benson, P. J., et al. 1994, ApJ, 431, L119