Study of Bubble Nebula using IUE high resolution Spectra
Abstract
In this paper we have analyzed IUE high resolution spectra of the central star (BD+602522) of the Bubble nebula. We discuss velocities of the different regions along the line of sight to the bubble. We find that the Bubble Nebula is younger (by a factor of 100) than the exciting star suggesting that either the bubble is expanding into an inhomogenuous interstellar medium or that the mechanics of the stellar wind are not fully understood.
1 Introduction
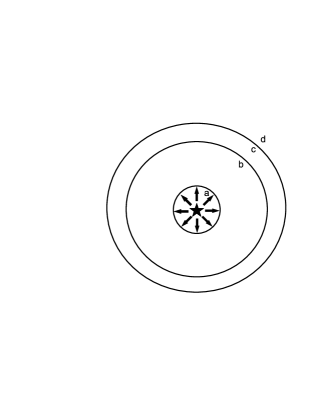
Interstellar bubbles are formed by the interaction of stellar winds (or supernovae) with the interstellar medium. As the material from the star streams out at supersonic velocities, it encounters the ambient ISM forming a shock front. This interaction is one of the main mechanisms by which energy is transferred from stars to the ISM and maintains the hot phase of the three phase ISM (McKee and Ostriker 1977). The first model of interstellar bubbles was created by Weaver (1977) who found that four regions would form around a hot star with a strong stellar wind. Immediately around the star is a volume comprised essentially of the stellar wind, from which the interstellar matter has been swept clean. A shock forms where the supersonic stellar wind runs into the interstellar medium followed by a region of swept up interstellar matter. The ambient ISM, which has not yet experienced the shock, surrounds the entire bubble. This picture is illustrated in Fig. 1.
Although this simple model is appealing and explains the gross features of interstellar bubbles, Naze et al. (2001) have pointed out discrepancies between the dynamical time scales of the bubbles in N11B H II region in Large Magellanic Cloud which are much shorter than the age of the OB association as well as inconsistencies between the observed and predicted luminosities of the bubbles. Similar discrepancies have been noted in superbubbles (Oey 1996). We have chosen to investigate a well-studied interstellar bubble in order to further test the standard model for bubbles.
The Bubble Nebula (NGC 7635) is a prominent object in the complex of interlocking shells belonging to the emission nebula S162, situated near the Galactic plane in the Perseus arm at a distance of about 3.6 kpc (Table 1). As the name suggests, it is a spherical nebula energized by a single, off-center O star (BD +60 25 22). The physical properties of this star are summarized in Table 1, taken from Christopoulou et al. (1995). The Bubble nebula, itself, has been mapped in the entire spectral band from the optical to the infrared and radio. Based on direct photographic and Fabry-perot interferogram techniques, Pismis et al(1983) have found an age of 3-4 years for the bubble. The shell velocity was estimated to be 35 km/s by Christopoulou through H and NII emission line studies. From this, they have estimated a dynamical lifetime of only 5 years for this high velocity shell suggesting that this expansion is a relatively short lived phenomenon. The infrared luminosity of the bubble is much less (by a factor of 4) than that of the central star with a low abundance of (Thronson et al 1982).
| parameters | Reference | |
|---|---|---|
| BD number | 60∘ 2522 | |
| Galactic longitude (l) | 112∘.3 | |
| Galactic latitude (b) | 0∘.2 | |
| R.A. | 23 20 44.2 | ep-2000 |
| Declination | +61 11 40.6 | ep-2000 |
| Spectral type | O6.5III ef | Conti & Leep 1974 |
| E(B-V) | 0.73 | |
| Distance( kpc) | 3.6 | Johnson 1982 |
| Terminal wind velocity(km/s) | 1800 | Johnson 1980 |
| 2500 | Leitherer 1988 | |
| Rate of stellar mass loss | ||
| ) | Leitherer 1988 |

2 IUE Archival Data
| Image | date | Exposure time(sec) | Aperture |
|---|---|---|---|
| SWP 08840 | 1980 April 27 | 10199.729 | L |
| LWR 07625 | 1980 April 27 | 8999.605 | L |
We have used archival data from the International Ultraviolet Explorer (IUE) to study the Bubble Nebula. IUE was launched in 1977 for a nominal 3 year mission and was finally shut off in 1999 after 18 years of operation. The instrument consists of a telescope, two ultraviolet spectrographs and four cameras: SWP (short wavelength prime); SWR (short wavelength redundant); LWP (long wavelength prime) and LWR (long wavelength redundant). The short wavelength cameras operate in the spectral range 1150-2100 while the long wavelength cameras operate in the spectral range between 1845-2980 . Each camera is operable with either a low resolution (R = 200) spectrograph or an echelle where R is 10,000 for SWP/R and 15,000 for LWP/R. Details of the IUE instrumentation and operation are given by Boggess et al (1978).
We have searched through the IUE archives at the Space Telescope Science Institute for high dispersion observations of the central star of the Bubble Nebula and have found two images: LWR07625 and SWP08840. Details of these two observations are given in Table 2 and the data have been downloaded as fully calibrated spectra. The entire IUE archive has been reprocessed using the New Spectral Image Processing System (NEWSIPS) which provides a uniform set of spectra incorporating the best available improvements in the reduction algorithms and calibration. A full description of the NEWSIPS used to process IUE data and of the archived data products is given by Nichols and Linsky (1996).
A complete list of lines observed in the interstellar medium has been given by Morton (1991) with their central wavelengths and oscillator strengths. We have fit the spectrum around each of the interstellar lines using a Voigt profile with the central wavelength, column density, velocity parameter (b), and continuum level as free parameters. The resultant profile was convolved with a Gaussian with a FWHM defined by =10,000 and 15,000 for the SWP and LWR spectra, respectively and compared with the observed spectra to yield a value. We then used the method of Lampton, Margon & Bowyer (1976) to set limits on each of the model parameters. This consists of increasing each parameter in turn while keeping the other parameter fixed untill the reduced chisq exceed the required confidence interval.
3 Results
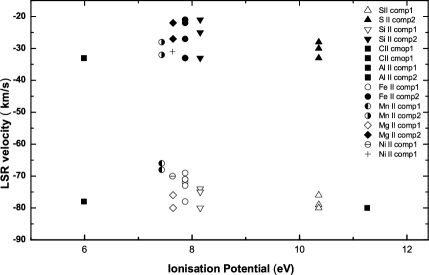
A complete list of the lines observed in our spectra is in Table 3 with their velocities in the local standard of rest (LSR) and their equivalent widths. We first fit the lines with a single component Voigt profile but found that, in most cases, two components were actually present (Fig. 2) with distinct velocities (Fig. 3). One of these components (Component 1) has a velocity about order of 60 km/s characteristic of that found in the surrounding shell in the radio (45 km/s, Thronson et al., 1982) and we have identified it with material from the ISM that has been swept up by the expansion of the bubble. The column density in Component 1 is about from our IUE analysis, consistent with the (Thronson et al. 1982) in the surrounding nebula, and its velocity with respect to the exciting star is about 40 km/s. We find no evidence for this ambient medium in our spectra perhaps indicating that most of the material has already been swept up and that the bubble will soon break out into the low density gas around.
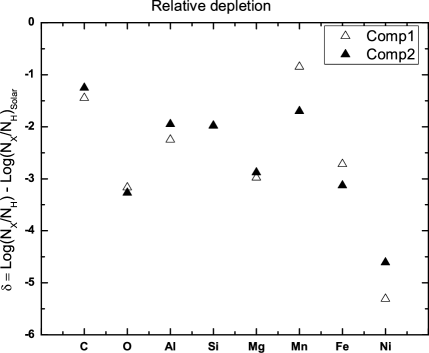
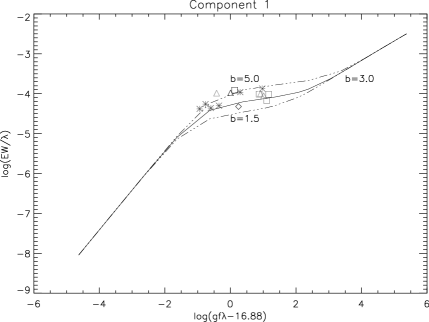
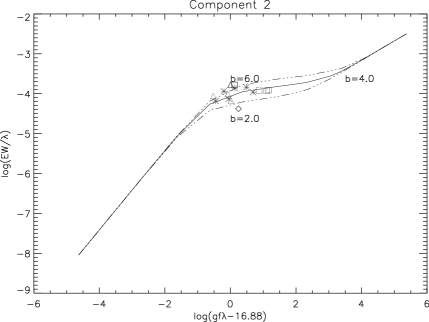
The other component (Component 2) is likely to be from the intervening interstellar medium and not associated with the Nebula. An examination of the line velocities in IUE spectra along the nearby lines of sight (Table 4) to AR Cas (176 pc) and 1 Cas (338 pc) yield a similar column density and velocity to Component 2 consistent with its origin in an interstellar cloud within about 170 pc from the Sun. Fig 5 and 6 shows curve of growth plotted for component 1 and 2 respectively. Fig 4 represents the depletion found from these two components.
The remaining two sets of lines (CIV & Al III) in Table 3 are characteristic of hotter regions and are likely to be formed in either the conductive interface (C IV) or in the HII region around the nebula (Al III). Their velocities with respect to the central star are on the order of 20 - 30 km/s.
We will compare our observational results with those expected from the model in the next section.
| elements | lab wavelength | LSR velocity | eqwdth | LSR velocity | eqwdth |
|---|---|---|---|---|---|
| (Å) | (km/s) | (mÅ) | (km/s) | (mÅ) | |
| C IV | 1548.195 | - | - | ||
| 1550.790 | - | - | |||
| Al III | 1854.716 | - | - | ||
| 1862.790 | - | - | |||
| S II | 1250.584 | ||||
| 1253.811 | |||||
| 1259.519 | |||||
| O I | 1302.169 | ||||
| C II | 1334.532 | ||||
| Si II | 1304.370 | ||||
| 1526.707 | |||||
| 1808.013 | |||||
| C I | 1560.309 | ||||
| Al II | 1670.787 | ||||
| Fe II | 1608.451 | ||||
| 2344.214 | |||||
| 2374.461 | |||||
| 2382.765 | |||||
| 2586.650 | |||||
| 2600.173 | |||||
| Ni II | 1741.549 | ||||
| Mn II | 2576.877 | ||||
| 2594.499 | |||||
| 2606.462 | |||||
| Mg II | 2796.877 | ||||
| 2803.531 | |||||
| Mg I | 2852.963 | ||||
| 1392.4074 | - | - | |||
| 1418.9012 | - | - | |||
| 1447.2456 | - | - | |||
| 1477.4423 | - | - | |||
| object | galactic | |
| coordinate | (km/s) | |
| (l,b) | ||
| AR Cas | 112,-2 | -19 |
| 1 Cas | 110,+1 | -25 |
| elements(X) | 11footnotemark: 1 | 22footnotemark: 2 | 33footnotemark: 3 | 11footnotemark: 1 | 22footnotemark: 2 | 33footnotemark: 3 |
|---|---|---|---|---|---|---|
| O | 15.3 | - | -3.16 | 15.2 | 15.2 | -3.27 |
| C | 15.5 | 15.5 | -1.44 | 15.2 | 15.2 | -1.25 |
| Si | 15.3-16.3 | 15.3 | -1.97 | 15.3-15.9 | 15.3 | -1.98 |
| Al | 14.2 | 13.8 | -2.24 | 14.2 | 14.0 | -1.95 |
| Fe | 14.0-14.8 | 14.41 | -2.71 | 14.0-14.9 | 14.0 | -3.13 |
| Ni | 13.4 | 14.3 | -5.30 | 14.4 | 13.6 | -4.61 |
| Mn | 13.7-14.2 | 14.2 | -0.84 | 14.0-14.2 | 13.35 | -1.71 |
| Mg | 14.2-14.5 | 14.25 | -2.97 | 14.0-14.8 | 14.35 | -2.88 |
by profile fitting,
2222 by Curve of growth Method
3333 depletion given by
4 Test of Weaver’s model
Weaver’s (1977) model is a straightforward and elegant application of basic physics to the formation of interstellar bubbles. He assumed that the bubble started forming immediately as the new-born star’s stellar wind interacted with the ambient interstellar medium and then traced its evolution. His predictions should therefore be directly comparable with the observations. Unfortunately, as discussed below, we find significant discrepancies, as have others, between the predictions of the model and the observations.
Although the age of the central star is years (Dawanas et al., 2007), we find that, given its size of 1.5 pc and our observed expansion velocity of 36 , the bubble is only years old, consistent with that derived by Christopoulou (1995). Similar discrepancies have been noted in other systems, such as in the Large Magellanic Cloud where the derived age of the bubbles in N11B ( years) is much less than the 2 - year age of the exciting OB association LH10 (Naze et al., 2001).
The physics of bubble formation and expansion are well understood (Weaver 1977) and it is most likely that the discrepancies between the model and the observations are due to the inhomogeneous nature of the medium into which the bubble is expanding (Lynds and Neil, 1983).
At its heart, the discrepancy in this, and in other bubbles, is that the size of the bubble is much less than would have been predicted based on the age of the central star and the observed mass loss rate. In order to explain this, Naze et al. (2001) have suggested that either the stellar wind is much less than the accepted value, by as much as a factor of 100, or that the bubble is expanding into an inhomogeneous medium. Aprilia & Dawanas (2004) has proposed, alternatively, that there are actually two phases of bubble expansion. In the first phase bubble expands into surrounding medium and becomes unobservable. In the second phase it results in formation of Bubble nebula.
5 conclusion
We have used IUE high resolution spectra of BD+602522, the central star of the Bubble Nebula, to study the physical properties in a prototypical interstellar bubble. We have found two components in most of the absorption lines, one from an intervening interstellar cloud and the other from the shell around the Bubble. The physical parameters in both components are similar with a column density in each of about and a temperature on the order of 10000 K, although we are limited by the resolution of IUE. We also see evidence for the hot gas in the bubble in the lines of C IV and Al III.
As with other observations of interstellar bubbles, we have found that the derived age of the Bubble Nebula is much less than that of the parent star, perhaps indicating that the initial expansion was into an inhomogeneous medium.
There is a rich trove of IUE data on various other bubbles and we are currently investigating these to understand the validity and reach of Weaver’s original model.
Acknowledgments
We thank ISRO for financial support under ISRO-Respond program(project No.10/2/285).
References
- [1] Aprilia, Dawanas D.N., 2004, Jurnal Mathematika dan sains, Vol.9 N4.
- [2] Boggess, A., et al., Nature, vol 275, 5 October 1978.
- [3] Christopoulou, P.E., Goudis C.D., Meaburn J., Dyson J.E., Clayton C.A., 1995,A&A, 295.
- [4] Conti, P.S., Leep, E.M., 1974, ApJ, 193, 113.
- [5] Dawanas, D.N., A.Wardana., H.L.Malasan., 2007, Ast & ss, 312, 23.
- [6] Israel, F.P., Habing H.J., de Jong T., 1973, A&A, 7, 143.
- [7] Johnson, H.M., 1980, ApJ, 235, 66.
- [8] Johnson, H.M., 1982, ApJ, 250, 551.
- [9] Lampton, M., Margon. B., Bowyer, 1976, ApJ, 208, 177.
- [10] Leitherer, C., 1988, ApJ, 326, 356.
- [11] Lynds, B., Neil, E.J., 1983, ApJ, 274, 650.
- [12] McKee, C.F., Ostriker J.P. 1977 ApJ, 218, 148.
- [13] Morton, D C., 1991, ApJS, 77, 119.
- [14] Naze, Y., You-Hau Chu, et al., 2001, AJ.
- [15] Nichols, J.S., Linsky, J.L., 1996, AJ, 111, 517.
- [16] Oey M.S., 1996, ApJ, 467, 666.
- [17] Pismis, P., Moreno M.A., Hasse I., 1983, Re. Mex. Astron. Astrofis, 8, 51.
- [18] Thronson, H.A., Lada C.J., Harvey, P.M., & Werner, M.W., 1982, MNRAS, 201, 429.
- [19] Weaver, R., McCray R., Castor J., Shapiro P., & Moore R., 1977, ApJ, 218, 377.