11email: ricardo.amorin@iac.es, 11email: casiana@iac.es, 11email: jalfonso@iac.es 22institutetext: Instituto de Astrofísica de Andalucía (IAA), Camino Bajo de Huetor, 50, 18003 Granada, Spain
22email: amorin@iaa.es 33institutetext: Astrophysikalisches Institut Potsdam, An der Sternwarte 16, D-14482 Potsdam, Germany
33email: luzma@aip.de
The host in blue compact galaxies:
Abstract
Aims. We characterise the underlying stellar host in a sample of 20 blue compact galaxies (BCGs), by fitting their two-dimensional light distributions. Their derived host structural parameters and those of eight other BCGs already obtained in a previous paper are related to galaxy properties, such as colours and gas content. These properties are also compared with those of other galaxy types.
Methods. The structural parameters of the host were derived by fitting a two-dimensional PSF-convolved Sérsic model to deep optical images in several bandpasses (, , , ). We followed a fitting technique that consists in the accurate masking-out of the star-forming regions in several steps.
Results. All the BCG hosts but one show low Sérsic indexes (), with mean effective radius 1.110.74 kpc and mean surface brightness 22.590.68 mag arcsec-2. Host effective radii scale linearly with their luminosity, while and do not. In addition, host colours and structural parameters are not linearly correlated. Overall, the flux enhancement caused by the starburst is about 0.8 mag, while their colours decrease by about 0.2 mag. Galaxies with more luminous and extended hosts show larger and luminous starburst components, whereas the relative strength of the burst () does not show any significant dependence on the host luminosity (or mass). While hosts show 0.950.26 in median, galaxies with redder hosts ( 1.290.10) and with bluer hosts ( 0.660.10) are distinguished among the more and less luminous systems, respectively. Overall, BCG hosts are more compact (by a factor 2) and have higher central surface brightnesses (by about 2 mag) than dIs and most dEs. BCG hosts and isolated dIs are indistinguishable in the -band Tully–Fisher relation (TFR). We found that about 50–60% of the galaxies are more underluminous than those late-type discs with the same circular velocity. This feature is more important when luminosities are converted into stellar masses, while it tends to diminish when the Hi gas mass is added. Deviations among host masses for a given circular velocity from the stellar TFR correlate with their Hi mass-to-luminosity ratio (), whereas deviations from the gasstellar TFR do not. Overall, our findings suggest that the baryonic mass in BCGs tends to normal values, but BCGs tend to be inefficient by producing stars, especially toward the low-mass, gas-rich, and bluest hosts, in a similar way to dIs.
Key Words.:
galaxies: dwarf – galaxies: evolution – galaxies: photometry – galaxies: starburst – galaxies: structure1 Introduction
Blue compact galaxies (BCGs, Zwicky, 1965) are gas-rich objects that are currently experiencing a strong burst of star formation (Cairós et al., 2001a; Gil de Paz et al., 2003). Their main characteristics were summarised by Thuan & Martin (1981) as having low luminosity (those BCGs less luminous than 18 are commonly referred to as “blue compact dwarfs”), compactness, and emission line spectra, similar to the Hii regions in spiral galaxies. Moreover, they tend to be low-metallicity systems (, e.g. Terlevich et al., 1991, see also the review by Kunth & Östlin, 2000) and present high star formation rates (0.1–10 M⊙ yr-1, e.g. Fanelli et al., 1988; Gil de Paz et al., 2003). Initially these two combined properties led to conjecture that BCGs are pristine galaxies, in the process of forming their first generation of stars (Sargent & Searle, 1970). However, several deep photometric studies in the optical (e.g., Loose & Thuan, 1986a; Kunth et al., 1988; Telles, 1995; Papaderos et al., 1996a; Doublier et al., 1997, 1999; Cairós, 2000; Bergvall & Östlin, 2002; Cairós et al., 2001a, b, hereafter C01a,b) and in the near-infrared (e.g., James, 1994; Doublier et al., 2001; Noeske et al., 2003, 2005; Cairós et al., 2003) have demonstrated that virtually all BCGs have an older underlying stellar “host” in addition to the present starburst. This supports the idea that BCGs are not truly primordial galaxies, but instead older systems undergoing transient periods of strong star formation (Mas-Hesse & Kunth, 1999). The stellar host generally extends several kpc from the usually centrally concentrated star-forming regions. Thus, the host is generally detectable only at low surface brightness levels, showing elliptical isophotes, and displaying the red colours indicative of an old stellar population (Papaderos et al., 1996b, hereafter P96b; C01a,b; Cairós et al., 2002, 2003; Bergvall & Östlin, 2002).
Despite many studies over several years of investigation, certain questions concerning BCGs still remain open. The assessment of the structural properties of their host galaxy is one of the most important issues in any research of dwarf galaxies. Deriving the ages and chemical abundances of the host is essential to establishing the evolutionary state and the star formation history of the BCG class. Furthermore, the possibility of evolutionary connections linking BCGs and other dwarf galaxies, namely dwarf irregulars (dIs), dwarf elliptical (dEs), and low surface brightness (LSB) galaxies, is a fundamental issue that has still not benn resolved. In particular, the comparison of the structural properties, average colours, and colour gradients between the different dwarf classes are crucial to testing the proposed evolutionary scenarios and elaborating a general view of their formation and evolution (Thuan, 1985; Davies & Phillips, 1988; Papaderos et al., 1996a; Marlowe et al., 1997, 1999; Caon et al., 2005).
For carrying out quantitative studies of the host’s properties and go further into the above problems, the main handicap is the host faintness (typically 23 mag arcsec-2), which requires a great deal of observational and analysis effort. Moreover, the contamination caused by the starburst makes the derivation of accurate structural parameters and colours of the host still more complicated. In the past decade, there have been several studies devoted to deriving the structural parameters of the host, in the optical and in the NIR, by analysing their radial surface brightness profiles (Doublier et al., 1997, 1999; Marlowe et al., 1997; Noeske et al., 2003, 2005; Vaduvescu et al., 2005; Gil de Paz et al., 2003; Caon et al., 2005; Cairós et al., 2003, 2002, C01a,b). However, the derived structural parameters of the host component have been very dependent on several factors, such as the extraction of the radial profile and the fitting procedure. Each of the different methods has its own drawbacks, resulting in information loss from the image (Bagget et al., 1998). Moreover, the strong dependence on the quality of the analysed dataset, the model used to describe the host light profile, and the accuracy in subtracting , i.e. masking out, the starburst emission from the BCG light profile, have in general provided discrepant results (see Kunth & Östlin, 2000; Gil de Paz et al., 2003; Cairós, 2000; Cairós et al., 2003; Caon et al., 2005) which could lead to unreliable conclusions.
Two-dimensional algorithms that able to derive structural parameters directly from the galaxy image, e.g. gim2d (Simard, 1998), galfit (Peng et al., 2002), gasp-2d (Méndez-Abreu et al., 2008) have opened a new perspective on the BCG hosts. In Amorín et al. (2007), hereafter Paper I, we developed a new 2D technique based on galfit for fitting the host in BCGs. Their advantages and limitations were discussed at some length by using simulated galaxies and observations of eight carefully selected BCGs for which a deep 1D analysis had previously been carried out by Caon et al. (2005). One of the main conclusions of Paper I is that if using accurate masks and performing consistency checks, the 2D fitting method is robust and allows us to extract accurate structural parameters. An important strength of the technique is the isolation of the starburst emission. Accurate masks closely following the starburst dominant region in shape and size allow us to fit the host in a larger portion of the galaxy and in a wider range of surface brightnesses.
In this paper we present host 2D fits for a large sample of BCGs by using the same technique as in Paper I. The goal of this paper is to derive the structural parameters of 20 BCG for which underlying emission or low surface brightness features have been detected. We also included the 8 BCGs previously fitted in Paper I, finishing the 2D characterisation of the large sample, representative of the BCG class, already studied in C01a by using a 1D technique. Furthermore, we aim to explore the global properties of the hosts derived from their structural parameters, colours and Hi gas content, as well as their position in scaling relations, such as the Tully–Fisher relation, compared with those of other galaxy types. The paper is structured as follows. In § 2 we present the data. In § 3 we summarise the main aspects of the methodology. Our results are presented in § 4 and discussed in § 5. Finally, § 6 summarises our main conclusions.
2 Sample
The full sample is composed of 28 star-forming galaxies, all of them already studied by our group in several previous papers (e.g., C01a,b, Caon et al., 2005, Paper I). A complete description of the sample, 111see http://www.iac.es/proyect/GEFE/BCDs/BCDframe.html observations, data reduction, calibration procedures, and surface photometry, as well as a collection of colour maps and H images, were presented in C01a and C01b. The selection criteria, described in C01a, include low-luminosity, compactness, and spectra similar to those of Hii regions, when available.
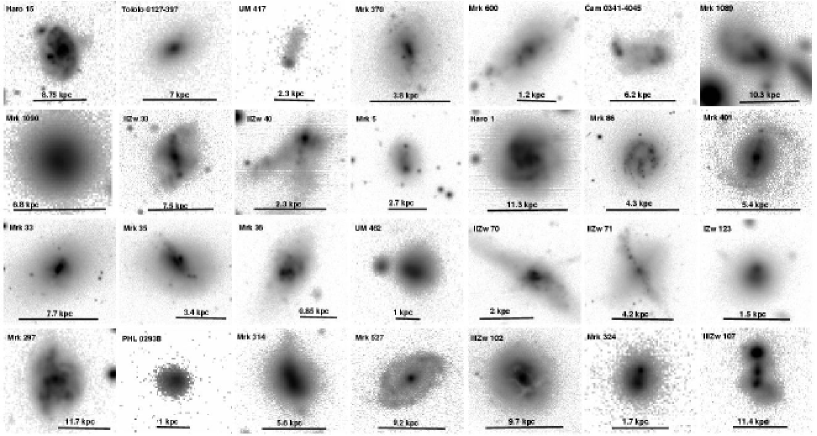
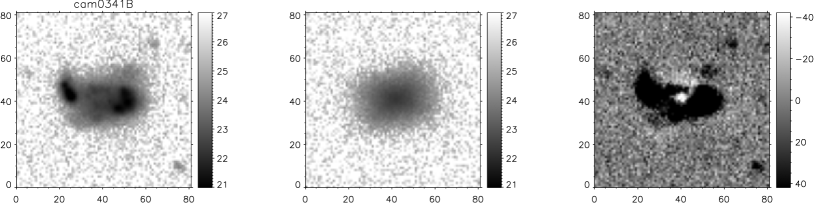
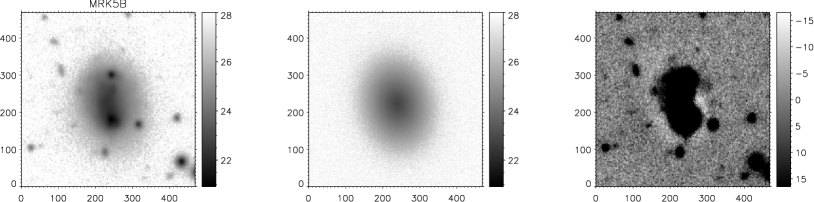
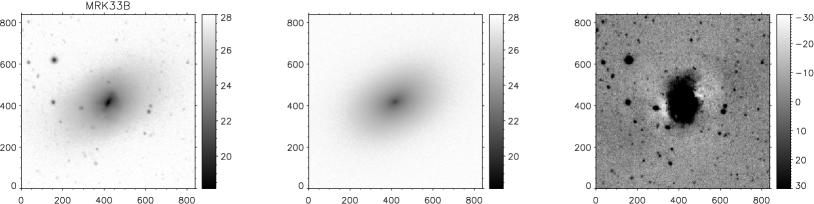
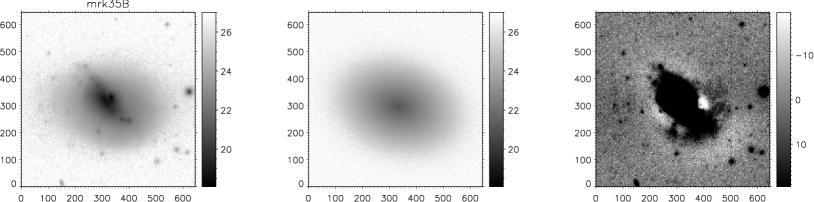
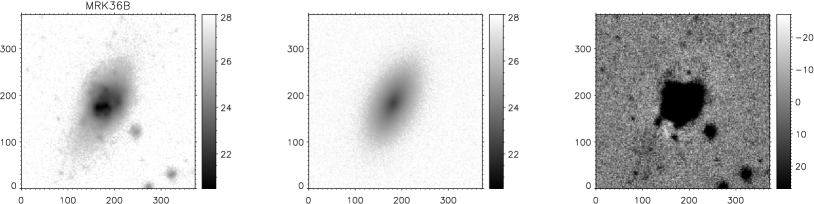
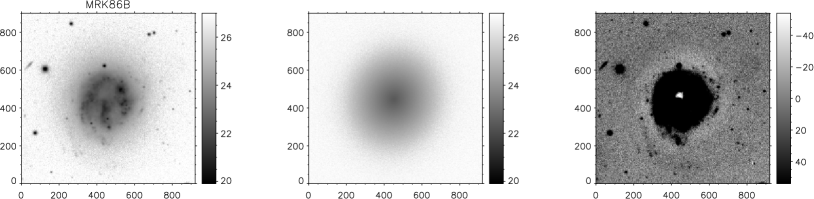
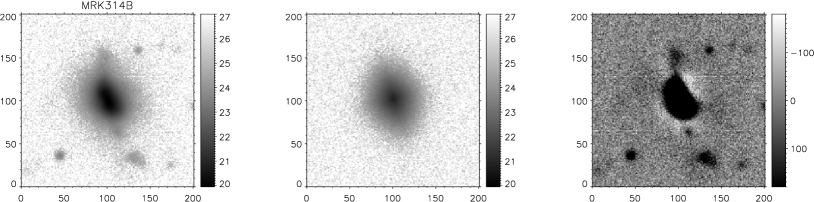
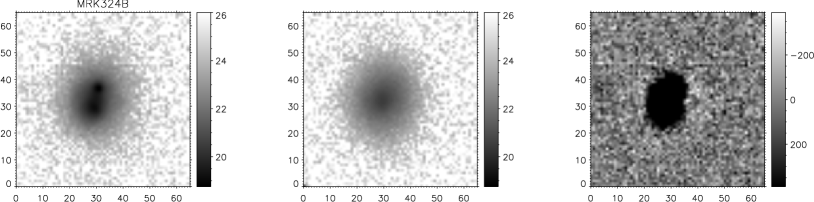
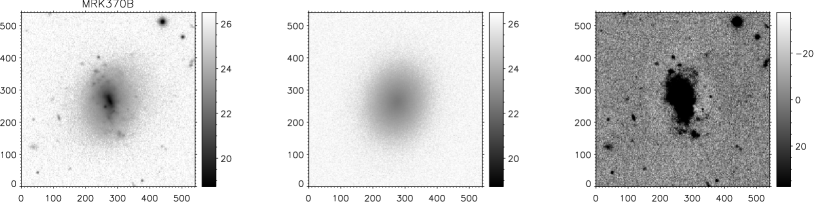
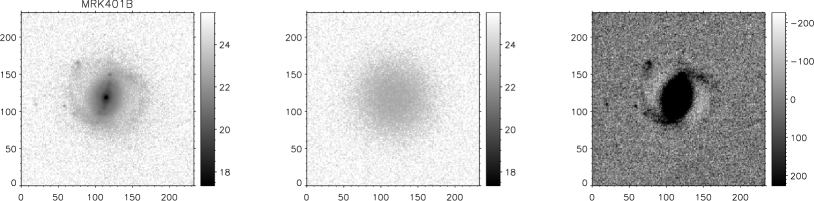
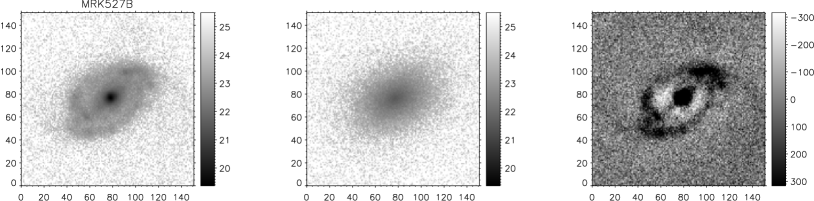
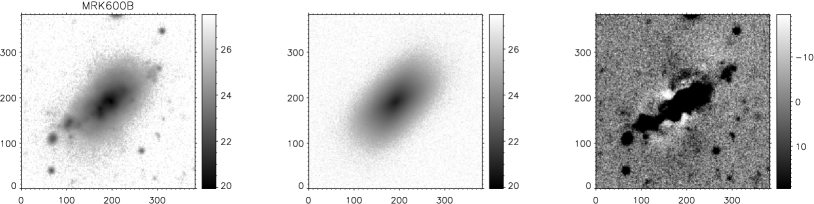
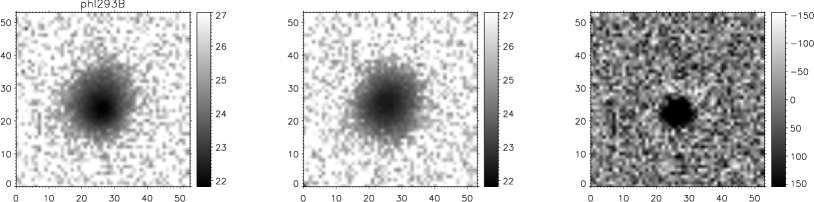
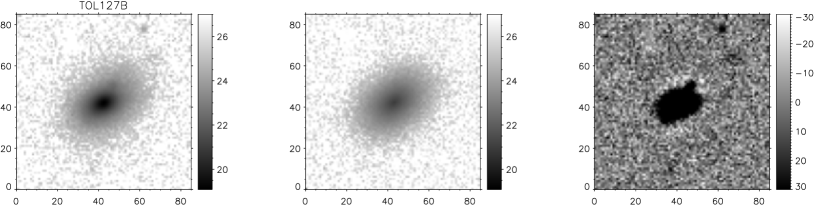
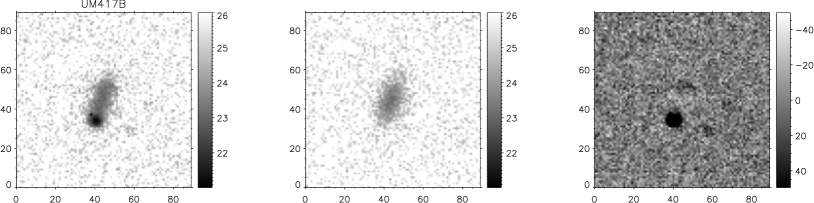
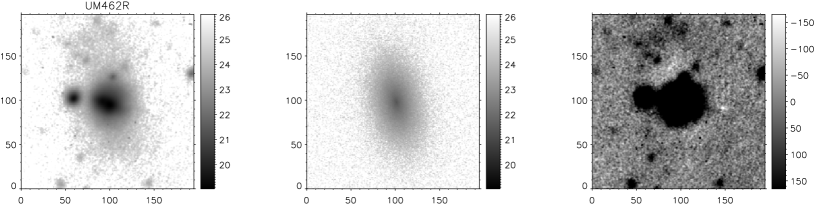
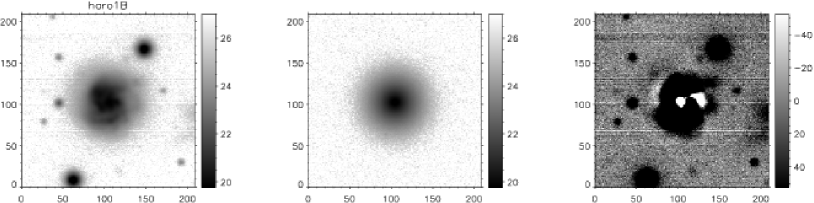
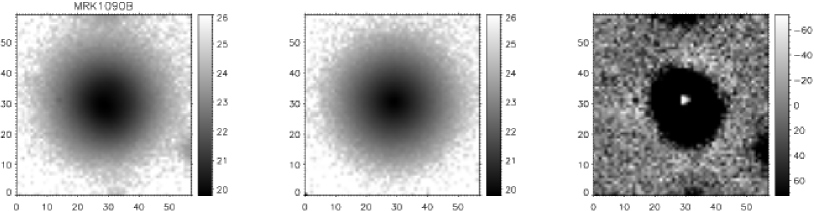
-band images of the galaxies are presented in Fig. 1. An inspection of the sample reveals that galaxies cover a wide range of luminosities ( MB ) and morphological BCG classes, such as those defined by Loose & Thuan (1986a) from their optical morphologies. They go from small, compact objects dominated by a central star-forming region, to large and more extended objects in which star formation is spread out almost over the whole galaxy at high surface brightness levels. Moreover, several galaxies show particular morphological features such as bars, or typical signs of interactions, such as tails. Indeed, two galaxies (Mrk 527, Mrk 401) are luminous starburst galaxies rather than classical BCGs and show incipient spiral features (C01a).
Table 1 summarises some of the galaxies’ basic data collected from previous studies. It includes distances and extinction coefficients that will be used in the present paper. Through this paper a Hubble constant of H75 km s-1 Mpc-1 has been used.
| Galaxy | RA(J2000) | Dec.(J2000) | D (Mpc) | (mag) | (mag) | (mag) | |
|---|---|---|---|---|---|---|---|
| (1) | (2) | (3) | (4) | (5) | (6) | (7) | (8) |
| Cam 0341-404 | 03 42 49.4 | 40 35 56 | 56.69 | 0.068 | 16.62 | 0.36 | 17.21 |
| Haro 1 | 07 36 56.4 | 35 14 31 | 52.11 | 0.184 | 12.79 | 0.54 | 20.98 |
| Haro 15 | 00 48 35.9 | 12 43 07 | 84.15 | 0.101 | 14.06 | 0.35 | 20.67 |
| Mrk 5 | 06 42 15.5 | 75 37 33 | 13.96 | 0.364 | 15.58 | 0.60 | 15.51 |
| Mrk 33 | 10 32 31.9 | 54 24 03 | 22.30 | 0.052 | 13.46 | 0.41 | 18.33 |
| Mrk 35 | 10 45 22.4 | 55 57 37 | 15.60 | 0.031 | 13.21 | 0.61 | 17.79 |
| Mrk 36 | 11 04 58.5 | 29 08 22 | 10.43 | 0.131 | 15.38 | 0.35 | 14.84 |
| Mrk 86 | 08 13 14.7 | 45 59 26 | 8.12 | 0.232 | 12.41 | 0.73 | 17.37 |
| Mrk 297 | 16 05 12.9 | 20 32 32 | 65.10 | 0.330 | 13.16 | 0.44 | 21.24 |
| Mrk 314 | 23 02 59.2 | 16 36 19 | 28.95 | 0.383 | 14.15 | 0.07 | 18.53 |
| Mrk 324 | 23 26 32.8 | 18 16 00 | 22.43 | 0.215 | 15.39 | 0.58 | 16.58 |
| Mrk 370 | 02 40 29.0 | 19 17 50 | 10.85 | 0.399 | 13.59 | 0.53 | 16.99 |
| Mrk 401 | 09 30 17.0 | 29 32 24 | 24.07 | 0.101 | 13.82 | 0.01 | 18.19 |
| Mrk 527 | 23 13 12.7 | 06 19 18 | 47.56 | 0.473 | 13.58 | 0.55 | 20.28 |
| Mrk 600 | 02 51 04.6 | 04 27 14 | 12.81 | 0.282 | 15.29 | 0.31 | 15.53 |
| Mrk 1089 | 05 01 37.8 | 04 15 30 | 52.65 | 0.220 | 14.05 | 0.08 | 19.78 |
| Mrk 1090 | 05 01 44.1 | 04 17 19 | 51.93 | 0.238 | 15.16 | 0.10 | 18.65 |
| PHL 0293 B | 22 30 33.9 | 00 07 35 | 21.39 | 0.302 | 17.65 | 0.51 | 14.30 |
| Tololo 0127-397 | 01 29 15.8 | 39 30 37 | 61.05 | 0.067 | 16.18 | 0.51 | 17.81 |
| UM 417 | 02 19 30.2 | 00 59 11 | 35.08 | 0.141 | 18.04 | 0.29 | 14.83 |
| UM 462 | 11 52 37.3 | 02 28 10 | 14.12 | 0.083 | 14.69 | 0.47 | 16.14 |
| I Zw 123 | 15 37 04.2 | 55 15 48 | 12.52 | 0.062 | 15.46 | 0.55 | 15.09 |
| II Zw 33 | 05 10 48.1 | 02 40 54 | 36.41 | 0.439 | 15.02 | 0.81 | 18.22 |
| II Zw 40 | 05 55 42.6 | 03 23 32 | 9.69 | 3.538 | 15.18 | 1.12 | 18.29 |
| II Zw 70 | 14 50 56.5 | 35 34 18 | 19.12 | 0.053 | 14.85 | 0.41 | 16.61 |
| II Zw 71 | 14 51 14.4 | 35 32 32 | 19.64 | 0.055 | 14.46 | 0.56 | 17.06 |
| III Zw 102 | 23 20 30.1 | 17 13 32 | 22.71 | 0.109 | 12.61 | 0.76 | 19.28 |
| III Zw 107 | 23 30 09.9 | 25 31 58 | 78.09 | 0.259 | 15.08 | 0.60 | 19.64 |
-
Notes. Columns: (2) Right ascension in hours, minutes and seconds; (3) Declination in degrees, arcminutes and arcseconds; (4) Distance, computed assuming a Hubble flow with a Hubble constant = 75 km s-1 Mpc-1, after correcting recession velocities relative to the centroid of the local group for Virgocentric infall; (5) Extinction coefficient in the band, from Schlegel, Finkbeiner, & Davis (1998); (6) Asymptotic magnitude in the band, from C01b. Note that the asymptotic magnitudes listed in C01b were corrected for Galactic extinction following Burstein & Heiles (1984); here they are presented uncorrected; (7) BV colour from the asymptotic photometry of C01b, uncorrected for galactic extinction; (8) Absolute magnitude, obtained from the asymptotic magnitudes of (6) recomputed using the Schlegel, Finkbeiner, & Davis (1998) extinction values, distances were taken from those tabulated in (5);
3 Fitting the BCG host galaxy: methodology
To derive the structural parameters of the host, we adopted the two-dimensional fitting methodology developed and presented in detail in Paper I. Our method uses the software galfit v 2.0.3c 222Detailed information on galfit and its implementation can be found online, http://zwicky.as.arizona.edu/ cyp/work/galfit/galfit.html (Peng et al., 2002) for fitting a two-dimensional model to the host galaxy light distribution. We refer the reader to Paper I for a detailed explanation of the fitting technique. A summary of the main features of the method is given here, with some remarks about its implementation to this sample.
Based on the appearance of the surface brightness profile, C01a find for this sample that approximately 50% of the galaxies are objects with “composite” profiles that cannot be fitted by a single exponential or law over the whole intensity range (see their Fig. 2). Most galaxies in the sample were described in C01a by an exponential model in their very outer profiles, i.e. the region where the light is dominated by the host galaxy. However, subsequent papers devoted to analysing the structure of BCGs by using this and other samples in the optical and NIR regimes, have shown that several BCGs may present light profiles with significant deviations from a pure exponential (e.g., Cairós et al., 2003; Noeske et al., 2003; Caon et al., 2005). In this project, and following our previous studies (Caon et al., 2005, and Paper I), we explored the suitability of the Sérsic law (Sersic, 1968) to fit the host galaxy of our BCG sample. The Sérsic law can be expressed as
| (1) |
where is the intensity at the effective radius , which encloses half of the total light from the model (Caon et al., 1993). The constant is coupled with the Sérsic index, , and can be approximated as 2 (e.g., Graham et al., 2001). The Sérsic law presents two particular cases, when and ; the first is a pure exponential model whereas the second is the law. The Sérsic profile has been shown to describe the light distribution in ellipticals (from dwarfs to the brightest cluster members, (Caon et al., 1993; Graham et al., 1996; Graham & Guzmán, 2003; Gutiérrez et al., 2004; Aguerri et al., 2004, 2005a; Kormendy et al., 2009), LSB galaxies (Cellone et al., 1994), and spiral bulges (Andredakis et al., 1995; Prieto et al., 2001; Aguerri et al., 2003, 2005b; Méndez-Abreu et al., 2008) besides BCGs (e.g., Cairós et al., 2003; Caon et al., 2005; Cairós et al., 2007, ; Paper I; this paper). This way, Sérsic models will allow us to explore a number of galaxy structures and compare their properties for the BCG hosts with those of other galaxy types.
The 2D models fitted by galfit v 2.0.3c are axially symmetric, generalised ellipses (Athanassoula et al., 1990), which have a centre (,) and a shape that is given by their axial ratio (), position angle (), and the boxy/discy parameter (). This gives different shapes to the entire component depending on its values: (discy shape), (pure ellipse), and (boxy shape). In addition to the above five, the three Sérsic free parameters, i.e. total apparent magnitude (), effective radius (), and Sérsic index () were obtained by galfit using a nonlinear fitting procedure that minimises the distribution of the residuals (image model) weighting each pixel with its own noise, i.e. the Poisson error at the pixel position, after convolving models with a given PSF image. This procedure starts from an initial guess at the free structural parameters. These values (except , which was initially assumed as zero) were taken from previous fits of their 1D surface brightness profiles (see C01a; C01b; Caon et al., 2005). To take the seeing of the images into account, the Sérsic models were convolved by galfit by using a star selected from each image.
Following the prescriptions given in Paper I, a special effort was made to fit only those regions free of the starburst emission and all possible spurious sources that could contaminate the 2D models. Therefore, all background and foreground sources, cosmic rays and possible bad pixels were masked out from galaxy images by using the iraf/pros task plcreate. To mask out the starburst contribution from the fits, we made a first-guess set of elliptical masks by using the iraf/pros tasks plcreate and imreplace. We obtained different sized masks from the smaller ones following the inner isophotes, i.e. masking out the starburst peak(s), up to the larger ones, following the shape of the outer isophotes, i.e. as needed to ensure that the entire starburst emission was completely masked out. Then, for a given galaxy, the procedure generated several different models, one for each mask. In this way, we analysed the influence of the starburst contamination on the Sérsic parameters by plotting the free parameters of each model versus the size of its mask, . From these plots we can usually distinguish , i.e. the radius beyond which starburst emission is practically absent (see also P96a or C01b), and the range where the structural parameters are expected to be stable. Then, we used the positive residuals (galaxymodel) of those models where to refine the mask in shape and size in an iterative process. Finally, we obtained a new improved mask that follows the actual shape of the starbust emission. The final solution was obtained from those models fitted with the best improved mask, which gives the minimum residuals. Several examples that illustrate this procedure can be found in Paper I.
3.1 Error sources
When fitting a Sérsic law in BCGs, one may identify two main sources of uncertainty: the limited portion of galaxy able to be used in the fit and the sky subtraction uncertainties (e.g. C03; Noeske et al., 2003, 2005). In Caon et al. (2005) and Paper I, we analysed these drawbacks for both 1D and 2D BCG profiles, respectively. Although these error sources depend on the data quality, even when the same dataset was analysed, two-dimensional fits were found to be more robust for recovering the structural parameters when a limited number of pixels and surface brightness intervals were fitted. By using ideal simulations and the eight best quality and deepest galaxy images, we have shown that relative deviations of about 10–20% are generally expected for low models when the radius of the masked region is between 1 and 2, whereas for higher values deviations increase considerably with the size of the mask.
On the other hand, the fainter surface brightness levels of the galaxy images are affected by inhomogeneities in the sky background. The noise and the sky background subtraction uncertainties are propagated to the Sérsic parameters, which could become unstable, especially for higher values. This drawback, especially associated with the Sérsic profile, has been observed in several recent papers (e.g. Cairós et al., 2003; Caon et al., 2005, Paper I). Two independent sky estimates were considered in our procedure. The first mean value was derived from several measurements of different boxes, free of sources, surrounding the galaxy (see C01a). The second mean value was obtained by masking out all sources with a flux greater than 0.5 times the mean rms of the background, and then fitting with galfit only a polynomial function to the entire image (see Paper I). Generally, both results agree within 0.5% of the measured sky. In this way, the galaxies were fitted with a Sérsic function plus a fixed sky function for both sky mean estimates, also considering the sky level as an additional free parameter. These three sets of free parameters were inspected to check the consistency among values and to estimate the uncertainty involved in the sky-subtraction.
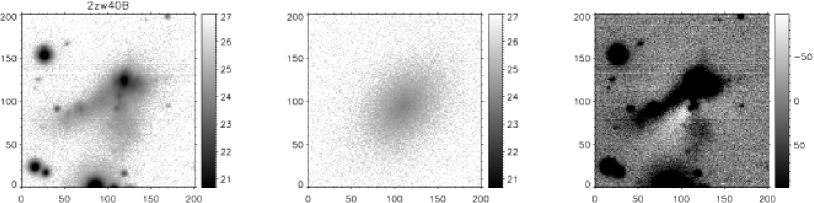
Another systematic uncertainty affecting the fits comes from the galaxies not being perfect ellipsoids. This could be a remarkable weakness of the method, especially in BCGs with complex morphologies, where the derived structural parameters should be taken as their best average values. Our sample contains several BCGs showing isophotal twists and irregularities even in their outer regions (see e.g. II Zw 40), so they show large systematic residuals after fitting the 2D models. Most BCGs of the sample, however, belong to the morphological classes nE and iE proposed by Loose & Thuan (1986b) i.e. nuclear and irregular starburst, respectively, with an regular outer envelope, showing negligible systematic residuals in the fitted region.
3.1.1 Consistency checks
To assess the reliability of the structural parameters, we need to carry out some consistency checks. First, we analyse the accuracy on the estimation. Several studies have revealed that this is crucial for avoiding overestimations in the Sérsic models induced by the starburst contamination (e.g. Caon et al., 2005; Noeske et al., 2005). Here is derived as the radius of a circle that contains the same number of pixels of the mask (see Paper I). Initially, we compared the size of the mask with both the size of the (net) emission when narrow band data was available and with the size of the blue regions (starburst region) from the colour maps derived by C01b. To avoid underestimations in , we also compared its value with the radius at which the colour profile of the galaxy reached a nearly constant maximal value, characteristic of the old stellar component. We used colour profiles ( and ) derived by C01a for the full sample of BCGs. A set of colour profiles were also taken from GdP05 for a limited number of galaxies.
Second, we explored whether a radius range exists where the fit is stable and does not depend on the exact choice of . We show in Paper I that galaxy profiles with generally show a stability range.
Third, because we expect that the stellar host has negligible colour gradients (as shown by the observed behaviour in the outer regions, see for example C01b; Noeske et al., 2005; Gil de Paz & Madore, 2005), both and should be the same in all pass bands (within the errors), whereas the differences in and reflect the host galaxy colours. Finally, a reasonable agreement between ellipticity, position angle, and coefficient in different bands is desirable.
4 Results
The results of the 2D fitting of a Sérsic law to the starburst-free regions of the galaxy images, in the available filters, are presented in Table The host in blue compact galaxies: for the sample of 20 galaxies. Additionally, we included the results for the 8 galaxies fitted in Paper I. Columns 3, 4, 5, 7, 8, and 9 show the free parameters fitted by galfit: position angle (), axial ratio (), boxy/discy parameter (), the Sérsic index (), the effective radius (), and the total apparent magnitude of the model (), respectively. Column 6 shows the transition radius, . Columns 10 to 13 show values inferred directly from the models: absolute magnitude of the model (), effective and central surface brightness ( and ) and the surface brightness at the transition radius (). Finally, galaxies have been marked with a quality index, , as shown in Column 14. indicates those galaxies (20/28) for which all consistency checks were fulfilled, while indicates those galaxies (8/28) for which our 2D fitting by using a single Sérsic model were not satisfactory.
4.1 Reliability of the models
Following Paper I, in addition to the formal uncertainties derived by galfit (see Peng et al., 2002), global uncertainties for , , and were computed by measuring their dispersion in the stability range, i.e. where , and the difference between the values obtained when fitting a fixed sky-background and those obtained by setting the sky background level as a free parameter. These uncertainties are listed in Table The host in blue compact galaxies:. Likewise, the scatter of the shape parameters (, and ) and those of and between the different filters could give us another qualitative measure of their uncertainty. For galaxies with , the scatter of the above parameters is as much as 2025%, always smaller than their global uncertainties, and can be explained in terms of the different quality.
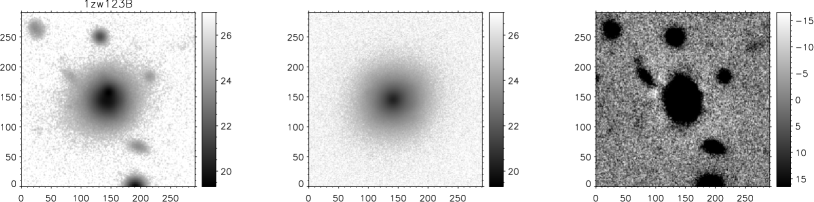
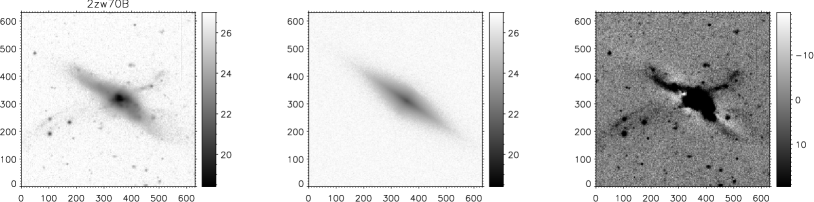
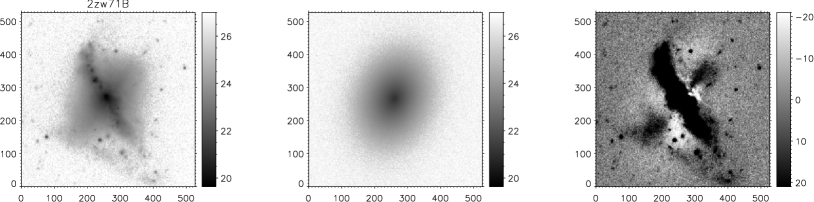
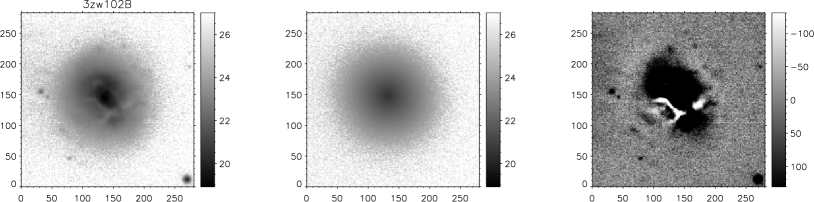
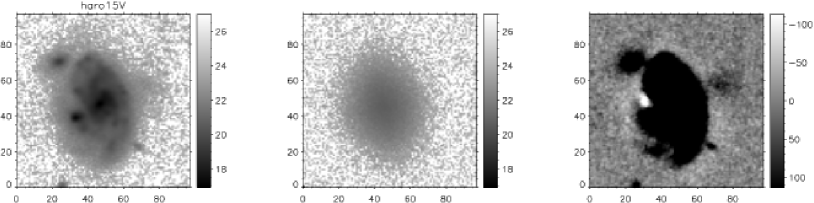
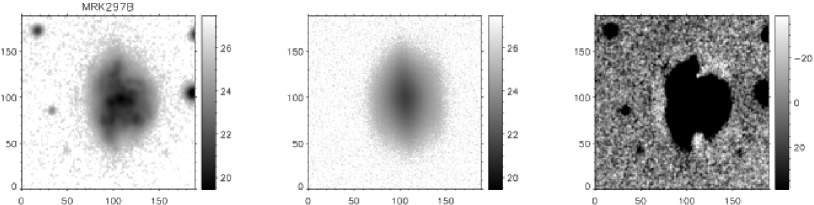
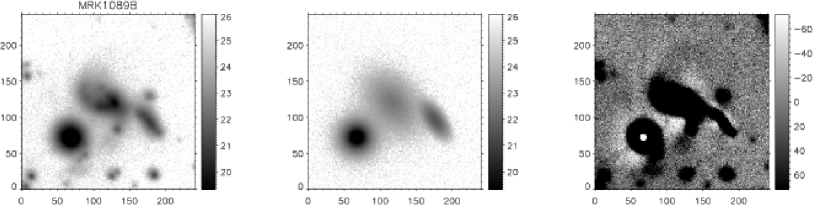
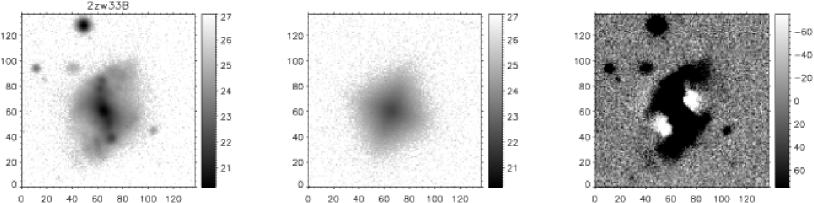
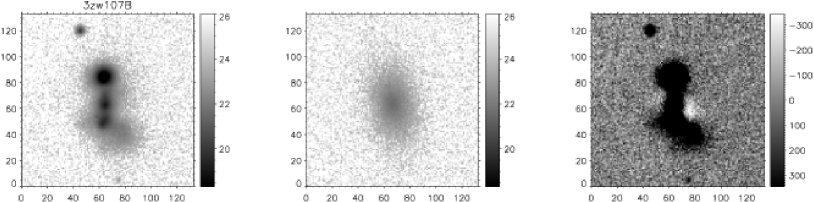
To illustrate the 2D fits, broad-band images, Sérsic models and the residual images for the full sample of 28 BCGs are presented in Figs. 10 and 16333Available in the online version. For the sake of clarity we split the galaxies according to their quality index. A visual inspection of the residuals reveals those regions dominated by the starburst and those regions where the axially symmetric models cannot reproduce the host galaxy morphology, e.g. II Zw 71 or II Zw 40. In some galaxies it is also possible to distinguish complex features, such as spiral arms e.g. Mrk 401 and Mrk 527, dust lanes e.g. III Zw 102, or tails e.g. II Zw 70. Overall, morphologies of the host galaxies with are mostly reproduced with the , and parameters.
Twenty galaxies (8 from Paper I, and 14 from this paper) show , fulfilling all the proposed consistency checks. For these galaxies we found values in good agreement with the radii at which their colour profiles reach a nearly constant value. Small differences ( 3 arcsec) may be attributed to the sometimes large error bars in the colour profiles and to the different way to measure both radii. We also estimated the intervals of surface brightness and galaxy radius used in the fits as and , where and are respectively the surface brightness and the radius of the outer reliable isophote, taken from the radial profiles presented in C01a. For galaxies, a mean surface brightness interval of about 3.9 magnitudes and a coverage of the radial profile of about 67% were obtained. Only three galaxies show magnitudes (UM 417, UM 462, and Cam 0341-404), with a fitted radial range of about 50%. We notice, however, that these estimations are lower limits since those galaxy pixels are fitted by galfit down to the outer limits of the radial profiles presented in C01a. For models the ratio varies between 0.55 (UM 417 ) and 1.85 (UM 462 ).
Six of the eight galaxies with did not pass the consistency checks for a number of reasons. The luminosity of the host model was greater than the luminosity of the whole galaxy (IIZw 33 and Mrk 1090). The fitted region was too small, i.e. 2 (Haro 15, Haro 1, Mrk 297, IIIZw 107), and in the case of IIIZw 107; in addition, the light contamination caused by a bright foreground star located over the galaxy at the north of the image (see Fig. 1). In the remaining galaxies, two low surface brightness tails (IIZw 40) and the proximity of companions (Mrk 1089 and Mrk 1090) affect the stability of the fitted parameters, and no unique solution is obtained in these last cases (several solutions with similar value).
Seven of the eight galaxies with have been reported in the literature as probable mergers or interacting galaxies: Mrk 297, a merging system (e.g., Smith et al., 1996; Israel, 2005); Mrk 1089 and Mrk 1090, a merging system, which are members of the Hickson Compact Group 31 (Hickson, 1982; Iglesias-Paramo & Vilchez, 1997b; Rubin et al., 1990); Haro 15, strongly interacting separated galaxies or advanced merger (Mazzarella et al., 1991); Haro 1, a paired galaxy (Schneider & Salpeter, 1992); IIZw 40, morphology interpreted as an interaction (Baldwin et al., 1982; Brinks & Klein, 1988) and merger of two gas-rich dwarf galaxies (Sage et al., 1992; Joy & Lester, 1988; Deeg et al., 1997); and IIZw 33, morphology interpreted as an interaction (Méndez et al., 1999). Interestingly, six of the eight galaxies with are the most luminous ones in the full (28) sample. Excepts Mrk 1090, it is remarkable to note that the above galaxies show the most irregular hosts in the sample.
4.2 Derived properties
| Parameter | B | V | R | Ref. |
|---|---|---|---|---|
| 1.15 (0.55) | 1.12 (0.44) | 1.12 (0.45) | ||
| 1.11 (0.74) | 1.05 (0.71) | 1.09 (0.60) | ||
| 1.36 (1.23) | 1.22 (1.14) | 1.19 (0.72) | ||
| 0.84 | 1.06 | |||
| 1.10 | 1.25 | |||
| 0.83 | ||||
| 22.59 (0.68) | 22.19 (0.75) | 21.95 (0.76) | ||
| 23.56 (0.97) | 22.92 (0.98) | 22.53 (1.02) | ||
| 23.5 | 22.8 | |||
| 23.1 | 22.5 | |||
| 22.8 |
-
Notes. References: This work; C01a; Gil de Paz et al. (2003); Papaderos et al. (1996a); Hunter & Elmegreen (2006). Effective radii, , and surface brightnesses, , are expressed in kiloparsecs and magnitudes per square arcseconds. Values in parentheses indicate the standard deviation for the sample. Sérsic index for the , , , and references may be considered as 1, since in these papers a pure exponential profile was fitted to the host surface brightness distribution.
We have derived several properties of the BCG sample concerning the two major components: the host and the starburst. In particular, we examined correlations among colours and structural parameters of the 2D host Sérsic models (from Table The host in blue compact galaxies:) with quantities such as the Hi gas properties from the literature (see Table 1). Linear correlations were fitted taking the parameter uncertainties into account by using the routine fitexy of Press et al. (1992). Those galaxies with “poor” fits ( in column 15 of Table The host in blue compact galaxies:) were not used in the following analysis. Galaxies in the well-fitted subsample of 20 are all “classical” dwarf systems according to their luminosities, i.e. 19.
Mean structural parameters and their standard deviations in B, V, and R are presented in Table 2. For comparison, some values from the literature were also added. Mean values for and agree, within the scatter, with previous findings. However, slightly brighter mean values have been obtained, probably the product of using a Sérsic profile instead of pure exponential models (used by the other authors) for the host component. The mean colours and standard deviations of the hosts are 0.540.27 and 0.950.26.
4.2.1 Global colours
The host colours have been derived from the 2D fits by using the extinction-corrected magnitudes of the Sérsic model (see Table The host in blue compact galaxies:). Colours of the BCGs, i.e. derived from the asymptotic photometry (see C01b) and the colours of their hosts were compared. Overall, we found that the presence of a starburst component makes the BCG about 0.2 magnitudes bluer in . Our BCG sample shows a wide range in the colour of their hosts (1 mag). No clear correlation is found, however, between the colours and structural parameters of the hosts.
In Fig. 2 we show the hosts distribution in the and diagrams. The colours do not correlate with luminosity. However, three groups of galaxies may be roughly differentiated by their colours, especially in . While several galaxies lie near the median (dashed line), in the extremes of the colour distribution we see both a relatively “red” group of galaxies, namely Tololo 0127-397,Mrk 86, Mrk 324, Mrk 33, II Zw 123, and IIIZw 102, and a “blue” group, namely UM 462, UM 417, Mrk 600, Mrk 5, Mrk 401, PHL 0293B, Cam 0341-404, and II Zw 70. The mean colours and standard deviations for the “red” and “blue” groups are 0.860.26 and 0.300.08, and 1.290.10 and 0.660.07, respectively. In Fig 2 (left) we added two crosses indicating these mean values for the two groups.


4.2.2 Correlations among the structural parameters
To explore trends among the host structural parameters and their luminosities, Fig. 3 shows the Sérsic parameters , , and versus the band absolute magnitude (from Table The host in blue compact galaxies:). In the upper plot of Fig. 3 we see that all the galaxies but one (Mrk 33) show hosts with Sérsic indexes 2. Although the scatter is large, an approximately constant mean value 1 is obtained in the whole range of host luminosities (see Table 2). We see that 50% of the galaxies are well-fitted by “pure” exponential light distributions (1). The other 50%, however, show more than 30% deviations from the pure exponential model.
No clear correlation between and was found, as shown in Fig. 3 (centre). The sample spans more than two magnitudes in effective surface brightness over the whole range of luminosity, with a constant behaviour similar to . The same result, although with wide scatter, is obtained when the extrapolated central surface brightness is plotted.
In contrast, and are closely correlated, as shown in Fig. 3 (bottom). Linear fits to the data give
| (2) |
with a Spearman rank index of 0.88. From this, we may conclude that the more luminous hosts are more extended. Similar trends were found for dwarf galaxies, including BCGs, by other authors in the optical (e.g., Vennik et al., 2000; Bergvall et al., 1999) and in the NIR regime (e.g., P96b; Papaderos et al., 2002; Vaduvescu et al., 2005, 2006).
The above results will be discussed in §5 when a comparison is made with other galaxy types.
4.2.3 Luminosities and sizes of the starburst and it host galaxy
Assuming that the total luminosity of a BCG comes exclusively from two galaxy components, i.e. the host (described by the Sérsic law) and the starburst episode, we computed the starburst luminosity as , where was taken from C01b (see Table 1). In addition, we adopted the transition radius as an estimate of the starburst average size.
Figure 4 shows the strong correlation between the starburst and host -band absolute magnitudes. We see that galaxies with more luminous hosts show luminous starbursts. Their relative strength, i.e. the ratio between the luminosities of both hosts and starbursts, is plotted versus the host blue absolute magnitude in Fig. 4. There is large scatter, and a very weak correlation () is noticed only when the outlier (Mrk 36) is excluded. Thus, there is no clear evidence that the relative strength of the starburst scales with galaxy mass. This result agrees with Vaduvescu et al. (2006) (see their Fig. 8), who did not see correlation between the relative strength of the starburst and the -band luminosity of the host. Here, the mean ratio 1.15 0.65 (0.930.5 when excluding the outlier) is equivalent to saying that, when the host galaxy suffers a starburst episode, its -band luminosity increases by mag. In the optical, we found a wide range of values for in the literature (e.g. Drinkwater & Hardy, 1991; Meurer et al., 1992; Taylor et al., 1994, ; P96b). Our values are in good agreement with those of P96b.
In Figs. 4 and 4 we have plotted the effective radius and the transition radius versus the -band absolute magnitude of the starburst, while Figs. 4 and 4 show the host effective radius and -band absolute magnitude versus the transition radius. All previous quantities are correlated, their linear fits being given by
| (3) |
| (4) |
| (5) |
| (6) |
with Spearman’s rank indexes 0.89, 0.93, 0.88, and 0.86, respectively. The strong correlations tell us that the average size and the luminosity of the starburst emission does depend on the extent of the galaxy. Furthermore, since more luminous galaxies show more luminous starbursts, clear linear relationships between both and with the starburst luminosity are found. These results support the picture presented by P96b: although star formation in BCGs should occur at random locations, the total average size of the star-forming region does depend on the extent of the host. This suggests that, therefore, the starburst episode in this sample of BCGs is regulated by the galaxies themselves on large scales, and does not depend on external issues.
 |
 |
 |
4.2.4 Structure and gas content
For those galaxies for which Hi mass data were available in the literature, we explored possible correlations between the gas content of the galaxies and their optical sizes and luminosities. Data on Hi gas mass and line widths, as well as the Hi gas mass-to-–band host luminosity ratio, are listed in Table 3. For the sake of consistency, Hi masses from the literature were re-calculated by using the same distances as for estimating the optical absolute magnitudes (see Table 1).
| Galaxy | MHI | M | Ms | M | |
|---|---|---|---|---|---|
| [km s-1] | [109 M⊙] | [M⊙] | [109 M⊙] | [M⊙] | |
| (1) | (2) | (3) | (4) | (5) | (6) |
| Mrk 5 | 90 | 0.14 | 0.41 | 0.07 | 0.86 |
| Mrk 33 | 196 | 0.54 | 2.19 | 3.55 | 0.34 |
| Mrk 35 | 135 | 0.68 | 1.15 | 0.98 | 0.80 |
| Mrk 36 | 78 | 0.03 | 0.85 | 0.03 | 0.87 |
| Mrk 86 | 87 | 0.32 | 2.40 | 1.75 | 0.44 |
| Mrk 314 | 269 | 2.51 | 0.09 | 0.21 | 1.11 |
| Mrk 324 | 135 | 0.23 | 1.37 | 0.50 | 0.67 |
| Mrk 370 | 187 | 0.29 | 1.12 | 0.83 | 0.40 |
| Mrk 401 | 148 | 0.82 | 0.38 | 0.57 | 0.55 |
| Mrk 600 | 102 | 0.24 | 0.28 | 0.05 | 1.22 |
| PHL 293 B | 124 | 0.20 | 0.47 | 0.03 | 3.41 |
| I Zw 123 | 105 | 0.06 | 1.25 | 0.12 | 0.68 |
| II Zw 70 | 123 | 0.43 | 0.45 | 0.10 | 1.84 |
| II Zw 71 | 180 | 0.95 | 1.00 | 0.65 | 1.41 |
| III Zw 102 | 183 | 1.98 | 1.94 | 7.88 | 0.49 |
-
Notes. Columns: (2) Hydrogen line width at 20% after inclination and random motion corrections (see §5.2).(3) HI mass after correcting from differences in galaxy distances (see text). The original quantities of (2) and (3) were taken from Thuan & Martin (1981) excepting Mrk 36, Mrk 324, Mrk 370 and III Zw 102 for which line width data was taken from Springob et al. (2005). (4) Mass-luminosity relation derived for the BCG hosts (see §5.2); (5) Stellar mass, estimated from the host absolute magnitudes (see Table The host in blue compact galaxies:) and the values listed in (4); (6) HI gas mass-to-–band host luminosity ratio.
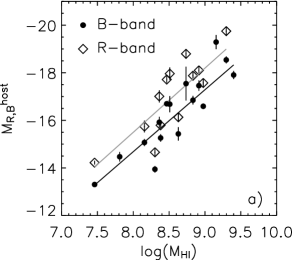
In Fig. 5 we plot the and -band absolute magnitudes of the host versus the neutral hydrogen mass, . Linear correlations in both filters give
| (7) |
| (8) |
(0.89 and 0.84, respectively). These correlations follow the same trend as those found by Staveley-Smith et al. (1992) (see their Fig.2) for the -band luminosity of the entire galaxy (hoststarburst). Moreover, since sizes and luminosities are correlated (see Fig. 3 and 4, see also Staveley-Smith et al., 1992; Campos-Aguilar et al., 1993) a relationship between sizes (of both the starburst and the host) and gas content should be expected. By simultaneously fitting the starburst and the host components of 12 BCGs, P96b found a correlation between the starburst diameter and the total Hi mass (see their Fig. 3). A similar correlation is observed here between and , as shown in Fig. 5. The linear fit gives
| (9) |
( 0.85). The above correlation confirms the result obtained by P96b, showing that galaxies with larger gas reservoirs are more extended, and they also show extended starbursts (see Eq. 4).
The Hi mass-to-blue luminosity ratio, , does not depend on the size of the galaxy components but on its colours. In Fig. 5 we plot the ratio between the Hi mass and the -band luminosity versus the colour of the host. The linear fit to the data gives
| (10) |
( 0.63). Despite the large scatter, Eq. 11 suggest that those BCGs with redder hosts show smaller gas fractions than those with bluer ones.
 |
 |
 |
5 Discussion
5.1 The host galaxy of BCGs and possible links with other galaxy types
Several common evolutionary scenarios involving dwarf galaxies types, i.e. BCGs, dIs and dEs, have been proposed and discussed in the literature in the last thirty years (see e.g., Kunth & Östlin, 2000). Some authors (e.g. Thuan, 1985; Davies & Phillips, 1988) have suggested that BCGs could be the link connecting the possible evolution between gas-rich dIs and gas-poor dEs, i.e. dIs should evolve into dEs after repetitive BCG stages. Similarities between dIs and BCGs that support this scenario have been found from their NIR colours (Thuan, 1985), Hi properties (Staveley-Smith et al., 1992) and spatial distributions (Pustil’nik et al., 1995). Moreover, some authors (Cairós, 2000; Bergvall & Östlin, 2002) have found that the structural parameters of BCG hosts are similar to those of other dwarfs. For instance, while BCGs and dIs in the Virgo cluster seem to be similar structurally and dynamically (Vaduvescu et al., 2006), at least 15% of the BCGs in the large sample of Gil de Paz & Madore (2005) could be dEs experiencing a burst of star formation. They also found that BCGs with redder hosts (1 mag) show structural properties compatible with those of dEs.
In contrast, systematic differences between their optical structural parameters led P96b to argue that evolutionary connections between BCGs, dEs, and dIs are possible only if the BCG hosts are able to change their optical structural properties substantially. A more recent extensive comparison between the structural properties of BCGs and dIs by Hunter & Elmegreen (2006) agrees with this claim. Furthermore, the observed neutral gas dynamics put strong constraints on the evolutionary fate of BCGs. Based on gas kinematics, van Zee et al. (2001) conclude that BCGs cannot evolve passively into dEs.
Several of the above results were often obtained with a limited number of objects, different selection criteria, diverse analysis techniques (e.g. for subtracting the starburst emission), or with data of insufficient quality. Thus, no definitive conclusions about a unified evolutionary scheme for dwarf galaxies has been settled.
In this paper we analysed the structural properties of a relatively large sample of BCG hosts by using a 2D fitting technique on deep optical images. In particular, we investigated how the host in our BCG sample relates with samples of different types of galaxies in the diagrams built upon the Sérsic parameters.
Figures 6, 6, and 6 show the -band central surface brightness (), the effective radius (), and the Sérsic index () of the host as a function of absolute -band magnitude, respectively. We also plotted data for other galaxy types: E/S0 galaxies (from Caon et al., 1993; D’Onofrio et al., 1994), dEs in Virgo (from Binggeli & Jerjen, 1998) and in Coma (from Graham & Guzmán, 2003), isolated dIs (from van Zee, 2000), and the exponential disc models of Graham (2003) for the 36 spirals of de Jong & van der Kruit (1994). As shown in §4.1, the central surface brightnesses and Sérsic parameters are nearly constant over the full range of luminosities. In contrast, effective radius is strongly correlated with the -band absolute magnitude. Over the full range of host luminosities, i.e. these trends are different from those observed for dEs and Es, but similar to the trends shown by dIs and spiral discs. However, when inspecting the mean values we found clear differences, especially between BCGs and dIs. The mean -band central surface brightness and the mean effective radius are 20.281.44 mag and 1.110.74 kpc, respectively, two magnitudes brighter than and twice as large as those for Van Zee’s isolated dIs ( 22.270.92 mag and 2.251.72 kpc).
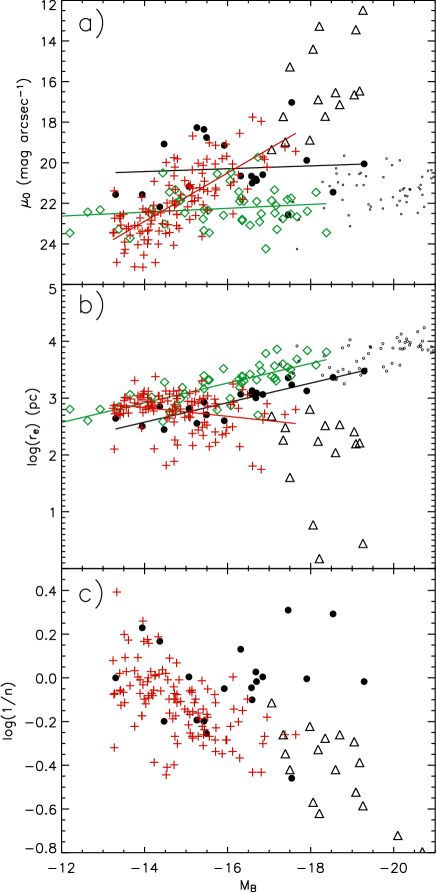
Despite the very different fitting techniques used for deriving the host structural parameters, the above result for BCGs and dIs are in good agreement with previous findings (e.g., P96b; Hunter & Elmegreen, 2006). Therefore, our results support the picture presented by P96b: if dIs evolve into dEs through repeatitive BCG phases, the hosts must undergo significant changes in their structure.
On the other hand, we show in §4.1.1 that, based on the global colours, two groups may be distinguished in our sample from those galaxies with colours close to the median. Comparing their mean colours with those of dIs and dEs, we found that the “reddest” hosts show mean global colours 0.860.26 and 1.290.10 compatible with the red hosts of Gil de Paz & Madore (2005) and very similar to typical colours for dEs. For instance, van Zee et al. (2004) derive 0.77 and 1.26 for a sample of dEs in Virgo. In contrast, the “blue group” of BCG hosts show mean global colours 0.300.08 and 0.660.09, very similar to the typical mean colours of dI galaxies, e.g. 0.420.05 for a large sample of isolated dIs (van Zee, 2000).
Although BCG hosts show clear differences in their average structural properties from those of dIs and dEs, a more individualised inspection of their properties shows that in the wide range of parameter values, morphologies, and colours, this kind of analysis cannot exclude the possibility that some galaxies in the sample (and in the general BCG “zoo”) could be connected in an evolutionary sense with the dI or dE families. In particular, the reddest ones, which generally show smooth morphologies and central star formation (nE BCGs in the usual nomenclature), could be associated with some family of dE galaxies (see also Gil de Paz & Madore, 2005) sharing some of their properties. Nucleated dEs or dE with blue centres, recently found in an almost-complete sample in the Virgo cluster by Lisker et al. (2006), could probably be a good template for future studies linking dEs and BCG hosts with regular morphologies and red colours.
5.2 The Tully–Fisher relation
The intrinsic luminosity and the maximum rotational velocity are empirically related by the so-called Tully–Fisher relation (TFR, Tully & Fisher, 1977). This relation has been derived for bright spiral galaxies, for which it is assumed that the relation is linear in a logarithmic sense. However, the TFR had also been found to hold for several galaxy types, including low surface-brightness spiral galaxies (Zwaan et al., 1995), dwarf late-type galaxies, i.e. Im-BCD galaxies (e.g., Stil & Israel, 1998; Pierini & Tuffs, 1999; Pierini, 1999; Vaduvescu et al., 2005), and early-type galaxies (De Rijcke et al., 2007). Moreover, for gas-rich, late-type galaxies, the TFR has been generalised to a relation between and the stellar mass, Ms (sTFR), as well as and the Hi gasstellar mass, Ms+g, usually called the “baryonic Tully-Fisher relation” (gsTFR) (McGaugh et al., 2000), which could serve for analysing possible environmental effects such as loss of gas mass in dEs (De Rijcke et al., 2007). We analysed the position of the BCG hosts in these scaling relations, comparing them to other galaxy types.

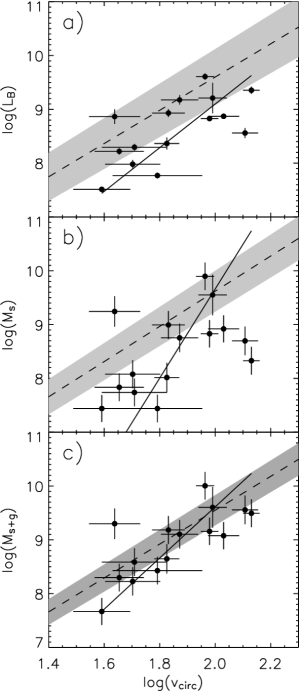
In Fig. 7 we present for the BCG hosts, the v, Mv, and Mv planes for which Hi data are available in the literature (see Table 1). We fitted a straight line to each dataset, taking the errors in luminosities and circular velocities into account. In the diagrams we also plotted the TFR, sTFR, and gsTFR fitted by De Rijcke et al. (2007) for a large sample of late-type galaxy discs from various literature sources (including McGaugh et al. (2000) and Geha et al. (2006)). We show its 1 upper and lower limits. The -band luminosities and the corresponding uncertainties for the host sample are those derived from our 2D fits (see Table The host in blue compact galaxies:). Circular velocities were obtained as , where is the neutral hydrogen line width, (see Table 1), after corrections for inclination and random motions (Pierini, 1999)
| (11) |
where the term corrects for inclination and was obtained following Staveley-Smith et al. (1992), by using the () values from the 2D fits. The correction due to velocity dispersion, , was obtained following Bottinelli et al. (1983), under the assumption of a purely Gaussian velocity distribution
| (12) |
where is the velocity dispersion along the axis. We adopted 5 km s-1 (Stil & Israel, 1998; Staveley-Smith et al., 1992). Uncertainties for circular velocities were estimated from those of (5-12 km s-1, on average).
Bell & de Jong (2001) fitted a set of spectrophotometric-disc evolutionary models to a set of observed properties of late-type galaxies. Their best models produce a tight correlation between the logarithm of the stellar mass-to-light ratio () of the disc and colour. We used the colours of the hosts to estimate the values straightforwardly from these correlations. From the several calibrations presented by Bell & de Jong (2001), we used the one obtained by assuming a mass-dependent formation epoch model with bursts and a scaled-down Salpeter IMF (see their Table 1). Since these models has negligible dependence with metallicity, the main source of uncertainty in the adopted correlations proceeds from the model assumptions, in particular the adopted IMF (Bell & de Jong, 2001). Thus, we computed the stellar masses () of the BCG underlying stellar population by using and the luminosity of the 2D models. Both, and are presented in Table 3 for the analysed sample. Moreover, the baryonic mass is calculated as the sum of the stellar mass and the Hi gas mass (from Table 3). Combining the different contributions, i.e. luminosity, colours and , we estimate a substantial uncertainty in and of up to a factor of 2.
Figure 7 shows the TFR for late-type spirals and our sample. The relation traced by the BCG hosts shows a slightly steeper slope than those traced by the late-type spiral discs. Our linear fit shows that low-luminosity hosts deviate from the extrapolation of the TFR for luminous spirals by being fainter than predicted for their circular velocities. We find that 8/15 hosts are clearly below the 1 level of the TFR. The observed deviation for late-type dwarf galaxies is not new in the literature. It has already been noticed even when comparing it with TFRs of different samples of more luminous systems (see e.g., Stil & Israel, 1998). Pierini (1999) points out that the distribution of dwarf galaxies with comparable rotational and random velocities in the v plane is consistent with the TFR for more luminous systems, whereas the rotationally supported dwarfs are underluminous with respect to the extremely late-type galaxies of the same rotational velocity.
After studying the rotation curves of a sample of 16 rotating dEs, van Zee et al. (2004) claim that some dEs and isolated dIs show remarkable similarities in their kinematic properties. In particular, both dwarf types coexist in the same position in the luminosity–line width plane (see their Fig. 6). In Fig. 8 we reproduce the same plot as presented by van Zee et al. (2004) but including the host data points and excluding the rotating dEs (share the same positions as dIs). Thus, Fig. 8 shows the TFR derived by Tully & Pierce (2000) with our data points and those for dIs from van Zee (2000). We see that BCG hosts and dIs (and therefore dEs) are indistinguishable in the luminosity–linewidth plane, showing, as in Fig. 7, an overall deviation from the faint end TFR for spiral discs.
In Fig. 7 we show the sTFR for late-type spirals and our sample data points in the M plane. While the sTFR reduces its scatter for late-type discs, the opposite behaviour is observed for BCG hosts (compared with Fig. 7). Our weighted linear fit to our sample data points, although more uncertain, exhibits a slope much steeper than in Fig. 7.
In contrast, in Fig. 7 our data points show a smaller scatter compared with Figs. 7 and 7. Furthermore, the slope of the gsTFR traced by the hosts is much steeper than the slope of the extrapolated gsTFR for late-type spirals. From this, we expect low-luminosity hosts to be less massive than predicted for their circular velocities. On average, 50% of the BCG hosts are undermassive by a factor of 0.4 dex, suggesting that they could have lost part of their baryons. Similar results have been obtained for a sample of dE by De Rijcke et al. (2007).
Warren et al. (2007) have recently found that dI galaxies with generally high M ratios follow the same trend in the baryonic TFR as defined by lower M giant galaxies, but are too underluminous for their rotation to follow the trend in an sTFR, suggesting that the baryonic mass of dwarf galaxies tends to be normal but that these have failed to produce sufficient numbers of stars. In Figs 9, and 9 we have plotted with filled circles the host residuals from the stellar and baryonic TFR versus the Hi mass to -band luminosity ratio. We also calculated the stellar mass and baryonic mass of the hosts, which should correspond to them if they follow the same TFR and sTFR as the late-type discs of De Rijcke et al. (2007). We have overplotted these masses with open circles in Figs. 9, 9. The stellar mass (Ms) deviation from the sTFR correlates with the distance-independent ratio M (Fig. 9), even if our BCGs should follow the TFR for late-type discs (open circles). In contrast, the Hi gas stellar mass (Mg+s) deviations from the gsTFR do not show such a correlation (Fig. 9). Even if BCGs should have enough stars (i.e. if they follow the normal sTFR), their baryonic mass should tend to those predicted by the gsTFR for late-type discs. Overall, this means that BCGs tend to a normal baryonic content and that those galaxies that fall below the gsTFR have not lost a significant amount of their gas by galactic winds or environmental effects. On the contrary, these deviations from the normal Tully–Fisher relations show that the overall host stellar mass is too low to reach the trend of spiral discs. In particular, galaxies with higher gas fractions, which are those with blue colours (see Fig. 5), are undermassive for their circular velocities. Our result agrees with those of Warren et al. (2007), and suggests that gas-rich BCGs tend to be inefficient at forming stars, such as dIs.

All the above shows that, on average, dynamical and structural connections between BCGs, dIs and dEs cannot be ruled out and suggests that the BCG “zoo” must be differentiated by the structure and colours of the underlying stellar population when exploring the possible evolutionary scenarios between the different “families” of dwarf galaxies.
6 Summary
We have analysed the underlying stellar host of a sample of 28 BCG galaxies by fitting their deep optical images. The host was modelled by a Sérsic law, masking the starburst contribution to the broad band images and by accurately subtracting the sky background in the consistent way inherited from Paper I. Only the best 2D Sérsic models were accepted for those galaxies that fulfilled the consistency checks. Based on this, we reduced our full sample to 20 galaxies that, according to their absolute -band magnitudes, may be considered as dwarf systems. Galaxies for which their Sérsic models were discarded (28%) have been reported in the literature as galaxies with clear signs of interactions/mergers or grouping.
Two-dimensional Sérsic models show low Sérsic indices, , for all galaxies but one. In addition, while effective radii show a positive correlation with luminosity, the extinction-corrected central surface brightness shows a large scatter, with an average value 20.281.44 mag arcsec-2. Sérsic models show a wide range of colours ( 1), while no correlations between colours and the fitted Sérsic parameters, i.e. , , and , were found. However, the sample could be split into different groups according to their colours. A “red” group showing colours redder ( 1.29 0.10) than the median for the whole sample ( 0.97) can be distinguished among the more luminous systems, whereas a “blue” group ( 0.660.07) consists, on average, of fainter objects.
The sizes and luminosities of both the host and the starburst components also show strong correlations. More extended and luminous hosts harbour more extended and luminous starbursts. In contrast, little or no correlation was found between and the host luminosity, indicating that the relative strength of the bursts does not depend on the galaxy mass. On the other hand, the Hi gas mass correlates with the host luminosity, showing that galaxies with larger gas reservoirs are expected to be optically more luminous and also more extended. The above relations suggest that star formation in this type of galaxies is probably self-regulated and that the star formation could be proceeding in a positive feedback regime. Moreover, galaxies with lower M show a tendency to have redder hosts.
We compared the host structural properties with those of other galaxy types. The Sérsic parameters of the BCG hosts and their global trends with luminosity are similar to those shown by dIs and some dEs. In particular, most compact and redder hosts are structurally similar to some dEs. Nevertheless, the overall sample of hosts is about twice as compact and shows a central surface brightness about two magnitudes brighter than dIs.
We explored the BCG hosts in the TFR context and compared their position to those of late-type discs, taking the host -band luminosities into account, as well as the stellar and Hi masses. The BCG hosts, isolated dIs, and rotating dEs turned out to be indistinguishable in the -band luminosity–line width plane. We found that about 50–60% of the galaxies are located below the TFR followed by late-type spiral discs. A larger scatter was obtained in the stellar mass–circular velocity plane, from which we have induced that host are clearly undermassive for their circular velocity if they follow the sTFR as late-type discs. The deviations from the sTFR correlate with the distance-independent Hi mass-to-luminosity ratio, showing that hosts with higher M have lower stellar masses than expected for the sTFR of more luminous objects. In the gsTFR, the baryonic mass is slightly lower than predicted for late-type discs for approximately half of the galaxies of a given circular velocity. Nevertheless, these differences disappear if we consider the stellar mass for the host predicted by the sTFR for spirals at a given vcirc, indicating that these deviations are a product of an insufficient amount of stellar mass rather than a result of mass loss by starburst-driven galactic winds. Furthermore, deviations from the gsTFR do not correlate with M, indicating that the overall baryonic mass in these systems tends to be normal, but it is deficient in stars, in a similar way to what has recently been observed for dI galaxies.
Acknowledgements.
The authors are sincerely grateful to the referee for the very detailed comments, suggestions, and time, all of which helped us to improve the manuscript. Thanks are given to N. Caon for his strong participation in the first stages of this project and to Jorge Sánchez Almeida and Rubén Sánchez-Janssen for their very helpful comments. We are also grateful to Terry Mahoney for revising the English. This paper is based on observations made at the Nordic Optical Telescope (NOT), at the Spanish Observatory del Roque de los Muchachos of the Instituto de Astrofísica de Canarias and on observations taken at the German/Spanish Calar Alto Observatory. This work was partially funded by the Spanish DGCyT, grants AYA2007-67965-C03-01 and AYA2007-67965-C03-02. This research was also partially funded by the Spanish MEC under the Consolider-Ingenio 2010 Programme grant CSD2006-00070: First Science with the GTC (http://www.iac.es/consolider-ingenio-gtc/) This research made use of the NASA/IPAC Extragalactic Database (NED) which is operated by the Jet Propulsion Laboratory, California Institute of Technology, under contract with the National Aeronautics and Space Administration.References
- Aguerri et al. (2003) Aguerri, J. A. L., Debattista, V. P., & Corsini, E. M. 2003, MNRAS, 338, 465
- Aguerri et al. (2004) Aguerri, J. A. L., Iglesias-Paramo, J., Vilchez, J. M., & Muñoz-Tuñón, C. 2004, AJ, 127, 1344
- Aguerri et al. (2005a) Aguerri, J. A. L., Iglesias-Páramo, J., Vílchez, J. M., Muñoz-Tuñón, C., & Sánchez-Janssen, R. 2005, AJ, 130, 475
- Aguerri et al. (2005b) Aguerri, J. A. L., Elias-Rosa, N., Corsini, E. M., & Muñoz-Tuñón, C. 2005, A&A, 434, 109
- Andredakis et al. (1995) Andredakis, Y. C., Peletier, R. F., & Balcells, M. 1995, MNRAS, 275, 874
- Amorín et al. (2007) Amorín, R. O., Muñoz-Tuñón, C., Aguerri, J. A. L., Cairós, L. M., & Caon, N. 2007, A&A, 467, 541
- Athanassoula et al. (1990) Athanassoula, E., Morin, S., Wozniak, H., Puy, D., Pierce, M. J., Lombard, J., & Bosma, A. 1990, MNRAS, 245, 130
- Bagget et al. (1998) Baggett, W. E., Baggett, S. M., & Anderson, K. S. J. 1998, AJ, 116, 1626
- Baldwin et al. (1982) Baldwin, J. A., Spinrad, H., & Terlevich, R. 1982, MNRAS, 198, 535
- Bell & de Jong (2001) Bell, E. F., & de Jong, R. S. 2001, ApJ, 550, 212
- Bergvall et al. (1999) Bergvall, N., Rönnback, J., Masegosa, J., Östlin, G. 1999, A&A, 341, 697
- Bergvall & Östlin (2002) Bergvall, N. & Östlin, G. 2002, A&A, 390, 891
- Binggeli & Jerjen (1998) Binggeli, B., & Jerjen, H. 1998, A&A, 333, 17
- Bottinelli et al. (1983) Bottinelli, L., Gouguenheim, L., Paturel, G., & de Vaucouleurs, G. 1983, A&A, 118, 4
- Brinks & Klein (1988) Brinks, E., & Klein, U. 1988, MNRAS, 231, 63P
- Burstein & Heiles (1984) Burstein, D. & Heiles, C. 1984, ApJS, 54, 33
- Cairós (2000) Cairós, L. M. 2000, PhD Thesis, University of La Laguna: “Formation and Evolution of Blue Compact Dwarf Galaxies”
- Cairós et al. (2001b) Cairós, L. M., Caon, N., Vílchez, J. M., González-Pérez, J. N., & Muñoz-Tuñón, C. 2001, ApJS, 136, 393 (C01b)
- Cairós et al. (2001a) Cairós, L. M., Vílchez, J. M., González Pérez, J. N., Iglesias-Páramo, J., & Caon, N. 2001, ApJS, 133, 321 (C01a)
- Cairós et al. (2002) Cairós, L. M., Caon, N., García-Lorenzo, B., Vílchez, J. M., & Muñoz-Tuñón, C. 2002, ApJ, 577, 164
- Cairós et al. (2003) Cairós, L. M., Caon, N., Papaderos, P., Noeske, K., Vílchez, J. M., García-Lorenzo, B., & Muñoz-Tuñón, C. 2003, ApJ, 593, 312
- Cairós et al. (2007) Cairós, L. M., Caon, N., García-Lorenzo, B., Monreal-Ibero, A., Amorín, R., Weilbacher, P., & Papaderos, P. 2007, ApJ, 669, 251
- Campos-Aguilar et al. (1993) Campos-Aguilar, A., Moles, M., & Masegosa, J. 1993, AJ, 106, 1784
- Caon et al. (1993) Caon, N., Capaccioli, M., & D’Onofrio, M. 1993, MNRAS, 265, 1013
- Caon et al. (1994) Caon, N., Capaccioli, M., D’Onofrio, M., & Longo, G. 1994, A&A, 286, L39
- Caon et al. (2005) Caon, N., Cairós, L. M., Aguerri, J. A. L., & Muñoz-Tuñón, C. 2005, ApJS, 157, 218
- Cellone et al. (1994) Cellone, S. A., Forte, J. C., & Geisler, D. 1994, ApJS, 93, 397
- Davies & Phillips (1988) Davies, J. I. & Phillipps, S. 1988, MNRAS, 233, 553
- Deeg et al. (1997) Deeg, H.-J., Duric, N., & Brinks, E. 1997, A&A, 323, 323
- de Jong & van der Kruit (1994) de Jong, R. S., & van der Kruit, P. C. 1994, A&AS, 106, 451
- De Rijcke et al. (2007) De Rijcke, S., Zeilinger, W. W., Hau, G. K. T., Prugniel, P., & Dejonghe, H. 2007, ApJ, 659, 1172
- D’Onofrio et al. (1994) D’Onofrio, M., Capaccioli, M., & Caon, N. 1994, MNRAS, 271, 523
- Doublier et al. (1999) Doublier, V., Caulet, A., & Comte, G. 1999, A&AS, 138, 213
- Doublier et al. (1997) Doublier, V., Comte, G., Petrosian, A., Surace, C., & Turatto, M. 1997, A&AS, 124, 405
- Doublier et al. (2001) Doublier, V., Caulet, A., & Comte, G. 2001, A&A, 367, 33
- Drinkwater & Hardy (1991) Drinkwater, M., & Hardy, E. 1991, AJ, 101, 94
- Fanelli et al. (1988) Fanelli, M. N., O’Connell, R. W., & Thuan, T. X. 1988, ApJ, 334, 665
- Geha et al. (2006) Geha, M., Blanton, M. R., Masjedi, M., & West, A. A. 2006, ApJ, 653, 240
- Gil de Paz et al. (2003) Gil de Paz, A., Madore, B. F., & Pevunova, O. 2003, ApJS, 147, 29
- Gil de Paz & Madore (2005) Gil de Paz, A., & Madore, B. F. 2005, ApJS, 156, 345
- Graham et al. (1996) Graham, A., Lauer, T. R., Colless, M., & Postman, M. 1996, ApJ, 465, 534
- Graham et al. (2001) Graham, A. W., Erwin, P., Caon, N., & Trujillo, I. 2001, ApJ, 563, L11
- Graham (2003) Graham, A. W. 2003, AJ, 125, 3398
- Graham & Guzmán (2003) Graham, A. W., & Guzmán, R. 2003, AJ, 125, 2936
- Gutiérrez et al. (2004) Gutiérrez, C. M., Trujillo, I., Aguerri, J. A. L., Graham, A. W., & Caon, N. 2004, ApJ, 602, 664
- Hickson (1982) Hickson, P. 1982, ApJ, 255, 382
- Hunter & Elmegreen (2006) Hunter, D. A., & Elmegreen, B. G. 2006, ApJS, 162, 49
- Iglesias-Paramo & Vilchez (1997b) Iglesias-Paramo, J., & Vilchez, J. M. 1997, ApJ, 479, 190
- Israel (2005) Israel, F. P. 2005, A&A, 438, 855
- James (1994) James, P. A. 1994, MNRAS, 269, 176
- Joy & Lester (1988) Joy, M., & Lester, D. F. 1988, ApJ, 331, 145
- Kormendy et al. (2009) Kormendy, J., Fisher, D. B., Cornell, M. E., & Bender, R. 2008, ApJS, in press, arXiv:0810.1681
- Kunth et al. (1988) Kunth, D., Maurogordato, S., & Vigroux, L. 1988, A&A, 204, 10
- Kunth & Östlin (2000) Kunth, D., Östlin, G. 2000, A&A Rev., 10, 1
- Lisker et al. (2006) Lisker, T., Glatt, K., Westera, P., & Grebel, E. K. 2006, AJ, 132, 2432
- Loose & Thuan (1986a) Loose, H.-H., & Thuan, T. X. 1986 a, ApJ, 309, 59
- Loose & Thuan (1986b) Loose, H.-H., & Thuan, T. X. 1986 b, Star-forming Dwarf Galaxies and Related Objects, 73
- Marlowe et al. (1997) Marlowe, A. T., Meurer, G. R., Heckman, T. M., & Schommer, R. 1997, ApJS, 112, 285
- Marlowe et al. (1999) Marlowe, A. T., Meurer, G. R., & Heckman, T. M. 1999, ApJ, 522, 183
- Mas-Hesse & Kunth (1999) Mas-Hesse, J. M. & Kunth, D. 1999, A&A, 349, 765
- Mazzarella et al. (1991) Mazzarella, J. M., Bothun, G. D., & Boroson, T. A. 1991, AJ, 101, 2034
- Mazzarella & Boroson (1993) Mazzarella, J. M., & Boroson, T. A. 1993, ApJS, 85, 27
- McGaugh et al. (2000) McGaugh, S. S., Schombert, J. M., Bothun
- Méndez-Abreu et al. (2008) Méndez-Abreu, J., Aguerri, J. A. L., Corsini, E. M., & Simonneau, E. 2008, A&A, 478, 353
- Méndez et al. (1999) Méndez, D. I., Cairós, L. M., Esteban, C., & Vílchez, J. M. 1999, AJ, 117, 1688
- Meurer et al. (1992) Meurer, G. R., Freeman, K. C., Dopita, M. A., & Cacciari, C. 1992, AJ, 103, 60
- Noeske et al. (2003) Noeske, K. G., Papaderos, P., Cairós, L. M., & Fricke, K. J. 2003, A&A, 410, 481
- Noeske et al. (2005) Noeske, K. G., Papaderos, P., Cairós, L. M., & Fricke, K. J. 2005, A&A, 429, 115, G. D., & de Blok, W. J. G. 2000, ApJ, 533, L99
- Papaderos et al. (1996a) Papaderos, P., Loose, H.-H., Thuan, T. X., & Fricke, K. J. 1996, A&AS, 120, 207 (P96a)
- Papaderos et al. (1996b) Papaderos, P., Loose, H.-H., Fricke, K. J., & Thuan, T. X. 1996, A&A, 314, 59 (P96b)
- Papaderos et al. (2002) Papaderos, P., Izotov, Y. I., Thuan, T. X., Noeske, K. G., Fricke, K. J., Guseva, N. G., & Green, R. F. 2002, A&A, 393, 461
- Peng et al. (2002) Peng, C. Y., Ho, L. C., Impey, C. D., & Rix, H.-W. 2002, AJ, 124, 266 (P02)
- Pierini & Tuffs (1999) Pierini, D., & Tuffs, R. J. 1999, A&A, 343, 751
- Pierini (1999) Pierini, D. 1999, A&A, 352, 49
- Prieto et al. (2001) Prieto, M., Aguerri, J. A. L., Varela, A. M., & Muñoz-Tuñón, C. 2001, A&A, 367, 405
- Press et al. (1992) Press, W. H., Teukolsky, S. A., Vetterling, W. T., & Flannery, B. P. 1992, Cambridge: University Press, —c1992, 2nd ed.,
- Pustil’nik et al. (1995) Pustil’nik, S., Ugryumov, A. V., Lipovetsky, V. A., Thuan, T. X., & Guseva, N. 1995, ApJ, 443, 499
- Rubin et al. (1990) Rubin, V. C., Hunter, D. A., & Ford, W. K. J. 1990, ApJ, 365, 86
- Sage et al. (1992) Sage, L. J., Salzer, J. J., Loose, H.-H., & Henkel, C. 1992, A&A, 265, 19
- Sargent & Searle (1970) Sargent, W. L. W. & Searle, L. 1970, ApJ, 162, L155
- Schlegel, Finkbeiner, & Davis (1998) Schlegel, D. J., Finkbeiner, D. P., & Davis, M. 1998, ApJ, 500, 525
- Schneider & Salpeter (1992) Schneider, S. E., & Salpeter, E. E. 1992, ApJ, 385, 32
- Sersic (1968) Sersic, J. L. 1968, Cordoba, Argentina: Observatorio Astronomico, Univ. Nac. Cordoba
- Silk et al. (1987) Silk, J., Wyse, R. F. G., & Shields, G. A. 1987, ApJ, 322, L59
- Simard (1998) Simard, L. 1998, Astronomical Data Analysis Software and Systems VII, 145, 108
- Smith et al. (1996) Smith, D. A., Herter, T., Haynes, M. P., Beichman, C. A., & Gautier, T. N., III 1996, ApJS, 104, 217
- Springob et al. (2005) Springob, C. M., Haynes, M. P., Giovanelli, R., & Kent, B. R. 2005, ApJS, 160, 149
- Staveley-Smith et al. (1992) Staveley-Smith, L., Davies, R. D., & Kinman, T. D. 1992, MNRAS, 258, 334
- Stil & Israel (1998) Stil, J. M., & Israel, F. P. 1998, ArXiv Astrophysics e-prints, arXiv:astro-ph/9810151
- Taylor et al. (1994) Taylor, C. L., Brinks, E., Pogge, R. W., & Skillman, E. D. 1994, AJ, 107, 971
- Telles (1995) Telles, J. E. 1995, Ph.D. Thesis, Univ. Cambridge
- Terlevich et al. (1991) Terlevich, R., Melnick, J., Masegosa, J., Moles, M., & Copetti, M. V. F. 1991, A&AS, 91, 285
- Thuan & Martin (1981) Thuan, T. X., & Martin, G. E. 1981, ApJ, 247, 823
- Thuan (1985) Thuan, T. X. 1985, ApJ, 299, 881
- Tully & Fisher (1977) Tully, R. B., & Fisher, J. R. 1977, A&A, 54, 661
- Trujillo et al. (2001) Trujillo, I., Graham, A. W., & Caon, N. 2001, MNRAS, 326, 869
- Tully & Pierce (2000) Tully, R. B., & Pierce, M. J. 2000, ApJ, 533, 744
- Vaduvescu et al. (2005) Vaduvescu, O., McCall, M. L., Richer, M. G., & Fingerhut, R. L. 2005, AJ, 130, 1593
- Vaduvescu et al. (2006) Vaduvescu, O., Richer, M. G., & McCall, M. L. 2006, AJ, 131, 1318
- van Zee (2000) van Zee, L. 2000, AJ, 119, 2757
- van Zee (2001) van Zee, L. 2001, AJ, 121, 2003
- van Zee et al. (2001) van Zee, L., Salzer, J. J., & Skillman, E. D. 2001, AJ, 122, 121
- van Zee et al. (2004) van Zee, L., Barton, E. J., & Skillman, E. D. 2004, AJ, 128, 2797
- van Zee et al. (2004) van Zee, L., Skillman, E. D., & Haynes, M. P. 2004, AJ, 128, 121
- Vennik et al. (2000) Vennik, J., Hopp, U., & Popescu, C. C. 2000, A&AS, 142, 399
- Warren et al. (2007) Warren, B. E., Jerjen, H., & Koribalski, B. S. 2007, AJ, 134, 1849
- Zwaan et al. (1995) Zwaan, M. A., van der Hulst, J. M., de Blok, W. J. G., & McGaugh, S. S. 1995, MNRAS, 273, L35
- Zwicky (1965) Zwicky, F. 1965, ApJ, 142, 1293
[x]c c c c c c c c c c c c c c
Parameters for the underlying stellar host derived from the 2D Sérsic fit
Galaxy Filter mhost
(1) (2) (3) (4) (5) (6) (7) (8) (9) (10) (11) (12) (13) (14)
\endfirstheadcontinued.
Galaxy Filter mhost
(1) (2) (3) (4) (5) (6) (7) (8) (9) (10) (11) (12) (13) (14)
\endhead\endfoot
Cam0341-404580.90.73 1.191.590.740.201.170.0817.450.1216.3221.9020.6523.46 1
73.90.77 0.441.590.970.211.310.0817.080.1416.6923.2621.5123.26 1
83.50.840.461.590.990.271.530.2216.490.2117.2823.3221.5322.79 1
Haro 1 15.20.97 0.053.331.440.211.650.0413.080.2520.5119.9917.2221.73 2
80.00.99 0.184.371.390.201.690.2212.450.2221.1419.4116.7622.03 2
44.60.990.154.371.370.251.700.0412.700.2820.8919.6717.0522.26 2
83.40.970.044.641.350.251.810.2311.680.3521.9018.7616.1821.37 2
Haro 15 10.7 0.720.052.770.850.121.570.2914.310.2420.3219.4918.0120.92 2
16.8 0.81 0.003.541.140.321.780.2014.600.3420.0220.3318.2122.09 2
11.2 0.78 0.002.811.020.371.330.4513.770.4420.8618.7716.9220.78 2
Mrk 5 13.1 0.76 0.100.740.990.150.650.0815.660.2015.0722.9621.1823.22 1
13.2 0.75 0.070.741.050.140.640.0315.260.0815.4622.5620.6422.84 1
12.5 0.780.010.711.050.250.640.0214.980.0815.7422.3220.4122.54 1
Mrk 33 63.40.64 0.231.722.880.711.710.4014.200.1217.5422.9317.0322.94 1
64.10.61 0.312.001.880.601.740.5013.840.2317.9022.3318.6122.62 1
64.30.62 0.321.712.240.201.650.3712.950.1018.7921.4316.9321.52 1
Mrk 35 74.0 0.720.021.570.990.181.160.1214.120.1816.8522.3820.5923.03 1
77.3 0.71 0.031.471.010.271.120.1013.390.1517.5821.5719.7422.13 1
77.7 0.700.011.470.970.161.130.0813.090.1217.8721.2619.5121.80 1
Mrk 36 25.90.470.000.511.000.040.440.0416.790.1513.3023.3921.5723.66 1
24.80.480.120.521.070.130.440.0316.240.2513.8522.8520.9223.21 1
23.80.490.100.521.050.080.450.0315.870.1014.2222.5420.6222.85 1
Mrk 86 21.20.91 0.001.370.940.341.010.1912.870.2716.6822.4820.8023.12 1
23.70.92 0.011.361.000.321.030.1512.130.2017.4221.8320.0222.42 1
21.30.90 0.001.361.020.261.000.2711.590.3017.9621.2119.3621.87 1
Mrk 297 86.30.710.186.310.840.152.921.0014.270.3119.8021.3519.8823.55 2
85.90.730.175.680.650.293.821.0714.200.5419.8721.7820.7322.66 2
Mrk 314 14.8 0.770.461.511.010.171.340.1114.400.1117.9121.7119.8821.96 1
Mrk 324 3.75 0.820.150.511.120.230.400.0215.830.1315.9221.2119.1421.70 1
14.40.88 0.110.511.120.210.410.0515.110.2216.6420.6118.5421.06 1
17.50.88 0.030.511.110.260.440.0414.750.1817.0120.4118.3620.68 1
17.50.88 0.030.511.020.240.420.0414.380.2317.3819.8918.0220.27 1
Mrk 370 14.80.79 0.091.001.040.081.230.0513.480.1316.7023.1821.2822.85 1
18.40.81 0.090.921.000.101.220.0712.930.1017.2422.5320.7222.10 1
14.00.80 0.080.881.030.141.260.0712.460.1017.7122.0720.1921.52 1
Mrk 401 35.10.970.011.690.490.222.280.1014.450.1717.4623.2722.5622.95 1
62.51.000.121.800.500.172.110.1113.810.1818.1022.5021.7822.31 1
Mrk 527 65.70.68 0.231.681.040.302.990.3514.100.2019.2921.9620.0621.15 1
64.50.79 0.371.951.010.262.810.2813.450.2019.9421.3319.4920.77 1
62.80.81 0.313.221.220.322.730.3012.130.1921.2620.0517.7620.39 1
Mrk 600 45.00.53 0.520.441.560.160.360.0315.280.1515.2621.3018.2721.76 1
44.10.55 0.350.421.440.150.390.0414.980.1315.5521.2018.4321.38 1
44.10.53 0.480.421.550.120.400.0214.740.0915.7920.9817.9821.14 1
Mrk 1089 39.40.70 0.003.820.770.314.090.6314.640.5518.9722.8521.5422.75 2
44.20.68 0.003.820.670.283.850.5814.580.3019.0322.5821.4822.57 2
51.10.64 0.003.820.920.332.831.4213.730.6519.8721.1319.4921.77 2
Mrk 1090 6.71.000.111.660.840.171.110.1014.770.1518.8120.6119.1521.51 2
6.51.000.121.810.870.141.180.0814.690.1518.8920.6819.1521.65 2
10.71.000.121.660.900.171.170.1314.290.1619.2920.2618.6721.04 2
5.70.960.191.660.830.081.090.0813.800.1519.7819.5518.1120.50 2
PHL 293B 26.30.89 0.240.240.590.140.320.0517.710.2413.9422.4921.5722.17 1
26.60.91 0.060.400.530.170.350.0417.130.2814.5222.0721.2822.37 1
25.50.92 0.070.300.580.150.390.0516.990.1514.6622.2421.3421.94 1
Tol 0127-39753.80.69 0.231.351.110.191.190.2317.350.1916.5722.7120.6622.97 1
50.50.67 0.081.400.940.151.370.2016.030.2017.9021.5819.9021.63 1
50.80.66 0.081.551.020.241.400.0615.920.2118.0121.5619.7021.75 1
UM 417 19.20.500.220.390.680.120.710.1018.360.1614.3723.2922.1822.62 1
17.50.520.340.390.490.160.700.0918.140.1914.5822.9022.2022.41 1
UM 462 9.80.77 0.000.921.800.340.510.0815.260.2815.4922.3118.7623.70 1
9.00.76 0.000.801.500.300.500.0515.070.2615.6821.9819.0923.04 1
9.30.70 0.000.791.850.360.670.1114.520.1316.2322.0918.4322.43 1
I Zw 123 51.10.920.260.431.580.200.280.0416.020.2014.4722.1519.0823.14 1
52.90.890.200.432.200.170.250.0215.410.1415.0721.4317.0122.69 1
II Zw 33 70.20.880.682.051.020.381.400.2813.230.4219.5822.4620.6021.14 2
22.41.000.651.900.900.401.430.2412.220.4620.5820.5218.9320.01 2
23.51.00 1.691.900.800.311.650.3111.680.5121.1319.6418.2619.40 2
II Zw 40 41.60.70 0.000.920.920.210.910.1612.570.1517.3621.2819.6421.30 2
44.50.61 0.000.921.290.301.050.1512.410.1617.5221.4419.0021.20 2
55.10.72 0.000.701.150.141.250.2111.850.1718.0821.3719.2420.38 2
II Zw 70 56.2 0.300.711.081.580.280.850.1415.980.2615.4321.4318.3622.91 1
56.4 0.270.691.101.070.200.860.1915.690.2815.7222.1320.1722.34 1
55.8 0.290.581.021.000.180.910.0615.280.2316.1322.0020.2021.83 1
II Zw 71 40.1 1.000.841.451.260.111.350.0614.830.2316.5923.3721.0023.58 1
39.0 1.000.791.451.310.151.270.0714.870.2017.1623.4720.9823.03 1
39.1 0.900.781.451.340.161.150.0814.310.2217.5722.6620.1122.52 1
III Zw 102 40.00.93 0.002.450.510.152.320.1613.240.1818.5422.1921.4522.28 1
40.50.95 0.002.820.500.132.410.1112.480.1519.3121.5320.8121.80 1
50.50.930.032.450.560.192.250.1512.030.1519.7520.9520.0921.10 1
III Zw 107 4.70.64 0.433.971.630.652.180.7615.260.2219.2021.5018.3222.93 2
3.20.54 0.943.971.650.532.370.6114.680.1819.7820.9317.7122.12 2
5.80.52 1.293.971.670.652.410.6414.880.2119.5821.1317.8722.27 2
-
Notes. Columns: (3) position angle; (4) minor-to-major axis ratio (); (5) boxy/discy shape parameter; (6) transition radius, in kiloparsecs; (7) Sérsic shape parameter; (8) effective radius, in kiloparsecs; (9) total apparent magnitude of the host component; (10) absolute magnitude of the host component; (11) effective surface brightness of the host component, in mag arcsec2; (12) central surface brightness of the host component, in mag arcsec-2; (13) surface brightness at the transition radius, in mag arcsec-2; (14) quality index : 1=good fit, 2=poor fit. Columns (9) – (13) were corrected by Galactic extinction following Schlegel, Finkbeiner, & Davis (1998)