Spectral Analysis of the Accretion Flow in NGC 1052 with Suzaku
Abstract
We present an analysis of the , 2007 Suzaku spectrum of the LINER galaxy NGC 1052. The continuum is well-modeled by a power-law modified by Galactic and intrinsic absorption, and it exhibits a soft, thermal emission component below . Both a narrow core and a broader component of Fe K emission centered at are robustly detected. While the narrow line is consistent with an origin in material distant from the black hole, the broad line is best fit empirically by a model that describes fluorescent emission from the inner accretion disk around a rapidly rotating black hole. We find no evidence in this observation for Comptonized reflection of the hard X-ray source by the disk above , however, which casts doubt on the hypothesis that the broad iron line originates in the inner regions of a standard accretion disk. We explore other possible scenarios for producing this spectral feature and conclude that the high equivalent width () and full-width-half-maximum velocity of the broad iron line () necessitate an origin within of the hard X-ray source. Based on the confirmed presence of a strong radio jet in this galaxy nucleus, the broad iron line may be produced in dense plasma near the base of the jet, implying that emission mechanisms in the centralmost portions of active galactic nuclei are more complex than previously thought.
1 Introduction
Since their first identification as an interesting class at optical wavelengths (Heckman 1980), the nature of Low Ionization Nuclear Emission Regions (LINERs) has remained elusive. Many such regions are associated with active galactic nuclei (AGN), though their X-ray luminosities are highly sub-Eddington and significantly below those of their Seyfert galaxy counterparts. The reason for this modest nuclear energy output remains unknown: possibilities include heavy absorption of the nuclear emission, comparably inefficient radiation of the accretion flow, or some combination of both.
The notion of an advection-dominated accretion flow (ADAF) may apply in LINERs, wherein the ions lose thermal contact with the electrons and only a small fraction of the dissipated energy is radiated (Rees et al. 1982; Narayan & Yi 1994). Much controversy remains as to whether this picture is correct, however, and the debate has become more pointed since the report by Ho et al. (1997) that some of all galaxies are members of the LINER class.
X-ray spectroscopy can help in determining whether the accretion disk is in an ADAF state or not. A LINER galaxy harboring an AGN produces a characteristic hard X-ray continuum. If the accretion flow close to the black hole conforms to the conventional thin disk archetype (Shakura & Syunyaev 1973), the cool gas orbiting in the inner disk should intercept and reprocess a significant fraction of the continuum, also producing the Fe K line (among many fluorescent emission lines from other species as well). This spectral feature should have a broadened, skewed profile created by the relativistic properties of the spacetime close to the black hole, and a significant Comptonized reflection component should be seen in the continuum above as well. If, however, the accretion flow in this region takes the form of an ADAF, the ion temperature is so high that the iron ions should be totally stripped of electrons. Furthermore, the trapped energy will puff up the disk, reducing its density and optical depth. Both of these conditions render the reflected emission, including the emission of Fe K, virtually non-existent in this region. In this case, only contributions to the Fe K line from other locations (e.g., from a disk wind, the outer disk, broad line region or putative molecular torus) will manifest, and the line may likely have a much narrower profile as a result.
The LINER galaxy NGC 1052 is an interesting case in which to study the dynamics of the accretion flow. The AGN is housed by a nearby elliptical host galaxy with a redshift of (Knapp et al. 1978), implying a distance of using WMAP cosmology. The source has a well-studied LINER optical spectrum (e.g., Gabel et al. (2000)), and is also reasonably bright in the X-ray band for a LINER, with an average flux of . Using the relation of Tremaine et al. (2002) and the stellar velocity dispersion of Nelson & Whittle (1995), Woo & Urry (2002) derived a black hole mass of for NGC 1052, and a bolometric luminosity of using flux integration over its spectral energy distribution. Combining these results with the derived Eddington luminosity yields an estimated accretion efficiency for the black hole in NGC 1052 of , in Eddington units. This is consistent with general results from LINERs. The source is known to be heavily absorbed based on the presence of megamasers in its core (Braatz et al. 1994), which lie along the direction of a radio jet also present in the galaxy (Claussen et al. 1998). Recent VLBI studies have constrained the jet inclination angle to lie between to our line of sight (Kadler et al. 2004b), implying that the jet emission is de-beamed, and suggesting that the bulk of the X-ray emission is not produced by the jet.
The observed X-ray spectrum of NGC 1052 is quite flat (for the power-law component of the emission , depending on the data and models used) and appears to be dominated at lower energies by thermal and/or photoionized emission (Weaver et al. 1999; Guainazzi et al. 2000; Kadler et al. 2004a). The source of this soft emission is likely the interaction of the jet with the surrounding ISM (Kadler et al. 2004a), while the power-law component at harder energies is thought to originate from nuclear emission. Radio continuum and RXTE monitoring both show that the source varies strongly on time scales of weeks to months. The flux, in particular, varies between , and though there are large uncertainties in the RXTE data, the spectrum appears to switch from softer to harder states, corresponding to changes in overall source flux (Kadler et al. , in prep.).
A prominent Fe K line has been previously observed in the source by ASCA (Weaver et al. 1999), BeppoSAX (Guainazzi et al. 2000), XMM-Newton (Kadler et al. , in prep.), and Chandra (Kadler et al. 2004b; Ros et al. 2007). Of these observations, a broadened component to the Fe K line was seen with BeppoSAX and XMM-Newton. Given the low accretion rate of NGC 1052 — a scenario which has long been thought to produce ADAFs, e.g., Narayan & Yi (1994) — it is natural to speculate on the origin of the broad iron line. The spectral state of NGC 1052 is in many ways analogous to the low/hard state observed in X-ray binaries (XRBs). Contrary to the ADAF paradigm, Miller et al. (2006) reported that XMM-Newton observations of the relativistically broad Fe K line in the low/hard state of XRB GX 339–4 showed a standard thin disk remaining at or near to the innermost stable circular orbit (ISCO), at least in bright phases of the low/hard state. The authors therefore argued that potential links between the inner disk radius and the onset of a steady compact jet, and the paradigm of a radially recessed disk in the low/hard state, do not hold universally. Note, however, that Gierliński et al. (2008) cautioned against using only the shape of the Fe K line to determine the radius of the ISCO, suggesting that these results can be significantly underestimated unless irradiation from the energetically dominant hot plasma (along with other spectral effects) is taken into account. If the broad iron line in NGC 1052 does originate from the accretion disk, however, then this spectral feature, coupled with detailed VLBI observations of the inner jet (Kadler et al. 2004a, b), may offer a unique opportunity to study the connection between the accretion flow and jet production in AGN.
A link between accretion and jet activity in AGN has been noted in the radio galaxies 3C 120 (Kataoka et al. 2007; Marscher 2006; Marscher et al. 2002) and 3C 111 (Marscher 2006). While Marscher et al. have noted dips in the X-ray light curves of these sources correlated with ejections of superluminal knots in the radio jet, suggesting that a portion of the inner disk is disturbed during an ejection event, these results fall short of mapping out the physical structure of the disk at the time. However, Kataoka et al. observed a broad Fe K line in 3C 120 with Suzaku in both the high and low flux states of the source. This discovery demonstrates the viability of studying the accretion flow and the jet activity of radio-loud AGN simultaneously, and will hopefully pave the way for new insights into the fundamental link between these two processes.
Here we discuss the analysis of our 2007 Suzaku observation of NGC 1052, which offers the highest quality X-ray spectrum of this galaxy to date and gives us an unprecedented, simultaneous view of the energy range. NGC 1052 is one of a small handful of AGN sufficiently bright in both the X-ray and radio bands for tests of a jet/disk connection. Additionally, it is the only source for which we will have a full package of multi-epoch X-ray spectral data, X-ray and radio light curves, and VLBA imaging within a common time window and with an analysis by a single collaborative group. A forthcoming paper will provide full details of this ongoing campaign, placing our Suzaku results in the context of prior X-ray and ongoing radio analysis of this source (Kadler et al. , in prep.).
Our Suzaku observation of NGC 1052 and the data reduction will be detailed in Section 2. We discuss variability over the course of the observation in §3. Our approach to the spectral fitting of the time-averaged data and the results of this analysis for both the XIS and the HXD/PIN instruments are presented in §4. We examine the Fe K region at length in §4 as well. A comparison with results from previous epochs appear in §5, and we discuss our results in context in §6. Our conclusions comprise §7.
2 Observations and Data Reduction
We observed NGC 1052 for a total of from 16-18 July 2007 with Suzaku in the HXD nominal pointing position. Reduction of the Suzaku data followed the procedures outlined in §4.7 and §4.8 of the Suzaku ABC Guide, available online111http://heasarc/docs/suzaku/analysis/abc/node1.html. Calibration files used were the latest version as of the time of this writing (January 2009). This calibration was incorporated into the X-ray Imaging Spectrometer (XIS) data reduction using the xispi task on the unfiltered data. Once cleaned, the event files for the XIS 0, XIS 1 (XIS 2 became defunct as of Nov. 2006) and XIS 3 detectors were loaded into xselect for reprocessing. Images were extracted that enabled identification of source and background regions. As per the recommendations in the ABC Guide, we employed a circular source region in radius, and maximized our background region area while avoiding the calibration sources at the corners of each detector chip. After spatial filtering was applied, spectra and light curves were extracted for each of the operational three detectors. Response matrices and ancillary response files were generated using the xisresp task, and the spectra, backgrounds and responses for the front-illuminated chips (XIS 0 and XIS 3) were co-added to increase the signal-to-noise using addascaspec. The spectra, backgrounds and responses were then rebinned by a factor of eight (to channels) using the rbnpha and rbnrmf tasks to speed spectral fitting. Finally, the spectra, backgrounds and responses were grouped together using the grppha task. Only spectral channels with with a minimum of cts/bin were used for fitting in order to ensure the validity of the chi-squared statistic. This corresponded to an energy range of for the XIS 0+3 data ( total counts) and for the XIS 1 data ( total counts).
Suzaku did observe NGC 1052 with the silicon diode PIN instrument of the Hard X-ray Detector (HXD), but the GSO crystal scintillator instrument did not have enough counts to provide useful data. The PIN data were reduced using the “tuned” calibration files for the non-X-ray background (NXB) and the response files that had been generated for the period surrounding the observation. These files were downloaded from the Suzaku Guest Observer Facility (GOF) for use. We first needed to ensure that only the portion of the NXB coincident with our observation was used in processing, so we merged the good-time interval (GTI) of the NXB with that of our screened event file to yield a common GTI using mgtime. With xselect, we then filtered the data and background using this common GTI and extracted our spectra and light curves for the source and NXB. We corrected for dead time in the observation using the hxddtcor task, and increased the exposure time of the NXB data by a factor of ten to compensate for the inflated event rate, which had been similarly multiplied in an effort to suppress Poisson noise. As for the XIS data, only spectral channels with with a minimum of cts/bin were used for fitting, which limited our energy range to . After reduction and filtering, the PIN spectrum had total counts over this energy range.
The cosmic X-ray background (CXB) has not been taken into account in PIN observations, so to model it appropriately, we simulated the CXB spectrum in xspec (Arnaud 1996) using a power-law model of with a high energy cutoff and foldE (initial parameters are given in the ABC Guide). We then folded this model through the response file for the PIN flat field for an exposure time of to generate the simulated CXB data. This spectrum was then read back into xspec with the PIN response for our observation and the original model was refitted over to yield the actual parameters of the CXB during this time. In our case, the simulated CXB spectrum contributed a count rate of () to the total X-ray background from . In modeling the PIN data with xspec, we applied the best-fit CXB parameters as a constant with each fit. The CXB followed a power-law form with a high-energy cutoff: , , . The PIN instrument detected the source above the (NXB+CXB) background at a level in our observation.
3 Timing Analysis and Variability
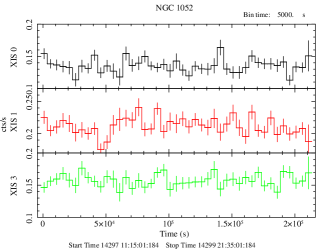
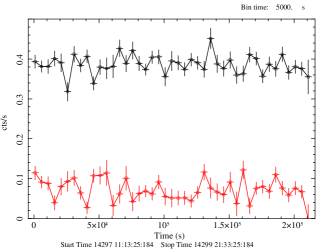
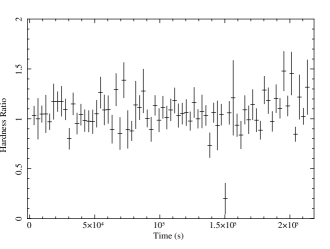
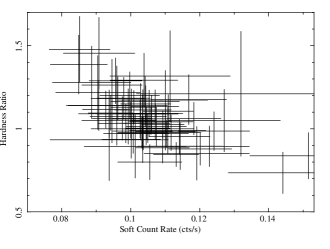
No significant changes were seen in the count rates of any of the XIS instruments or the PIN instrument over the course of the observation. Fig. 1 depicts the light curves from XIS 0, XIS 1 and XIS 3, as well as the combined XIS light curve vs. that of the PIN. While small variations in count rate (over timescales) were seen in both data sets, neither varied more than a factor of two from its baseline flux throughout the observation. This flux was roughly for the PIN and for the combined XIS data ( for XIS 0, for XIS 3 and for XIS 1). Fitting the combined XIS light curve to a constant model resulted in (where denotes the number of degrees of freedom of the model: detector channels - free model parameters), and an uncertainty of on the count rate. The PIN light curve fit to a constant was not as good a fit at , with the uncertainty in its count rate at . We also computed the hardness ratio vs. time for the combined XIS data, which is consistent with unity as one might expect for a source without significant variability over the course of the observation: , with . Examining the hardness ratio vs. soft band count rate, we note a significant anti-correlation between the two: NGC 1052 becomes harder as the source flux decreases. This variation is best fit with a linear model: , where denotes the hardness ratio, “flux” is the soft band count rate, is a multiplicative term and is a constant term. For the combined XIS data, and , with . We have plotted the hardness ratio vs. time and vs. soft count rate in Fig. 2.
This hardening of the source with decreased count rate demonstrates in a model-independent way that the spectral variability of of NGC 1052 in X-rays is consistent with the behavior observed in other Seyfert or Seyfert-like AGN (e.g., Papadakis et al. (2002); Markowitz & Edelson (2004)), and contrasts with the behavior observed in jet-dominated AGN (e.g., Zhang et al. (2006)). In other words, the anti-correlation of the hardness ratio with the source flux confirms that the bulk of the X-ray emission in NGC 1052 is not produced by the jet. We have plotted the hardness ratio vs. time and vs. soft count rate in Fig. 2.
The overall source flux did not vary significantly, averaging to (absorbed). This was split between the continuum and the Fe K lines, where the continuum flux averaged and that of the combined broad and narrow Fe K lines averaged . The average unabsorbed flux at the distance of NGC 1052, , works out to an intrinsic luminosity of using cosmological parameters consistent with the WMAP5 CDM-model results, within errors: , and . These results, and the models used to derive them, are presented in more detail in §4.
4 Spectral Analysis
We began our analysis of the 2007 Suzaku spectrum of NGC 1052 by examining the data from the operational XIS detectors. We use the good signal-to-noise data to extract information about the underlying continuum, any soft excess emission, the Fe K line complex and any intrinsic absorption in the system. NGC 1052 is thought to exhibit evidence for an AGN disk (the broad Fe K line) and jets (radio observations), as well as substantial, extended soft emission. As such, we expected the spectrum to be a conglomerate of all of these features since Suzaku lacks the spatial resolution necessary to physically separate them.
We also analyzed the HXD/PIN spectrum from in order to learn more about the nature of the continuum and to constrain the amount of reflection seen in the source. Because a broad iron line component has been observed in NGC 1052 in the past (Guainazzi et al. 2000), we expected that residual emission above a power-law should remain at high energies due to the presence of the so-called “Compton hump.” This feature has been noted in many AGN with broad iron lines (for a review, see Reynolds & Nowak (2003)), representing Compton down-scattering of the hard X-ray photons by the material in the disk. This Compton hump typically peaks at , and is thought to go hand-in-hand with the presence of a broad iron line, as both spectral features arise from the same physical process of reflection.
4.1 XIS Continuum
Before the iron line region could be considered, it was necessary to first accurately model the underlying continuum of NGC 1052. We began by ignoring the energy range where the iron line is thought to be important () and modeled the and energy bands with a simple power-law modified by Galactic photoabsorption (, as per Kalberla et al. (2005)). The result was a poor fit: . Large residuals remained at both high and low energies (see Fig. 3), and a very hard photon index for the power-law component was seen: . To account for differences in calibration between the XIS 0+3 and the XIS 1 detectors, we multiplied each data set by a constant cross-normalization factor. This constant was held at for XIS 0+3, and achieved a best-fit value of for the XIS 1 data.
An apparent soft excess was clearly visible below (see Fig. 3). To mitigate this residual feature we incorporated a thermal mekal component (Mewe et al. 1985). The fit improved dramatically to (, or an improvement in the global goodness-of-fit by chi-squared points for an additional degrees of freedom), with and a solar abundance for the mekal component. This component has been noted in previous X-ray analyses of NGC 1052 by Kadler et al. (2004b) with Chandra and Weaver et al. (1999) with ASCA (hereafter W99), and the temperature and flux obtained from our Suzaku fit are comparable to both values in both previous works. This thermal emission most likely originates in extended emission around the nucleus from the interaction of the jets with the ISM (Kadler et al. 2004b). Residuals still remained at low energies, however, so we added in a second mekal component (with an abundance equal to that of the first) to try to account for these features. Although marginal improvement in the overall goodness-of-fit was seen (), the addition of this second thermal component rendered the parameters of both mekal components unconstrained in an error analysis. We therefore removed the second thermal component. Though modest residuals remained at select energies, no statistically significant improvement in fit was achieved with the addition of discrete Gaussian components, as one might expect in a photoionized plasma, or with allowing the abundance of the mekal component(s) to vary. Alternatively, we also tried to account for this excess soft emission with a second power-law, with and without further absorption. Both models exhibited significantly poorer fits than that of the single mekal component.
Because NGC 1052 is also classified as a Seyfert 2 galaxy, it is reasonable to assume that some intrinsic absorption exists in or around the nuclear region. Such absorption could play a significant role in the spectral curvature seen, so it must be properly accounted for in the continuum model. We employed a partial-covering absorber (zpcfabs) intrinsic to the source to model this component, applying it only to the power-law and other components of nuclear AGN emission and not to the extended mekal components. A statistically significant improvement in fit was seen: , with and a covering fraction of . This marked an improvement in fit of . With the inclusion of this intrinsic absorption, the power-law photon index increased to . This was a significant increase in photon index from the fit without intrinsic absorption.
Physically, this continuum model and its parameters were roughly comparable to those which were fit for the 1996 ASCA observation of the source (W99) and the 2000 BeppoSAX observation by Guainazzi et al. (2000) — hereafter G00 — although the photon index of the power-law is considerably harder and the intrinsic absorption less dense in this 2007 observation. A model with a dual neutral absorber modifying intrinsic plus scattered power-law components as in W99 and G00 did not improve the fit, statistically; moreover, the parameter values of the second power-law and absorber could not be constrained.
Even after modeling the neutral absorption in the system, some residual spectral curvature still remained around , indicating that some further component of absorption likely remained unmodeled. We applied the simple ionized absorber model absori (Zdziarski et al. 1995) to the nuclear emission and noted a marked visual improvement to the fit from , as well as a small improvement in the global goodness-of-fit to , an improvement of . This absorber was reasonably thick and moderately ionized, with a column density of and an ionization parameter of . With the addition of this component, the power-law photon index increased to . This value lies within reasonable, expected physical limits for the X-ray continuum of an AGN. Our base continuum model therefore included a power-law modified by intrinsic absorption from both a cold, patchy absorber and a moderately ionized absorber of smaller column density, along with extended thermal emission. All model components were affected by Galactic photoabsorption.
4.2 The Fe K Line
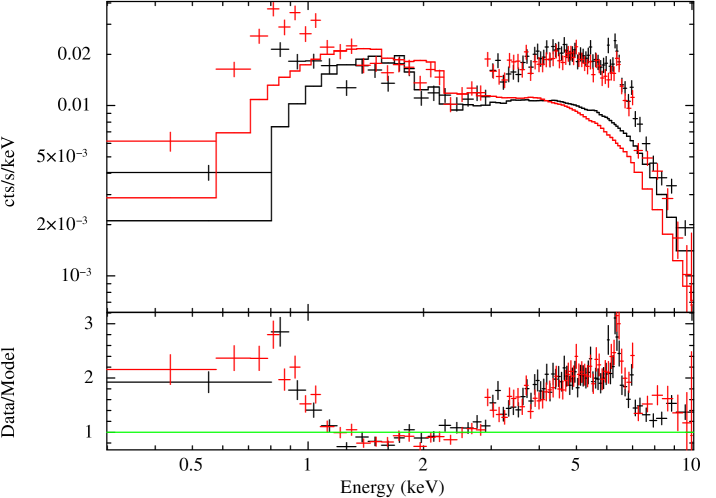
Having fit the continuum, we then took the energies from back into consideration and attempted to model the prominent residuals remaining, highlighted by a strong emission feature centered at in the rest frame that was assumed to be neutral Fe K (see Fig. 4, top). We began by holding the continuum parameters constant, except for normalizations and the power-law photon index, and refitting. The strong residual at remained, appearing to have a broadened red wing associated with it that extended down to . For this fit, .

To account for the strong emission feature of , we initially assumed some core contribution from neutral Fe K outside of the inner accretion disk in distant material. This would produce a relatively narrow emission line, being outside the region where relativistic broadening becomes important. Inserting such a line (, intentionally less than the resolution of the XIS in order to make the line truly narrow) into the model yielded a vast improvement in fit to for over the case with no line present. The energy of the line was constrained in the fit to , indicative of neutral iron, and the feature had an equivalent width . These parameter ranges are quoted at confidence for one interesting parameter; this confidence interval applies to all parameter ranges quoted in this Section. The broad residuals centered on still remained, however (see Fig. 4, middle).
We attempted to model these broad residuals three separate ways: with a broad Gaussian, with a diskline component representing emission from the inner disk around a Schwarzschild black hole (Fabian et al. 1989), and with a laor component representing emission from the inner disk around a maximally-spinning Kerr black hole (Laor 1991). Each line was centered at in the rest frame, corresponding to neutral Fe K. The Gaussian component improved the fit by to , and was quite broad: . Its equivalent width of was slightly smaller than that of previous observations, e.g., W99 and G00, in which . Relaxing the energy constraint of the line resulted in , with and , though significant residuals still remained on the red wing of the line. We then turned to diskline and laor in the hope of modeling the underlying broad feature, recognizing that these models assume that the broad emission originates in the inner accretion disk, which may not be the case if NGC 1052 harbors an ADAF.
The diskline model yielded , which is not significantly different from the Gaussian fit (), statistically, though it did account for more of the residuals below . VLBI observations of the radio jet on sub-parsec scales have constrained the inclination angle of the accretion disk to be between relative to our line of sight (Kadler et al. 2004b), so we applied these constraints to the model. Our best fit yielded an accretion disk emissivity index of (where the disk emissivity ) and an inner disk radius of (where ), but the inclination angle could not be further constrained. We held the outer radius constant at , since it was unable to be constrained and our emissivity index dictated that this radius safely encompasses all of the relevant emission from the disk. Fixing the inclination angle to an average value of and the emissivity index of the disk to a “typical” Seyfert AGN value of yielded no significant improvement in fit or change in the other model parameter values, and only resulted in a constraint on the inner radius of disk emission of .
The laor model provided the best statistical fit at , an improvement of over the diskline model and over the broad Gaussian line model. The laor model also appeared to be most effective at reducing the residuals between (see Fig. 4, bottom). Keeping the same disk inclination constraints mentioned above for the diskline model, we again could not further constrain this parameter, but we noted that the emissivity index of the disk was fairly centrally concentrated at , while the inner radius of emission is only mildly constrained within . The equivalent width of the broad iron line here was found to lie within . Interestingly, when we relaxed the constraint on the inclination angle of the disk we obtained a best-fit value of ; this is roughly a deviation from the radio constraints. Fixing the inclination angle and emissivity index as above for the diskline case worsened the global goodness-of-fit by chi-squared points for fewer degrees of freedom () and no significant improvement on the constraint for the inner radius of disk emission: .
The laor fit was a slight improvement over both the Gaussian and diskline models, though it should be noted that the uncertainty of the parameter effectively renders it impossible to meaningfully distinguish between the diskline and laor models based on the Fe K profile alone. If the laor model fit could better constrain the inner disk radius to (indicating that an optically-thick disk extends down to small radii), it would suggest that the black hole at the center of NGC 1052 is rapidly rotating, as many theories expect for a source that powers relativistic jets (e.g., Blandford & Znajek (1977); Meier et al. (2001); Hawley & Krolik (2006)). We cannot make this statement unequivocally based on our data, however. The data fit with this laor model are shown in Fig. 5. The final best-fit model parameters and their errors, incorporating the HXD/PIN data as well, are presented in the following Section within Table 1 as Model 1.
Absorption has often been suggested as an alternative to broad iron emission when attempting to model enhanced spectral curvature in the range (e.g., Kinkhabwala (2003)). To address this possibility, we compared our best laor fit above to a model in which we removed the broad iron line and replaced it with a second absorbed power-law component. The resulting fit yielded , as opposed to the achieved with the final laor model (), and left significant residuals around and below. Moreover, the parameter values for both the partial-covering absorber and the power-law components are not constrained in the fit. The models employing broad emission lines unquestionably provide better statistical and visual fits to the data.
4.3 Addition of the HXD/PIN Data
Adding the HXD/PIN data on to the combined XIS 0+3 and XIS 1 spectra, we noticed that the signal-to-noise ratio deteriorated significantly above and below . As such, we restricted our energy range for this detector to , applying a constant cross-normalization factor as we did with the XIS 1 data set. In this case, we used a parameter value of in keeping with the value expected for the HXD nominal pointing position.
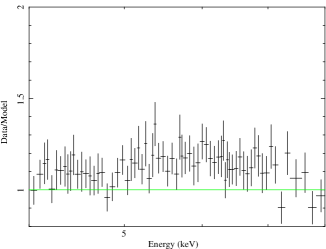
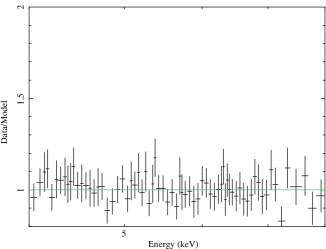
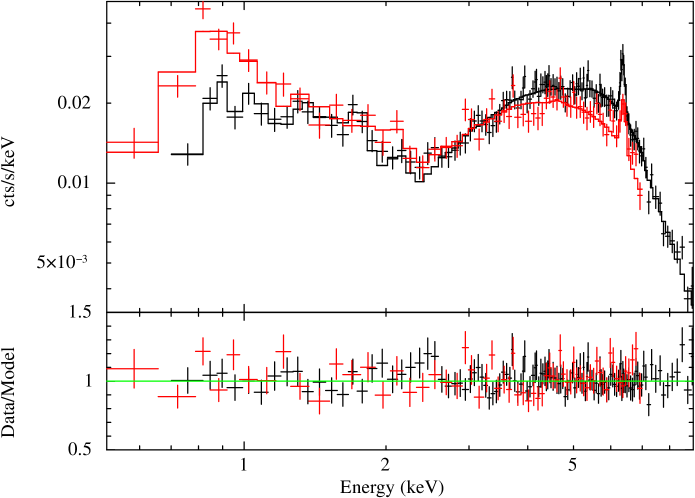
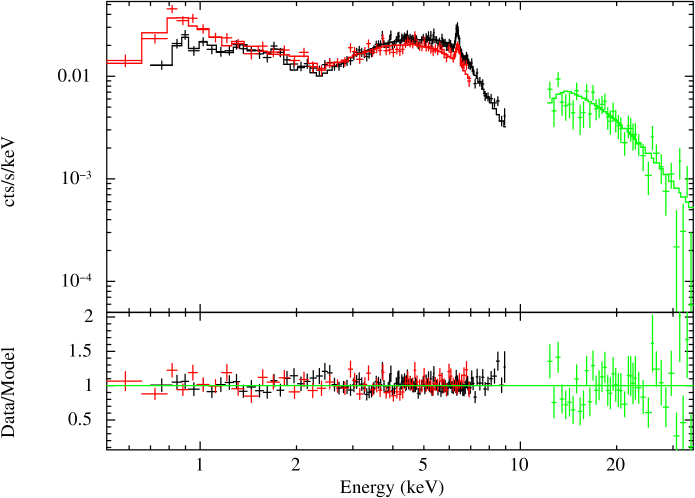
We considered the combined data refitted with Model 1 (photoabsorbed power-law, a partly-ionized absorber and a partial-covering neutral absorber, soft thermal emission, narrow and broad Fe K components), including no reflection component above . Fig. 6 shows the data, model and residuals from this fit, which yields . The inclusion of the high-energy data left the parameters effectively unchanged from their values in the fit without the PIN data. If a significant flux contribution from reflection is present, as one might assume if the broad iron line has an origin in a relativistic accretion disk, we would expect to see some excess in the emission over relative to Model 1. No such feature was detected, however.
Table 1 shows the full fit with confidence errors.
4.4 Alternative Continuum Models
Though no evidence for Comptonized reflection is apparent to the eye above , it is nonetheless important to try to place upper limits on its possible contribution to the overall spectrum. With this in mind, we utilized two popular, well-regarded models of reflection from an accretion disk around a black hole in an attempt to quantify the amount of reflection that might be present in the spectrum of NGC 1052.
The pexrav (or pexriv) model of Magdziarz & Zdziarski (1995) is one of the most widely used public models for AGN emission which incorporates reflected continuum from a neutral (or partly ionized) accretion disk. While it represents a more physical model than the simple power-law alone, it does not include line emission from the disk (e.g., Fe K) and it is difficult, in practice, to constrain the three most important parameters simultaneously: photon index, reflection fraction and disk inclination angle.
Adding a pexrav component to our power-law continuum (and keeping the inclination angle of the disk constant at the laor value, the power-law cutoff at , and the abundances fixed at their solar values), we found , only a very marginal change in fit from that of Model 1 over the energy range (). The photon index fit between while the reflection fraction was constrained to be quite small: . As we expect, based on the residuals from fitting Model 1, reflection is not a significant contributor to the overall observed spectrum. Though a pexriv component was also fit, the ionization parameter was unable to be constrained, so we elected to assume a neutral disk. In this fit, the emissivity index of the laor line for Fe K had very similar constraints to those found in Model 1: . Also, to confidence, the inner radius of emission in the disk was constrained to , as we found in Model 1. The equivalent width of the broad Fe K line in this model also remained consistent with that found in Model 1, at . The pexrav model will hereafter be known as Model 2. Its final parameter values and their errors are also presented in Table 1.
The reflion model of Ross & Fabian (2005) is another widely available code used to describe the reflected spectrum of an accretion disk around a black hole. The advantage of this model over the pexrav model is that it is self-consistent: fluorescent emission lines from many ionized species are included in addition to the continuum, most notably those of the Fe K complex. The ionization parameter, incident power-law photon index and iron abundance are specified by the user. The disadvantage is that photon indices below are outside the allowed parameter range of the model, and there is not a parameter for the reflection fraction, as in pexrav. The user is therefore obliged to estimate it using, e.g.,
| (1) |
Here and denote the normalizations of the reflion and power-law components from our best-fit spectral model, is the best-fit ionization parameter characterizing the disk reflection (where denotes a neutral disk in the model), and and are the total fluxes contained in the reflion and power-law components for unity normalization over the full wavelength range ().
We began by removing the laor line from the Model 1 fit and adding in a reflion component, with the iron abundance held at the solar value and the photon index linked to that of the power-law. As expected, this fit mimicked that of the continuum plus a narrow Gaussian, leaving residuals on the low-energy end of the line. Statistically, . Allowing the iron abundance to fit freely yielded a small improvement in fit, with for , but doing so rendered the ionization parameter and normalization unconstrained. As such we elected to keep the iron abundance constant at the solar value.
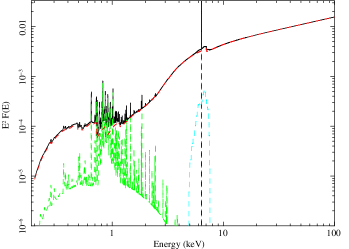
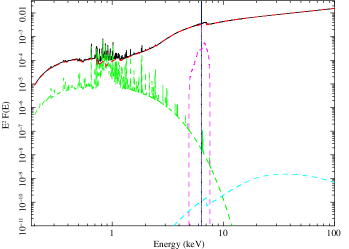
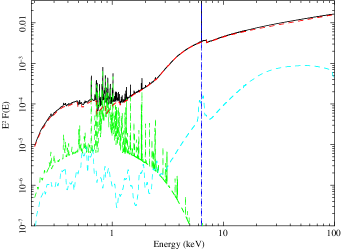
If NGC 1052 harbors a rapidly spinning black hole, as our best laor fit seems to indicate, we must take into account the relativistic effects on emission originating from the inner accretion disk. We incorporated this smearing of spectral features using the laor-based convolution model kdblur. Our best fit was , comparable to our best laor and pexrav fits ( and , respectively). However, we were unable to constrain the emissivity index of the accretion disk, though we did obtain constraints on the inner radius of emission that are consistent with those found in the laor model: . The estimated reflection fraction is quite low at , consistent with the results of the pexrav model fit and partly attributable to the moderately high ionization parameter () in the reflion model. The kdblur(reflion) model will hereafter be known as Model 3. For comparison, the model components for the Models 1-3 fits are plotted in Fig. 7, and their best-fit parameters and errors are listed in Table 1.
Models 2-3 constrain the amount of reflection from the disk to be , consistent with the lack of a discernible Compton hump above in the HXD/PIN data. Moreover, as we describe in detail later in §6, if the broad iron line component results from fluorescence in the disk caused by incident hard X-ray emission, then the equivalent width of the Fe K line should be directly related to the normalization of the reflection component in our model as compared to that of the power-law. Yet this is not the case in our data. Based on the low normalizations for reflection seen in both Model 2 and Model 3, we should expect a broad Fe K equivalent width of , much less than the observed in both Models 1-2. In other words, our broad iron line does not appear to have a correspondingly strong amount of continuum reflection associated with it. It is possible that this “missing” reflection is actually present to some greater degree in the data, but is perhaps drowned out by the power-law continuum. It is also possible that reflection is simply absent in this source. This scenario presents several intriguing possibilities for physical interpretations, which we discuss in §6.
| Component | Parameter Value | Model 1 | Model 2 | Model 3 |
|---|---|---|---|---|
| mekal | ||||
| absori | ||||
| zpcfabs | ||||
| zpo | ||||
| zgauss | ||||
| laor, kdblur | ||||
| — | ||||
| — | ||||
| — | ||||
| pexrav, reflion | — | |||
| — | ||||
| — | ||||
| — | ||||
| — | ||||
| Waveband (keV) | Model 1 Flux () | Model 2 Flux () | Model 3 Flux () |
|---|---|---|---|
5 Comparison with Previous Results
Here we consider our best 2007 Suzaku results (Model 1) against those obtained in the 1996 ASCA observation by W99 and the 2000 BeppoSAX observation by G00. We do not elect to discuss individually either the 1999 ROSAT results from Guainazzi & Antonelli (1999) nor the 2000 Chandra results from Kadler et al. (2004a) due to the inferior signal-to-noise of these observations.
Neither W99 nor G00 presented a light curve for their data, but both authors failed to detect any significant variability over the course of their observations. W99 fit a time-averaged flux of , corrected for a dual absorber in the best fit. This differs only slightly from the unabsorbed flux of we have obtained from our data in the present epoch. G00 use only one cold intrinsic absorber in their best fit, which yields an unabsorbed flux of , also consistent with our 2007 observation.
The neutral hydrogen absorbing column in our best fit is less dense than that of W99 or G00. We find evidence for one intrinsic neutral absorber of (with a partial-covering fraction of ). In their best-fitting model, W99 employ a two-zone intrinsic absorption model with and . The G00 best-fit model uses one intrinsic absorber of . Our model contains a component of partly-ionized absorption that W99 and G00 do not, however: the absori model representing this absorbing material has a column density of and an ionization parameter of . Even with this additional layer the W99 and G00 models contain higher absorbing columns than our 2007 model, however.
The heavy absorption in W99, in particular, resulted in a power-law photon index split between intrinsic and scattered components, where a power-law photon index of was assumed and was scattered, while of the intrinsic flux was absorbed by the larger column and by the smaller column. We attempted such a neutral dual-absorber fit (see §4.1-4.2) and found that the parameters of the second absorber could not be constrained, and that a single intrinsic neutral absorber and an ionized absorber along with Galactic photoabsorption modifying a simple, albeit fairly hard power-law () provided an excellent fit to the continuum.
W99 and G00 also found evidence for a thermal mekal component to explain the soft excess noted below , which was best modeled with and a flux of in W99. G00 modeled this component with a similar model of much higher temperature of , though these authors do not report its flux. This thermal component was also detected by Kadler et al. (2004a) with Chandra at , though over a flux range of and with limited signal-to-noise. We found a similar thermal component in the Suzaku data. Though the XIS detectors lose effective area rapidly below , extrapolating Model 1 down to yielded and over . Our results showed a slight increase in temperature and flux for the mekal component but were consistent with the 1996 results within error bars.
In the favored dual-absorber ASCA model of W99, a broad Fe K line component was not required in the fit and hence these authors found no definitive evidence for reflection from an optically-thick accretion disk in their data. They did require a narrow Fe K line, however: the centroid energy of this component was held constant at and had an equivalent width of . G00 did detect an Fe K line with some apparent broadening, though this could be accounted for in the BeppoSAX data with a mildly ionized Fe K line with centroid energy and an equivalent width of . In our Model 1 for the Suzaku data, we found that both broad and narrow components were necessary in order to eliminate the residuals between . Our narrow line, with a centroid energy of had an equivalent width of . The presence of a broad component to the Fe K line likely rendered this narrow feature significantly weaker than its 1996 counterpart.
Our broad Fe K line, held constant at a centroid energy of , was best fit with a laor emission feature originating from the accretion disk around a rapidly rotating black hole, though the inner radius of emission within the disk was only mildly constrained to , as discussed in §4.2. This feature was stronger than the narrow Fe K line: its equivalent width was . Replacing the laor line with a broad Gaussian, we found that , which translates to a lower-limit FWHM of and implies an origin for this feature very close to the black hole. Though the fit of the laor line itself is suggestive of a broad, fluorescent Fe K origin in the inner accretion disk, the lack of reflected continuum flux above argues against this interpretation, as we discuss below and in the following Section.
W99 considered a reflection-based hrefl model to fit the ASCA spectrum, but were unable to obtain meaningful constraints on the reflection parameters without making several assumptions. These included fixing the value of the power-law photon index of the central X-ray source to be and also fixing the inclination angle of the disk to . The latter was consistent with our own angle constraints based on the VLBI observations of NGC 1052, but our Suzaku observation indicated a somewhat harder photon index (see Table 1). For an assumed reflection fraction of and the observed ASCA spectrum, W99 found that only a small fraction of the direct emission from the X-ray source was visible, leading these authors to infer that a thick absorbing column in the nucleus () blocked the X-ray source from view, such that reflected emission dominated the spectrum. However, the equivalent width of the Fe K line, , was over an order of magnitude smaller than the same line seen in other heavily obscured AGN. To account for this line with a reflection model would require an implausibly small iron abundance of . This reflection model was therefore argued against by W99. Similarly, G00 also ruled out evidence for Compton reflection in the NGC 1052 BeppoSAX spectrum due to a statistically unacceptable fit for the pexriv model. These authors were only able to mildly constrain the reflection fraction to a hard upper limit of .
The 2007 Suzaku data concur with this assessment of a lack of reflection: though Model 2 produced a comparable global goodness-of-fit to Model 1, the reflection fraction was found to be quite small: . Attempting to model any reflection present with Model 3, we were unable to constrain the emissivity index of the accretion disk, though we did achieve similar constraints for the equivalent width of the narrow iron line and the photon index of the power-law component. Based on this spectral fitting, we conclude that in 2007, NGC 1052 does show evidence for a broadened iron line; this line is not particularly broad or strong, however, and is not accompanied by the expected Compton hump above . This may indicate that the line arises outside of the innermost portions of the disk and/or that reflection simply does not play a large role in creating the overall X-ray spectrum.
In order to make a more detailed comparison between the 1996 ASCA data and the 2007 Suzaku data for NGC 1052, we have examined the W99 spectrum in combination with our Model 1. Data from the SIS 0 and GIS 2 were used, as these were the instruments with the highest count rates and the closest on-axis telescope pointing during the ASCA observation. We show a plot of the ratio of the ASCA data to our Suzaku best-fit Model 1 in Fig. 8.
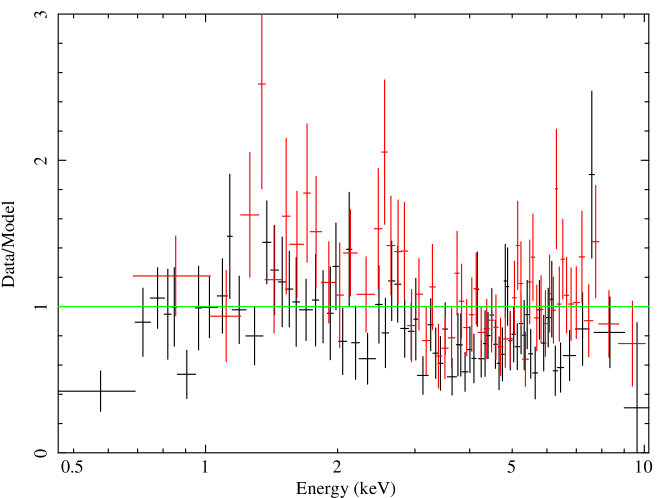
Changes between the two epochs are evident at energies below and above , likely indicating that the continuum and absorbing structures have undergone physical changes during the intervening years. Refitting the model, we found that as opposed to before refitting. Reduced chi-squared values less than unity often indicate that the model has more parameters than are necessary to adequately fit the data, and given the lower spectral resolution and throughput of the ASCA data, this is likely the case here. Nonetheless, we can use this refit to verify which model components have undergone significant changes between 1996 and 2007.
The thermal component had a temperature of , consistent with the results of W99 and consistent in its upper limit with Model 1. The normalizations of the thermal component were also consistent within error bars. The power-law photon index from Model 1 was , vs. from our refit of the ASCA data, also consistent within errors. W99 had maintained this component at a fixed value of for their best-fitting models, but our refitted value was consistent with the W99 fits for their models 2-4. Though W99 employed a power-law component split between intrinsic and scattered emission while we determined that only intrinsic emission was necessary for the Suzaku data, the total normalization of all the W99 power-law components was consistent with our intrinsic power-law normalization within errors. Our refitted ASCA value (assuming intrinsic emission only) was also consistent with the W99 intrinsic normalization within errors. Refitting the absorption parameters yielded an ionized absorbing column of and an ionization parameter of . While these values were not well-constrained, they were at least marginally consistent with those of Model 1. However, while the partial-covering absorber column was constrained to , consistent with Model 1, the covering fraction could not be constrained. These changes suggest that the absorbing structure differs physically in 2007 as compared with 1996.
The iron line complex, by contrast, showed little variation between the two epochs. Our refit to the ASCA data yielded a narrow Fe K component of normalization , consistent with our Suzaku Model 1 value and the W99 fit, and strongly indicating that this component, if variable, is only variable on long timescales and must therefore be emitted from material far from the black hole. W99 reported that no broad Fe K line component was robustly present in 1996, contrary to our findings in 2007. Our refit, including a laor component, does not adequately constrain the parameters of the broad line in 1996, confirming the null result of W99. This could mean either that the broad line component was truly absent in 1996, or perhaps that it was present at a lower normalization and effectively drowned out by the continuum emission. Given the rapid decrease in effective area above and the spectral resolution of ASCA, however, it is very likely that the broad iron line component simply could not have been detected by this observatory, thus rendering moot any comparison between a broad Fe K line in 1996 and 2007.
6 Discussion
We have performed detailed spectral fits to the XIS and HXD/PIN data from the , 2007 Suzaku observation of the LINER galaxy NGC 1052. Three different spectral models were employed: (1) an absorbed power-law continuum with contributions from a soft thermal component along with narrow and broad Fe K lines; (2) the same model, but with an added component of reflected continuum emission from a neutral accretion disk (pexrav); (3) the same base model, again, but with a more advanced, self-consistent reflection model which includes fluorescent emission lines from the disk and takes ionization into account (reflion; see Ross & Fabian (2005) for details). In Model 3 we applied relativistic smearing using the kdblur model. Because fluorescent lines are included in reflion, there is no need for an additional broad iron line component as in Model 1. We summarize our findings below:
-
•
The three models are quite similar in their statistical goodness-of-fit, though some of the disk reflection parameters in Models 2-3 prove especially difficult to constrain.
-
•
The continuum is well described by a component with a power-law spectrum of photon index , thermal emission with , a neutral intrinsic absorbing column of and a covering fraction of , and an ionized intrinsic absorber with and . These findings are relatively consistent with those of the 1996 ASCA observation of W99, though our photon index is harder and our absorbing column lower in density in 2007.
-
•
As in the ASCA data, a narrow Fe K line is present: .
-
•
Strong evidence exists for a broadened Fe K emission component (). Though the best statistical fit is achieved with a laor line profile, however, the rather broad constraint on the inner radius of renders it impossible to distinguish between a spinning and non-spinning black hole.
-
•
The PIN instrument did detect hard X-ray emission above from NGC 1052. This emission is well fit by the power-law component of the continuum and does not show any evidence for reflected emission via the Compton hump that is commonly associated with other AGN harboring broad iron lines, and expected based on the presence of the broad iron line if the two features arise from reflection onto a standard accretion disk. Neither of our reflection models found any statistical evidence for a strong reflection component.
-
•
Though VLBI observations of the jet in NGC 1052 have constrained the orientation angle of the disk to be between , we find that removing this constraint in our fitting yields a best-fit inclination angle of , though this does not significantly improve the global goodness-of-fit. Nonetheless, this result does mark a deviation from the radio results.
These findings motivate three main questions: (1) what is the physical origin of the broad iron line in our 2007 observation; (2) how is it that we detect a broad iron line yet no evidence for disk reflection above , and (3) why is the laor line inclination, when kept as a free parameter in the fit, not more consistent with the disk inclination constraints established in radio observations of the inner jet in NGC 1052?
As it turns out, the answers to these questions may be closely related. Relativistically broad iron lines are expected to be associated with pronounced Compton humps. Comptonized reflection originates via irradiation of the optically thick inner accretion disk by the hard X-ray source, perhaps in some sort of lamp-post geometry, e.g., the base of a jet (Miniutti et al. 2007). This same process will also produce fluorescent line emission from the disk, most notably the Fe K line, which will experience significant broadening and skewness by virtue of its origin from the spacetime proximal to the black hole (Reynolds & Nowak 2003). The absence of a Compton hump, however, casts doubt on the presence/contribution of reflection from the disk to the overall X-ray spectrum. From our pexrav model fit (Model 3), we can estimate the equivalent width of the iron line we should expect if both the Compton hump and the broad line originate from disk reflection. Using the ratio of the normalization of the power-law to the upper limit of the reflected component in our fit, we infer that the iron line equivalent width should be if the two features are indeed produced by the same physical process. This low value is highly inconsistent with the observed strength of the broad iron feature, however.
Relativistic disk smearing is not the only process by which this spectral line can be broadened. In the following paragraphs we consider a number of other physical scenarios, including: transition to an advection-dominated accretion flow (ADAF) in the inner disk, resonant scattering from the putative torus region, origin of the line in an outflow located in the broad line region (BLR), and Fe K produced by Cerenkov line-like radiation rather than fluorescence.
One explanation for the lack of an observed reflected continuum could be that the accretion disk transitions to a radiatively-inefficient state within some radius, e.g., Narayan & Yi (1994). In this ADAF picture, which has often been invoked as a potential explanation for low-luminosity sources (especially those with observed jet activity), the disk traps radiation rather than releasing it, puffing up to become optically thin and geometrically thick as its temperature and ionization state rises. Because of these properties, the gas in this region would not be expected to produce much, if any, reflection, either in the form of a Compton hump or discrete emission lines. If a contribution to the broad iron line did somehow arise from this region, we would expect it to be highly ionized, yet this is not seen in the data: our broad and narrow iron line components both have energies robustly less than , suggesting that they arise from species at or below Fe xviii. We therefore conclude that an ADAF, if present, is unlikely to be a significant contributor to the broadening of the Fe K feature.
The lack of a Compton hump at the expected strength and the mismatch between the unconstrained laor disk inclination and the VLBI value causes us to rule out a relativistic inner disk origin for the broad iron line. We also eliminate a possible origin in an ADAF due to ionization constraints and optical depth issues. Investigating other possible sources of iron emission in the central AGN leads us to consider the role of resonant scattering in the torus region, which is thought to contribute heavily to the flux of the narrow Fe K line. However, both the large equivalent width and the large FWHM velocity of the broad line component we observe (both substantially greater than the and typically associated with the narrow core, e.g., Yaqoob & Padmanabhan (2004)) render this explanation implausible.
An AGN outflow originating in the BLR is explored as a possible explanation for the similar spectrum of NGC 7213 (Bianchi et al. 2008). Here a broad iron line with no corresponding Compton hump is also observed, and these authors find that the equivalent width of the Fe K feature is consistent with predictions made by Yaqoob et al. (2001) for an origin in the BLR or perhaps a Compton-thin torus. Further, measurements of the velocity broadening of the optical H line concur with those measured from the broad Fe K line (), suggesting a similar origin for the emission. Using the same diagnostic, we estimate that we should expect a broad line if it originates in an outflow from this region; this underestimates our observed equivalent width by nearly a factor of ten using a simple Gaussian line to represent the broad feature, and by roughly a factor of two if the better-fitting (though, in this case, unphysical) laor line is used. Also, our estimated lower-limit FWHM velocity of the line () is more than an order of magnitude greater than the polarized optical H FWHM measurement of Barth et al. (1999) (). This is a strong indication that the broad Fe K line we observe originates closer to the black hole than the BLR. Moreover, variability of the broad iron line on years-long timescales has been noted (Kadler et al. 2004c; Ros et al. 2007); this type of variation would not be expected from the typical symmetric BLR, as changes in flux due to passing clouds in this region should theoretically average out over time.
Finally, we consider a more exotic possibility: perhaps the broad iron line is produced by Cerenkov line-like radiation in the centralmost regions of the AGN. You et al. (2003) put forward the intriguing notion that in dense regions where the refractive index of the material is large, relativistic electrons impinging upon this material can produce Cerenkov radiation in a narrow wavelength range very close to the intrinsic atomic wavelength of the material. The combination of absorption and emission causes the final emission feature to be redshifted and skewed, making it appear very like a relativistic line produced by fluorescence in the inner accretion disk. Because electrons are producing the emission rather than photons, no reflected continuum is expected. The cool, dense, iron-rich gas in the disk of NGC 1052 could provide the medium for this process, while relativistic electrons in the corona or near the base of the jet would make for an ideal bombardment population. Furthermore, this physical picture makes for a much more consistent match with our estimate of the distance of the broad line region of origin from the hard X-ray source: our lower-limit FWHM velocity for the broad Gaussian fit to the line yields , which corresponds to an upper-limit distance of . This is well inside the BLR.
Given our constraint on the distance of the broad iron line emitter from the hard X-ray source, iron fluorescence from the base of the jet itself is also a potential candidate for the emission mechanism. However, considering the orientation of the jets observed in NGC 1052 to our line of sight, it is unclear whether any fluorescent emission from the jet base could escape the system without being absorbed. Correlated radio flux measurements from the base of the jet and X-ray spectra of this source must be examined over several epochs, simultaneously whenever possible, in order to assess the likelihood of this scenario as well as that of the Cerenkov line-like radiation proposed by You et al. (2003). Only through a coordinated study of the jet and the accretion flow in NGC 1052 can we hope to understand the connection between these two vital physical processes in AGN.
7 Conclusions
Our 2007 Suzaku spectrum of the LINER galaxy NGC 1052 is consistent with X-ray spectra of this source from previous epochs, with a fairly flat power-law continuum that is heavily absorbed. Intrinsic neutral and ionized columns are detected, along with evidence of Galactic photoabsorption. A thermal component is also detected, likely due to the interaction of the jets with the surrounding ISM. Both narrow and broad iron lines are observed, though interestingly there is little to no reflection seen in the spectrum above : two different models used to characterize this feature both require .
We are thus faced with a complex scenario for NGC 1052 in which the broad iron line is not consistent with the lack of observed continuum reflection from the disk. While it is possible that the reflection has been drowned out in some way by the power-law continuum, we must also consider the physical implications if reflection is indeed absent above . It could be that we are witnessing the transition of the accretion flow to a radiatively-inefficient state at some critical radius in the disk, which could largely eliminate reflection features from the spectrum. A broad iron line is still produced, however, and the velocity width of the line is consistent with an origin close to the black hole. If the inner disk is an ADAF, it is possible that the broad Fe K line is emitted from optically-thick material near the base of the jet, or perhaps from a yet more exotic mechanism such as the Cerenkov-like line radiation postulated by You et al. (2003). Coordinated observations of both the inner jet(s) (radio) and the inner accretion flow (X-ray) are needed in order to solve this puzzle.
Acknowledgments
LB and MK thank the NASA Postdoctoral Program, administered by ORAU, for their support at NASA’s GSFC. KW gratefully acknowledges support from NASA grant NNX08AC226, MA from NASA grant NNX08AC22G. YYK is a Research Fellow of the Alexander von Humboldt Foundation. LB and KW also appreciate excellent advice from Tahir Yaqoob, Chris Reynolds, Julian Krolik, Demos Kazanas and Tim Kallman. KW would like to dedicate this work to Professor Andrew Wilson, who prompted her interest in LINERs and NGC 1052 in the 1990s. We gratefully acknowledge the helpful comments received from our anonymous referee, which have improved this work.
References
- Arnaud (1996) Arnaud, K. A. 1996, in Astronomical Society of the Pacific Conference Series, Vol. 101, Astronomical Data Analysis Software and Systems V, ed. G. H. Jacoby & J. Barnes, 17–+
- Barth et al. (1999) Barth, A. J., Filippenko, A. V., & Moran, E. C. 1999, Astrophys. J. Lett., 515, L61
- Bianchi et al. (2008) Bianchi, S., La Franca, F., Matt, G., Guainazzi, M., Jimenez Bailón, E., Longinotti, A. L., Nicastro, F., & Pentericci, L. 2008, Mon. Not. R. astr. Soc., L74+
- Blandford & Znajek (1977) Blandford, R. D. & Znajek, R. L. 1977, Mon. Not. R. astr. Soc., 179, 433
- Braatz et al. (1994) Braatz, J. A., Wilson, A. S., & Henkel, C. 1994, Astrophys. J. Lett., 437, L99
- Claussen et al. (1998) Claussen, M. J., Diamond, P. J., Braatz, J. A., Wilson, A. S., & Henkel, C. 1998, Astrophys. J. Lett., 500, L129+
- Fabian et al. (1989) Fabian, A. C., Rees, M. J., Stella, L., & White, N. E. 1989, Mon. Not. R. astr. Soc., 238, 729
- Gabel et al. (2000) Gabel, J. R., Bruhweiler, F. C., Crenshaw, D. M., Kraemer, S. B., & Miskey, C. L. 2000, Astrophys. J., 532, 883
- Gierliński et al. (2008) Gierliński, M., Done, C., & Page, K. 2008, MNRAS, 388, 753
- Guainazzi & Antonelli (1999) Guainazzi, M. & Antonelli, L. A. 1999, MNRAS, 304, L15
- Guainazzi et al. (2000) Guainazzi, M., Oosterbroek, T., Antonelli, L. A., & Matt, G. 2000, Astr. Astrophys., 364, L80
- Hawley & Krolik (2006) Hawley, J. F. & Krolik, J. H. 2006, ApJ, 641, 103
- Heckman (1980) Heckman, T. M. 1980, Astr. Astrophys., 87, 152
- Ho et al. (1997) Ho, L. C., Filippenko, A. V., & Sargent, W. L. W. 1997, Astrophys. J., 487, 568
- Kadler et al. (2004a) Kadler, M., Kerp, J., Ros, E., Falcke, H., Pogge, R. W., & Zensus, J. A. 2004a, Astr. Astrophys., 420, 467
- Kadler et al. (2004b) Kadler, M., Ros, E., Lobanov, A. P., Falcke, H., & Zensus, J. A. 2004b, Astr. Astrophys., 426, 481
- Kadler et al. (2004c) Kadler, M., Ros, E., Weaver, K., Kerp, J., & Zensus, J. A. 2004c, in Bulletin of the American Astronomical Society, Vol. 36, Bulletin of the American Astronomical Society, 823–+
- Kalberla et al. (2005) Kalberla, P. M. W., Burton, W. B., Hartmann, D., Arnal, E. M., Bajaja, E., Morras, R., & Pöppel, W. G. L. 2005, Astr. Astrophys., 440, 775
- Kataoka et al. (2007) Kataoka, J., Reeves, J. N., Iwasawa, K., Markowitz, A. G., Mushotzky, R. F., Arimoto, M., Takahashi, T., Tsubuku, Y., Ushio, M., Watanabe, S., Gallo, L. C., Madejski, G. M., Terashima, Y., Isobe, N., Tashiro, M. S., & Kohmura, T. 2007, Publ. astr. Soc. Japan, 59, 279
- Kinkhabwala (2003) Kinkhabwala, A. A. 2003, PhD thesis, AA(COLUMBIA UNIVERSITY)
- Knapp et al. (1978) Knapp, G. R., Faber, S. M., & Gallagher, J. S. 1978, Astr. J., 83, 139
- Laor (1991) Laor, A. 1991, Astrophys. J., 376, 90
- Magdziarz & Zdziarski (1995) Magdziarz, P. & Zdziarski, A. A. 1995, Mon. Not. R. astr. Soc., 273, 837
- Markowitz & Edelson (2004) Markowitz, A. & Edelson, R. 2004, Astrophys. J., 617, 939
- Marscher (2006) Marscher, A. P. 2006, Astron. Nachr., 327, 217
- Marscher et al. (2002) Marscher, A. P., Jorstad, S. G., Gómez, J.-L., Aller, M. F., Teräsranta, H., Lister, M. L., & Stirling, A. M. 2002, Nature, 417, 625
- Meier et al. (2001) Meier, D. L., Koide, S., & Uchida, Y. 2001, Science, 291, 84
- Mewe et al. (1985) Mewe, R., Gronenschild, E. H. B. M., & van den Oord, G. H. J. 1985, Astr. Astrophys. Suppl., 62, 197
- Miller et al. (2006) Miller, J. M., Homan, J., Steeghs, D., Rupen, M., Hunstead, R. W., Wijnands, R., Charles, P. A., & Fabian, A. C. 2006, ApJ, 653, 525
- Miniutti et al. (2007) Miniutti, G., Fabian, A. C., Anabuki, N., Crummy, J., Fukazawa, Y., Gallo, L., Haba, Y., Hayashida, K., Holt, S., Kunieda, H., Larsson, J., Markowitz, A., Matsumoto, C., Ohno, M., Reeves, J. N., Takahashi, T., Tanaka, Y., Terashima, Y., Torii, K., Ueda, Y., Ushio, M., Watanabe, S., Yamauchi, M., & Yaqoob, T. 2007, Publ. astr. Soc. Japan, 59, 315
- Narayan & Yi (1994) Narayan, R. & Yi, I. 1994, Astrophys. J. Lett., 428, L13
- Nelson & Whittle (1995) Nelson, C. H. & Whittle, M. 1995, ApJS, 99, 67
- Papadakis et al. (2002) Papadakis, I. E., Petrucci, P. O., Maraschi, L., McHardy, I. M., Uttley, P., & Haardt, F. 2002, Astrophys. J., 573, 92
- Rees et al. (1982) Rees, M. J., Begelman, M. C., Blandford, R. D., & Phinney, E. S. 1982, Nature, 295, 17
- Reynolds & Nowak (2003) Reynolds, C. S. & Nowak, M. A. 2003, Phys. Reports, 377, 389
- Ros et al. (2007) Ros, E., Kadler, M., Kaufmann, S., Kovalev, Y. Y., Tueller, J., & Weaver, K. A. 2007, in Highlights of Spanish Astrophysics IV, ed. F. Figueras, J. M. Girart, M. Hernanz, & C. Jordi, 165–+
- Ross & Fabian (2005) Ross, R. R. & Fabian, A. C. 2005, Mon. Not. R. astr. Soc., 358, 211
- Shakura & Syunyaev (1973) Shakura, N. I. & Syunyaev, R. A. 1973, Astr. Astrophys., 24, 337
- Tremaine et al. (2002) Tremaine, S., Gebhardt, K., Bender, R., Bower, G., Dressler, A., Faber, S. M., Filippenko, A. V., Green, R., Grillmair, C., Ho, L. C., Kormendy, J., Lauer, T. R., Magorrian, J., Pinkney, J., & Richstone, D. 2002, ApJ, 574, 740
- Weaver et al. (1999) Weaver, K. A., Wilson, A. S., Henkel, C., & Braatz, J. A. 1999, Astrophys. J., 520, 130
- Woo & Urry (2002) Woo, J.-H. & Urry, C. M. 2002, ApJ, 579, 530
- Yaqoob et al. (2001) Yaqoob, T., George, I. M., Nandra, K., Turner, T. J., Serlemitsos, P. J., & Mushotzky, R. F. 2001, Astrophys. J., 546, 759
- Yaqoob & Padmanabhan (2004) Yaqoob, T. & Padmanabhan, U. 2004, Astrophys. J., 604, 63
- You et al. (2003) You, J. H., Liu, D. B., Chen, W. P., Chen, L., & Zhang, S. N. 2003, Astrophys. J., 599, 164
- Zdziarski et al. (1995) Zdziarski, A. A., Johnson, W. N., Done, C., Smith, D., & McNaron-Brown, K. 1995, Astrophys. J. Lett., 438, L63
- Zhang et al. (2006) Zhang, Y. H., Treves, A., Maraschi, L., Bai, J. M., & Liu, F. K. 2006, Astrophys. J., 637, 699