Near-Infrared and band studies of the 2006 outburst of the recurrent nova RS Ophiuchi
Abstract
We present near-infrared photo-spectroscopy in the and bands of the 2006 outburst of the recurrent nova RS Ophiuchi (RS Oph). The observations cover the period between 1 to 94 days after the eruption. The near infrared light curve is presented. An extensive set of spectra are presented, lines identified and the general characteristics of the spectra discussed. Analysis of the HI line profiles show the presence of broad wings on both flanks of a strong central component indicating the presence of a bipolar velocity flow in the ejecta. Such a flow is kinematically consistent with the bipolar structure that the object displays in high-resolution spatial images. We discuss the behaviour and origin of the Fe II lines at 1.6872 and 1.7414 m that are prominently seen throughout the span of the observations. It is examined and shown that Lyman and Lyman continuum fluorescence are viable mechanisms to excite these lines. We draw upon the result, that collisional excitation can also contribute in exciting and significantly enhancing the strength of these Fe II lines, to propose that these lines originate from a site of high particle density. Such a likely site could be the high-density, low temperature contact surface that should exist in the shockfront in between the shocked ejecta and red giant wind. Recombination analysis of the HI lines indicate deviations from Case B conditions during most of the span of our observations indicating optical depth effects. It appears likely that the breakout of the shockfront had not yet occured till the end of our observations. An analysis is made of the temporal evolution of the [Si VI] 1.9641 m coronal line and another coronal line at 2.0894 m which is attributed to [Mn XIV]. Assuming collisional effects to dominate in the hot coronal gas, estimates are made of the ion temperature in the gas.
keywords:
infrared: spectra - line : identification - stars : novae, cataclysmic variables - stars : individual (RS Ophiuchi) - techniques : spectroscopic, photometric1 Introduction
The recurrent nova RS Oph underwent its most recent outburst on 2006 February 12.83. It was discovered at =4.5 near the optical peak (Hirosawa 2006). The earlier outbursts of RS Oph have been well documented - the previous eruptions having occured in 1898, 1933, 1958 and 1985. The RS Oph binary system comprises of a white dwarf primary accompanied by a red giant secondary - the orbital period of the system being 455.72 0.83 days (Fekel et al. 2000). A more recent study by Brandi et al. (2009) finds a closely similar value of 453.6 0.4 days for the orbital period. There is some uncertainty regarding the exact classification of the secondary companion - suggested classifications range from K0 III to M4 III with M2 III being the most likely (Worters et al. 2008 and references therein). The recent outburst has been studied in great details at several wavelength regimes viz. in X-rays (e.g. Sokoloski et al. 2006, Bode et al. 2006), in the optical (Iijima 2006, Skopal et al. 2008; Buil 2006, Fujii 2006), in the infrared (e.g. Das et al. 2006, Evans et al. 2007a, Monnier et al. 2006) and in the radio (e.g. O’Brien et al. 2006; Kantharia et al. 2007; Rupen et al. 2008). In our previous study (Das et al. 2006), we had presented and analysed the band near-infrared data. Our focus, at that stage, was on the IR detection and behaviour of a shock wave that is generated as the high velocity ejecta from the outburst interacts with the pre-existing red giant wind. The velocity changes in the propagating shock front, notably its rapid deceleration, were inferred by noting the large changes in the linewidths of the Pa 1.2818 m and the Ly fluoresced OI 1.1287 m lines in the band. In the present work, we study the general near-IR characteristics of the present eruption in greater detail. To achieve this, we extend the analysis of some of the earlier band data but, more importantly, present new and extensive and spectroscopic and photometric observations of RS Oph upto 94 days after its outburst.
2 Observations
RS Oph was observed regularly since its discovery on 2006 Feb 12.83. Both spectroscopic and photometric observations in the near-IR bands were obtained at the Mt. Abu 1.2m telescope. The spectra were obtained at similar dispersions of 9.75 Å/pixel in each of the bands using the Near Infrared Imager/Spectrometer with a 256256 HgCdTe NICMOS3 array. The log of spectroscopic observations has been presented in Table 1. In each of the bands, generally a set of at least two spectra were taken with the nova off-set to two different positions along the slit (slit width 1 arcsec). The dithered spectra were subtracted from each other to remove the contribution from the sky. In order to remove telluric features in the object spectra, spectra of a standard star (SAO 122754; spectral type A0V) were also recorded; the general attempt always being to obtain the object and standard star spectrum at the same airmass. The spectra were extracted and analysed using the APEXTRACT task in IRAF and wavelength calibration was done using a combination of OH sky lines and telluric lines that register with the stellar spectra. Following the standard reduction procedure, the Hydrogen Paschen and Brackett absorption lines were first removed by manual extrapolation from the spectra of the comparison star. While the absorption lines are generally well removed in this process, it is estimated that residuals amounting to 5 percent of the line strength may still remain. The nova spectra were then divided by the spectrum of the comparison star; these ratioed spectra were multiplied by a blackbody curve corresponding to the effective temperature of the comparison star to yield the final spectra. The ratioing process, while removing telluric features sufficiently well, leaves some residuals in the wavelength regions where telluric absorption is strong. This applies significantly to the region around 2.0 m in the band which is strongly affected by atmospheric carbon-dioxide.
The photometry of RS Oph was done under photometric sky conditions using the imaging mode of the NICMOS3 array. In each of the filters, several frames in 5 dithered positions, offset typically by 20 arcsec, were obtained of both the nova and a selected standard star. Photometric reduction was done using the aperture photometry task APPHOT in IRAF. The derived magnitudes, with typical errors in the range of 0.01 to 0.03 magnitudes, along with the log of the photometric observations are given in Table 2.
| Date | Days | Integration time | |||
|---|---|---|---|---|---|
| 2006 | since | (sec) | |||
| (UT) | Outburst | J | H | K | |
| Feb. 13.9929 | 1.1629 | 10 | 10 | 10 | |
| Feb. 14.9915 | 2.1615 | 10 | 10 | 10 | |
| Feb. 15.9898 | 3.1598 | 10 | 10 | 10 | |
| Feb. 16.9866 | 4.1566 | 10 | 10 | 10 | |
| Feb. 19.9759 | 7.1459 | 10 | 8 | 10 | |
| Feb. 20.9721 | 8.1421 | 5 | 8 | 10 | |
| Feb. 21.9463 | 9.1163 | 10 | 10 | 15 | |
| Feb. 22.9505 | 10.1205 | 10 | 10 | 10 | |
| Feb. 24.9705 | 12.1405 | 10 | 10 | 10 | |
| Feb. 26.9926 | 14.1626 | 10 | 10 | 10 | |
| Feb. 28.9542 | 16.1242 | 15 | 10 | 10 | |
| Mar. 02.9465 | 18.1165 | 20 | 20 | 20 | |
| Mar. 16.9465 | 32.1165 | 20 | 30 | 30 | |
| Mar. 17.8866 | 33.0566 | 30 | 30 | 30 | |
| Mar. 18.9372 | 34.1072 | 30 | 30 | 30 | |
| Mar. 19.8833 | 35.0533 | 30 | 30 | 30 | |
| Mar. 20.8733 | 36.0433 | 45 | 30 | 30 | |
| Mar. 22.8682 | 38.0382 | 45 | 45 | 45 | |
| Mar. 26.8778 | 42.0478 | 60 | 60 | 60 | |
| Mar. 27.8644 | 43.0344 | 60 | 60 | 60 | |
| Mar. 29.8462 | 45.0162 | 75 | 90 | 90 | |
| Mar. 30.8629 | 46.0329 | 75 | 90 | 90 | |
| Mar. 31.8701 | 47.0401 | 90 | 90 | 90 | |
| Apr. 02.8736 | 49.0436 | 90 | 120 | 120 | |
| Apr. 03.9691 | 50.1391 | 90 | 120 | 120 | |
| Apr. 05.9607 | 52.1307 | 90 | 90 | 90 | |
| Apr. 10.8936 | 57.0636 | 90 | 120 | 90 | |
| Apr. 12.8454 | 59.0154 | 90 | 120 | 90 | |
| Apr. 22.9392 | 69.1092 | 90 | 90 | 90 | |
| Apr. 29.8355 | 76.0055 | 120 | 120 | 120 | |
| May. 01.8149 | 77.9849 | 120 | 180 | 180 | |
| May. 03.810 | 79.980 | 180 | 180 | 180 | |
| May. 11.8353 | 88.0053 | 270 | 270 | 270 | |
| May. 17.8103 | 93.9803 | 270 | 270 | 270 |
| Date | Days | Magnitudes | |||
|---|---|---|---|---|---|
| 2006 | since | ||||
| (UT) | Outburst | J | H | K | |
| Feb. 23.9518 | 11.1218 | 4.82 | 4.54 | 3.85 | |
| Feb. 27.9259 | 15.0959 | 5.12 | 4.79 | 4.19 | |
| Mar. 01.9485 | 17.1185 | 5.30 | 4.97 | 4.42 | |
| Mar. 21.8986 | 37.0686 | 6.46 | 6.12 | 5.64 | |
| Mar. 22.9645 | 38.1545 | 6.43 | 6.14 | 5.63 | |
| Mar. 26.9534 | 42.1234 | 6.67 | 6.23 | 5.75 | |
| Mar. 27.9189 | 43.0889 | 6.69 | 6.30 | 5.81 | |
| Mar. 29.9696 | 45.1396 | 6.73 | 6.32 | 5.81 | |
| Apr. 29.9037 | 76.0737 | 7.12 | 6.53 | 6.33 | |
| May. 01.8913 | 78.0613 | 7.16 | 6.56 | 6.43 | |
| May. 03.8845 | 80.0545 | 7.35 | 6.55 | 6.49 | |
| May. 11.9199 | 88.0899 | 7.57 | 6.92 | 6.56 | |
| May. 17.9127 | 94.0827 | 7.86 | 7.01 | 6.74 |

3 Results
3.1 Photometry: The Lightcurve
We present in Figure 1 the lightcurves of RS Oph using photometric data obtained between 11 to 94 days after outburst. Although we would have liked to have sampled the lightcurve more frequently, our efforts were focused more on the spectroscopy. Also superimposed in Figure 1 is the near-IR lightcurve of the 1985 outburst which was obtained by Evans et al. (1988). While it is known that the visual lightcurve behaves similarly from outburst to outburst (Rosino Iijima 1987), an equivalent comparison for the near-IR lightcurve had not been possible earlier for lack of data. The present data shows that the IR decline is quite similar to that of the 1985 outburst. However, some caution is needed while comparing the near-IR light curves because of the effect of emission lines on the measured continuum flux in the photometric bands. The JHK spectra of RS Oph has prominent emission lines, some of which lie at the edge of the photometric bands. Filter transmissions in these regions can vary significantly in different photometric systems thereby contributing different amounts of the line flux to the measured continuum. For example, Whitelock et al. (1984) point out the significant effect of the HeI 1.083 m line on the measured J magnitudes in emission line stars (the HeI line lies at the edge of the J band and can be strong).
A compilation of several observations of the pre-outburst or quiescent photometry of RS Oph shows that it has a mean pre-outburst values of = 7.72; = 6.945; = 6.66 (Evans et al. 1988; Table 1 therein). From our data we see that in each of the bands the magnitude returned to its pre-outburst value by 88 days. Our last observation on day 94 suggests that the decline appears to continue below this level - such a trend was clearly seen by Evans et al. (1988) for the 1985 outburst.
3.2 Spectroscopy: General characteristics of the spectra and line identification
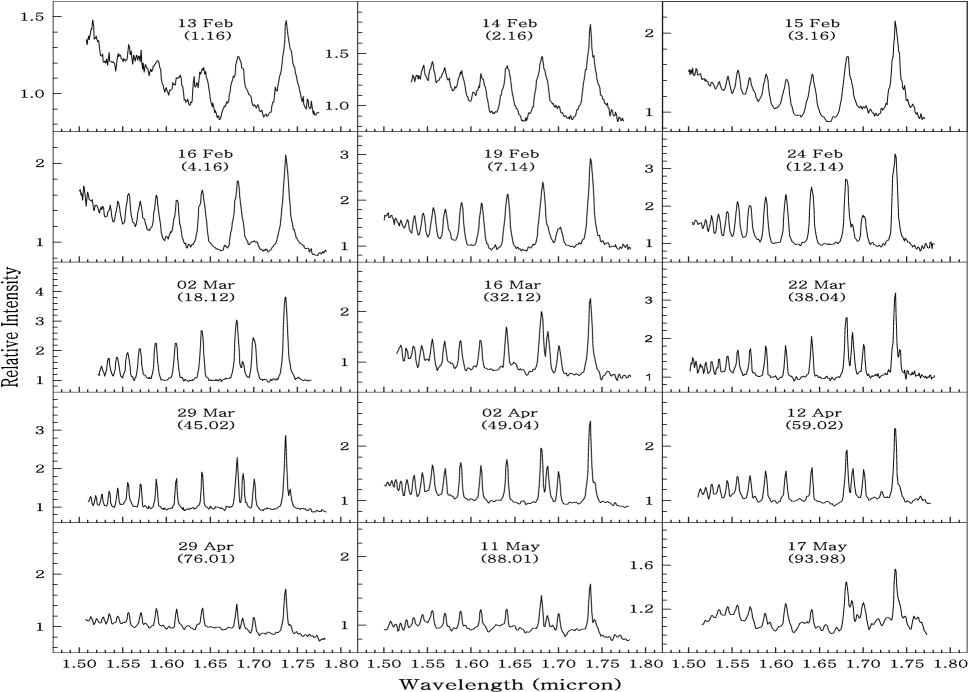
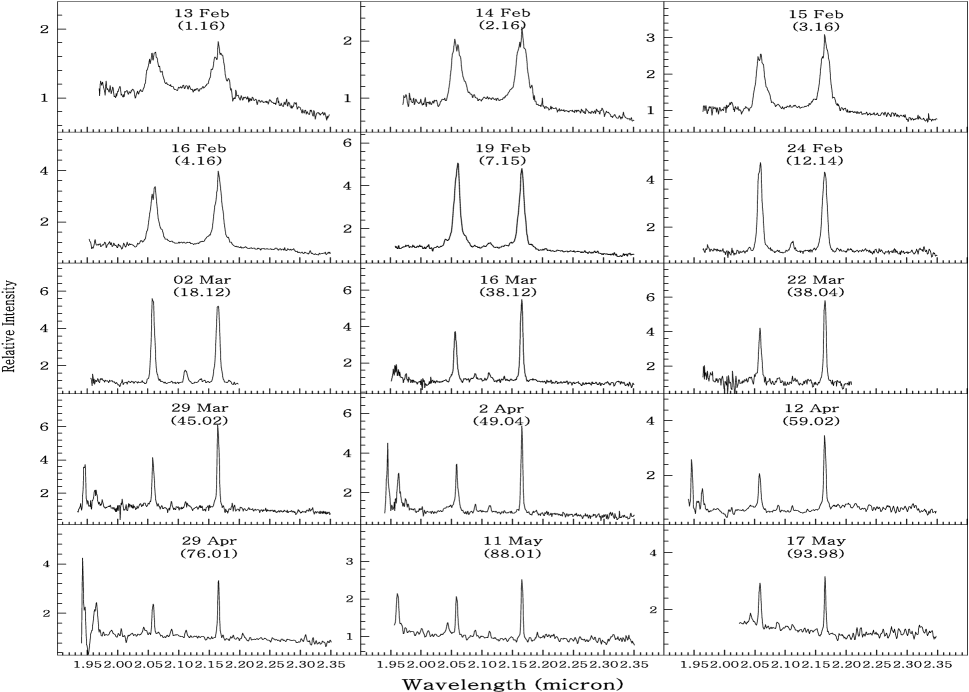
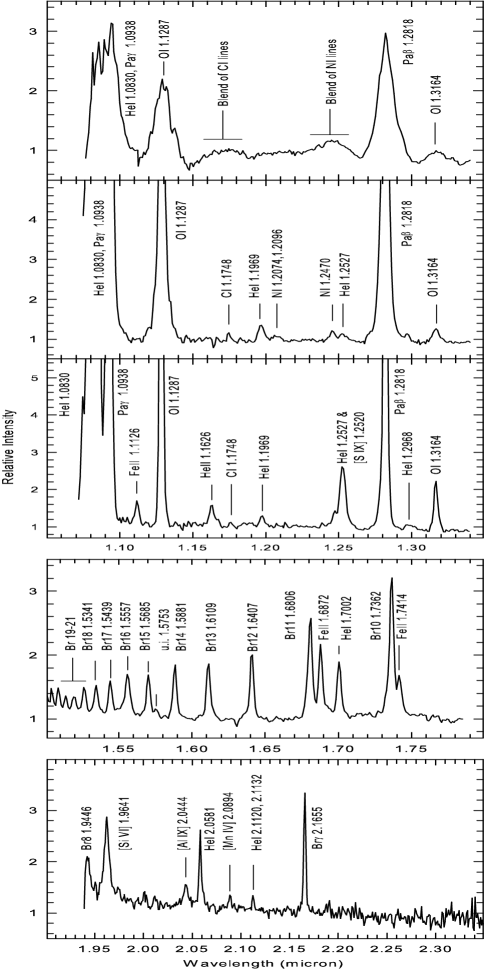
Although spectra of RS Oph were obtained on several days, we present in Figures 2 and 3 selected and band spectra that suffice to give the general trend of the spectral evolution of the object. Since a similar mosaic for the band spectra has already been presented in Das et al. (2006), it is not included here. However, to facilitate studying the overall evolution of the object in the , and bands, we show three representative band spectra in Figure 4 and also expanded views of selected and band spectra. These spectra in Figure 4 enable a proper line identification to be made and to also bring out the weaker lines which are not easily discernible in Figures 2 and 3. The line identification is given in Table 3 and certain related aspects are discussed in more details below.
Over the span of our observations, the HI recombination lines remain prominent in the spectra - these include Brackett in the band, Br 10 to 21 in the band, and Paschen and Paschen in the band. Among the HeI lines, those at 1.0830, 1.7002 and 2.0581 m are prominent. The other weaker lines of HeI detected are those at 1.1969, 1.2527, 1.2968, 2.1120 and 2.1132 m. The other prominent lines in the spectra are the Ly fluoresced 1.1287 m and continuum fluoresced 1.3164 m OI lines respectively and two lines at 1.6872 and 1.7414 m which we attribute to Fe II. A more detailed discussion on these Fe II lines is made in a following subsection. Nitrogen is detected as a broad feature centered around 1.245 m which is seen conspicuously in the spectrum soon after outburst (top panel of Figure 4). This feature, which could be a blend of NI lines at 1.2461 and 1.2469 m, weakens with time but can still be readily discerned in the later spectra (second and third panel from top of Figure 4) on the blue wing of the HeI 1.2527 m line. An additional NI feature, a blend of the NI 1.2074 and 1.2096 m lines, also appears to be detected (however see Evans et al. 2007 who attribute this feature to OII 1.2084 m). Weak features of carbon are also possibly being detected. Immediately after outburst (top panel of Figure 4), a broad conspicuous bump is seen centered around 1.175 m. This feature could be a blend of several carbon lines that lie between 1.1653 and 1.1886 m (the strongest of these are the 1.1748, 1.1753 and 1.1755 m lines - the blended feature of these lines appears to persist weakly at 1.1748 m for quite some time after outburst ). These carbon lines which are weak here, can be extremely strong in novae which have less massive central white dwarfs (CO novae) e.g. in V1280 Sco (Das et al. 2008) and V2274 Cyg (Rudy et al. 2003). In this context it is noted that the analysis of optical and X-ray spectra indicate the ejecta to be enriched in nitrogen and depleted in carbon (Ness et al. 2008 and references therein).
Among the coronal lines, we detect [Si VI] 1.9641 m, [S IX] 1.2520 m, [Al IX] 2.0444 m and a line at 2.09 m which could possibly be [Mn XIV] 2.0887 m. The [Si VI] 1.9641 m line appears at the edge of our instrument spectral window i.e. in a region of low instrument and atmospheric transmission. The spectrum in this region is noisy making it difficult to accurately estimate the strength of the line. However we can state, with a fair level of confidence, that the line begins to be clearly detected in the spectrum of 26.88 March 2006. This sets an upper limit on when the line began to be seen in the band. On the other hand, it is difficult to be definitive about when the [S IX] 1.2520 m line first begins to appear because it is severely blended with the HeI 1.2527 m line. But from an examination of all our band spectra (Das et al. 2006), we see a significant strengthening of the 1.2527 HeI plus [S IX] feature between 20-29 March. It is likely that this strengthening is due to the emergence of the [S IX] 1.2520 m line at around this time. Though the identification is uncertain, we attribute the observed line at 2.09 m to [Mn XIV] 2.0894 m. The [Mn XIV] 2.0894 m line is not one among the commonly observed coronal lines in novae. Wagner Depoy (1996) did observe a line at 2.092 m in nova V1974 Cyg during its coronal phase and tentatively assigned it to [Mn XIV] 2.0894 m. An analysis of the temporal evolution of the coronal lines is given in section 3.7.
There is no evidence for dust formation in the ejecta till the end of our observations. Neither the magnitudes show a development of an infrared excess nor do the slope of the continua in the spectra show an upturn towards longer wavelengths indicative of dust formation. It may be noted that Spitzer observations obtained over the period 208-430 days after the eruption revealed evidence for silicate dust features at 9.7 and 18 m (Evans et al. 2007b). But this silicate dust appears not to have formed in the nova ejecta; rather it has been interpreted as being a part of the redgiant wind that existed prior to the 2006 eruption and has survived the outburst (Evans et al. 2007b).
All the emission lines in the and bands (Figures 2 and 3) show a rapid narrowing with time similar to what was earlier reported for the Pa 1.2818 m and OI 1.1287 m lines in the band (Das et al. 2006). Such behaviour was interpreted in terms of the deceleration of the shock wave as it propagated through the pre-existing red giant wind. Since a detailed analysis of the evolution of the shock, from line profile analysis, has already been presented for the band lines, we do not repeat a similar analysis for the emission lines seen in the and bands. However, we may briefly mention that the Br line was similarly analysed as the band lines and its line velocity shows a similar temporal evolution as the Pa line.
| Wavelength | Species | Other contributing | |
|---|---|---|---|
| (m) | lines remarks | ||
| 1.0830 | He i | ||
| 1.0938 | Pa | ||
| 1.1126 | Fe II | ||
| 1.1287 | O i | ||
| 1.1626 | He ii | ||
| 1.1748 | C i | Possible blend of several CI | |
| lines between 1.1653 1.1886 | |||
| 1.1969 | He i | ||
| 1.2074 | N i | blended with N i 1.2096 | |
| 1.2470 | N i | blended with N i 1.2461 | |
| 1.2527 | He i | ||
| 1.2520 | [S ix] | ||
| 1.2818 | Pa | ||
| 1.2968 | He i? | ||
| 1.3164 | O i | ||
| 1.5133 | Br21 | ||
| 1.5184 | Br20 | ||
| 1.5256 | Br19 | ||
| 1.5341 | Br18 | ||
| 1.5439 | Br17 | ||
| 1.5557 | Br16 | ||
| 1.5685 | Br15 | ||
| 1.5753 | u.i. | unidentified | |
| 1.5881 | Br14 | ||
| 1.6109 | Br13 | ||
| 1.6407 | Br12 | ||
| 1.6806 | Br11 | ||
| 1.6872 | Fe ii | ||
| 1.7002 | He i | ||
| 1.7362 | Br10 | ||
| 1.7413 | Fe ii | ||
| 1.9446 | Br8 | ||
| 1.9641 | [Si vi] | ||
| 2.0444 | [Al ix] | ||
| 2.0581 | He i | ||
| 2.0894 | [Mn xiv] | uncertain identification | |
| 2.1120 | He i | blended with He i 2.1132 | |
| 2.1369 | u.i | unidentified | |
| 2.1655 | Br |
3.3 Evidence for a bipolar flow
A significant finding that has emerged from studies of the present outburst of RS Oph is the presence of extended structure in the ejected material. Images from the Hubble Space Telescope, taken 155 and 449 days after outburst in the [OIII] 5007 and [NeV] 3426 lines, clearly show an expanding hourglass shaped nebula around RS Oph (Bode et al. 2007, Harman et al. 2008). Such bipolar structure is commonly encountered in planetary nebulae and explained on the basis of the ejecta interacting with a non-uniform circumstellar environment. Alternatively, the ejection of the material could be intrinsically anisotropic but this scenario does not appear to be favored here (Harman et al. 2008). In the first scenario, if the pre-existing circumstellar material has a density enhancement in the equatorial plane then the outflowing ejecta is impeded from expanding in the equatorial region while expanding relatively more freely in the polar direction.This leads to a constriction of the nebula in the equatorial region thereby giving rise to an hourglass shape. Kinematically, this would imply that the matter in the poles would flow out with a high velocity relative to the matter in the waist of the hourglass. Evidence corroborating such a bipolar velocity flow was reported in interferometric studies by Chesneau et al. (2007) and from H line profile analysis by Skopal et al. (2008). By modeling the band visibilities obtained 5.5 days after outburst, Chesneau et al. (2007) find evidence for two radial velocity fields - a slow expanding ring like structure (likely the waist of the nebula) with a velocity 1800 km/s and a faster structure (possibly originating from the polar regions) with a velocity of 2500-3000km/s. Skopal et al. (2008) obtain a similar result from their H profiles, taken early after the outburst, which shows a main emission component flanked by two weaker high velocity components in the wings (Figure 2 of Skopal et al. 2008).
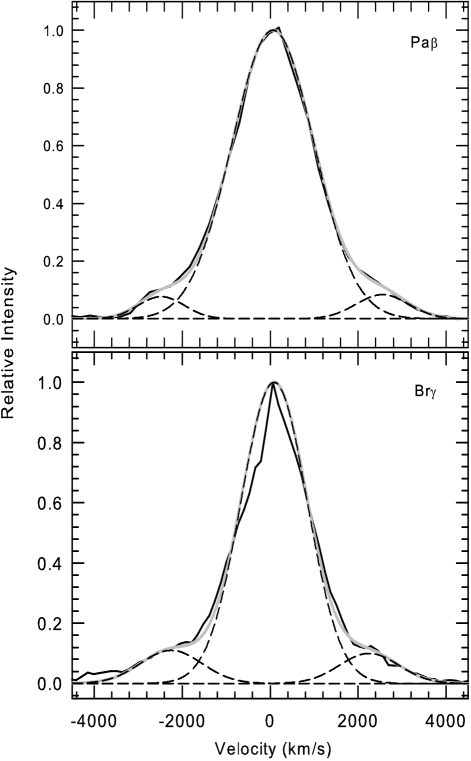
Similar evidence for a bipolar flow is also seen from our near-IR data. To illustrate this, we present in Figure 5, representative profiles of the Pa and Br lines on Feb 16.987. As can be seen, the profiles have a strong central component flanked by two weaker components. In both panels of Figure 5, we have fitted the profile with three gaussians - a central gaussian for the core emission component and two gaussians for the satellite components in the wings (the gaussians are shown by dotted lines, their sum by the gray line and the observed data by the continuous black line). It is seen that a three component gaussian fits the data reasonably well. The fits indicate the presence of two high-velocity components at radial velocities of -2540 and +2485 km/s for Pa and at -2340 and 2160 km/s for the Br lines respectively (these high velocity components appear to be associated with the faster structure reported by Chesneau et al. 2007). The central components have FWHM’s of 2200 and 1770 km/s for the Pa and Br lines respectively. We can interpret the results of Figure 5 as follows viz. the core emission can be associated with the slower expanding material from the waist of the bipolar ejecta while the higher velocity satellite components are associated with the flow from the polar regions. It may be mentioned that Skopal et al. (2008) draw a similar interpretation from their H profiles.
3.4 The Fe II lines at 1.6872 and 1.7414 m
One of the more uncommon spectral features that are seen in our band spectra
are prominent lines of Fe II at 1.6872 and 1.7414 m. In addition, also present
in our band spectrum of RS Oph is the 1.1126 m Fe II line. This
line constitutes one of the so-called ”one micron Fe II lines” that are
detected at 0.9997, 1.0171, 1.0490, 1.0501, 1.0863, and 1.1126 m in novae
(Rudy et al. 1991, 2000). The 1 micron
lines, termed so by Rudy et al. (1991) because of their wavelength location,
were first identified by Johansson (1977) in the spectrum of Carinae
and later seen in a variety of emission-line stars (Johansson
Jordan 1984; Hamann Persson 1989; Rudy et al. 1991; Hamann et al. 1994)
and in AGNs (Rudy et al. 2000, 2001; Rodriguez-Ardila et al. 2002). In
comparison, the band Fe II lines are rather uncommon, at least in novae
spectra. In the case of novae, two of the earlier recorded instances of these
lines are in the slow nova V2540
Ophiuchi (Rudy et al 2002) and possibly also in the recurrent nova CI Aquila
(Lynch et al. 2004). One of the main processes for the excitation of the Fe II
lines is considered to be Lyman (Ly ) fluorescence. Additional excitation mechanisms are Ly continuum fluorescence and collisional excitation. Collisional excitation, which can play a significant role in enhancing the strength of the FeII lines (Bautista et al 2004), is discussed in greater details in section 3.5. We first consider the Ly alpha fluorescence process for the 1 micron lines. These lines specifically come from a three step process viz. the line proper comes
from the decay of the term at
6.72 eV above the ground state; this term being fed as a second step
from decay of a term at 13.5eV which is originally pumped in the first
step by Ly fluorescence (Johansson Jordan 1984).
In this context, we examine the viability of a similar Ly excitation mechanism for the 1.6872 and 1.7414 m lines (it appears that the excitation mechanism for these lines has been studied relatively less compared to the 1 micron lines). Using the atomic line database of Kurucz (http://cfa-www.harvard.edu/amp/ampdata/kurucz23/sekur.html) we identify, at the relevant wavelengths, two Fe II lines at 1.6872 and 1.7414 m which can undergo a similar three step Ly excitation process. The 1.7414 m line results from the decay of the term at 6.222 ev above the ground state; the 1.6872 m line from the term at 9.743 eV. It so happens that both these upper levels of the 1.6872 and 1.7414 m lines can be fed by not just one, but in fact by several high lying levels - each of these high lying levels capable of being pumped by Ly photons. As examples for the 1.6872 m line we note that photons at 1215.691 and 1215.707, which are closely coincident with the Ly line center at 1215.671, can excite transitions from low lying levels in Fe II (at around 3.2 to 3.4 eV above ground state) to the higher excited levels (at around 13.4 to 13.6 eV ). These higher levels can then decay via ultraviolet photons (at 1722.607 and 1683.961 respectively) to the upper level of the 1.6872 m transition (viz. the term) . Similarly for the 1.7414 line, photons at 1215.691 and 1215.873 can Ly fluoresce from low lying levels in Fe II to the higher excited levels. These higher levels can then decay via UV photons (at 3370.341 and 3435.801 respectively) to the upper level of the 1.7414 m transition (viz. the term). Since HI lines in novae (Ly included) are routinely broad with widths extending upto a few thousands of km/s, additional Fe II transitions at wavelengths away from the Ly line center could also contribute to the Ly fluorescence process. It is noted from the Kurucz data, that there are indeed quite a few such lines - within a few Angstroms of the Ly line center (1 Angstrom corresponds to about 250 km/s at the Ly wavelength) - that could also contribute to the Ly fluorescence process. It thus appears that Ly fluorescence is a viable mechanism for the excitation of the 1.6872 and 1.7414 m lines.
In addition, it also needs to be examined whether Lyman continuum (Lyc) photons can also play a role in exciting these lines. If the nova ejecta is optically thick in Ly , as is expected, then it should be optically thick in Lyc photons too - hence Lyc fluorescence could also take place. We find that this is indeed viable since several transitions of Fe II can be identified which are excited by Lyc photons to high-lying energy levels and subsequently followed by decay, via emission of an UV photon, to the upper levels of the 1.6872 and 1.7414 m lines (one of several examples is the Fe II transition at 914.846 between lower and upper states at 0.083 eV and 13.636 eV respectively which can be the subsequent decay of the higher excited state via a 1672.578 line populates the upper level of the 1.7414 m line).
Rudy et al. (2002) assigned the observed band lines with FeII lines at 1.6873 and 1.7414 m. We would agree with the identification of the 1.7414 m line since a mechanism exists to account for its presence viz. Ly and Lyc fluorescence as has been discussed. However, there is a possibility of an error in the identification of the 1.6873 m line. It is seen that actually there are two closeby lines of Fe II in this region viz at 1.68732 and 1.68719 m respectively (air wavelengths). Identification of the observed feature with the 1.68719 m (we refer to this as the 1.6872 m line throughout the text) appears correct since this line, as demonstrated, can be excited by Ly fluorescence. On the other hand the 1.6873 m line, proposed by Rudy et al. (2002) arises in emission as a transition between the and states at 6.219 and 5.484 eV respectively. We are unable to identify any transition, arising from Ly fluorescence, that can feed the upper level of this line directly or in a secondary step (as in the case of the other observed Fe II lines discussed so far). It therefore appears that the correct identification of the observed feature should be with the 1.68719 m line.
3.5 Site of the near-IR line emission and studying the possibility of shock breakout
We study whether it is possible to identify the region in the ejecta
from where the Fe II and the other near-IR emission lines arise.
The excitation mechanism of the Fe II lines could offer a clue
in this matter. While Ly fluorescence could be a vital or possibly
even the central process in exciting the Fe II lines, it may not be the sole
mechanism and collisional excitation also plays a significant role.
Such an inference is suggested from observations which show the absence, or
greatly reduced strength from expected values, of the cascade lines that feed
the upper levels of the 1 micron lines (Bautista et al. 2004 for a detailed
discussion of the observational evidence). Bautista et al. (2004)
show that Fe II has several high-energy pseudometastable levels and that
collisional coupling between such metastable levels and radiative-emitting
levels is considerable. They show that electron-impact-induced transitions
from metastable levels strengthens lines throughout the emission spectrum and in
particular strengthens the lines that result from secondary decay
after Ly pumping like the 1 m lines. Model calculations of the
emissivities (Bautista et al. 2004; Figure 1 therein) show that the peak emissivities
of lines can be enhanced by a factor of ten or more when collisional transitions are
taken into account vis-a-vis when these transitions are neglected in the
calculations. The emissivities of the lines are found to be dependent strongly
on the electron density and peak emissivities are seen to occur at high
densities in the range to electrons/cm3.
The need for high particle densities to make these lines prominent is not
surprising - it is under such conditions that the number of collisional excitations
from the metastable levels can be expected to be enhanced. In essence, the model
calculations suggest that if the 1.6872, 1.7414 m lines or the 1 m lines
are strong, then high density conditions are likely to be prevalent in the ejecta.
This in turn, could offer an insight into the site of the Fe II emission. From an
inspection of Figures 2 and 3 it is seen that the 1.6872 and 1.7414 m
lines remain prominent throughout the entire span of the observations. Since both
lines flank the redward wings of Br 11 and Br 10 lines respectively, they are
difficult to resolve as separate lines - even if they are present - during the
early phases of the expansion when all the emission lines are broad. However,
in spite of this, the presence of the 1.6872 m line can be seen as a discernible
inflection on the red wing of Br 11 in the 19 February spectrum. We interpret this
to mean that high density conditions prevail from almost the beginning to the end
of the observations
in mid-May 2006 inspite of the considerable reduction in density that should be
expected as the ejecta expands (in case of a geometric dilution with time i.e.
proportional , the electron density is expected to drop by a factor
of around 250 to 1000 between Feb 15-19 to our last observation on 17 May).
A possible site, where such high density conditions can be generated and sustained as long as the shock lasts, is the region of discontinuity that is formed in a shock when a fast wind flows into a slow wind. Recent one dimensional hydrodynamical models have been developed by Vaytet et al. (2007) to study the structure and evolution of such a shock in the RS Oph system. Their models aim to revise and improve earlier studies (O’Brien, Bode and Kahn, 1992) by taking into account the ejection of material in the outburst as well as allowing the duration of the fast wind phase to be varied, as opposed to the instantaneous release of pure energy employed in their previous Primakoff-type models. In addition, Vaytet et al (2007) also include the effects of radiative cooling from the shocked gas which can significantly affect the dynamics of the system. Their model calculations show a complex structure for the shock front revealed through the presence of both forward and reverse shocks, with a separating contact discontinuity. In both their updated models viz. the adiabatic wind model and the radiatively cooled model, the contact discontinuity is found to be the site of high density and low temperature conditions (relative to the material in the forward and reverse shocked regions). These effects (enhancement of density and lowering of temperature) are more pronounced in the radiatively cooled model.
In view of the above, we thus propose that the Fe II emission, which is apparently favored by high-density conditions, originates from a region associated with the contact discontinuity. In addition, Fe II is an ion of low ionization stage implying that it should originate in a zone of low kinetic temperature (a similar reasoning applies for the presence of neutral OI lines and suggests it coexists with Fe II). If our premise of associating the Fe II emission with the dense matter at the contact discontinuity is correct, then the fact that prominent Fe II emission is seen even upto 90 days after outburst would imply that the shockfront had not broken out even at that stage. When is breakout expected? The answer to this is complicated because of the bipolar velocity flow in the nebula. Since the polar flow is much faster than the equatorial flow (Figure 5, section 3.3), it should breakout much earlier. On the other hand, again from Figure 5, there appears to be much lesser contribution to the line luminosity from the high-speed bipolar jets vis-a-vis that from the equatorial flow. Thus even if a breakout takes place in the polar direction and contribution to Fe II emission from this region ceases, the bulk of the Fe II emission will still be expected from the shockfront in the equatorial plane that has still to break out. In general, breakout will occur when the shockfront traverses a distance equal to the finite extent of the redgiant wind - this equals the product of the velocity of the red giant wind and the time elapsed since the 1985 outburst (i.e. 21 years). The velocity of the red giant wind has been estimated to be in the range 10-20 km/s (Gorbatski 1972). For this velocity range and adopting a mean value of 1000 km/s for the shockfront velocity in the equatorial plane (from the FWHM values reported in Das et al. 2006), breakout in the equatorial direction could be expected between 75-150 days. This timescale is consistent with our conclusion that breakout may not have occured till even 90 days after outburst. The break-out time estimates are susceptible to errors because of uncertainties in the parameters involved (viz. the velocities of the red giant wind and the shockfront). However, recombination analysis of the HI lines in the following section, are reasonably in line with the conclusions drawn here.
3.6 Recombination analysis of the HI lines
.
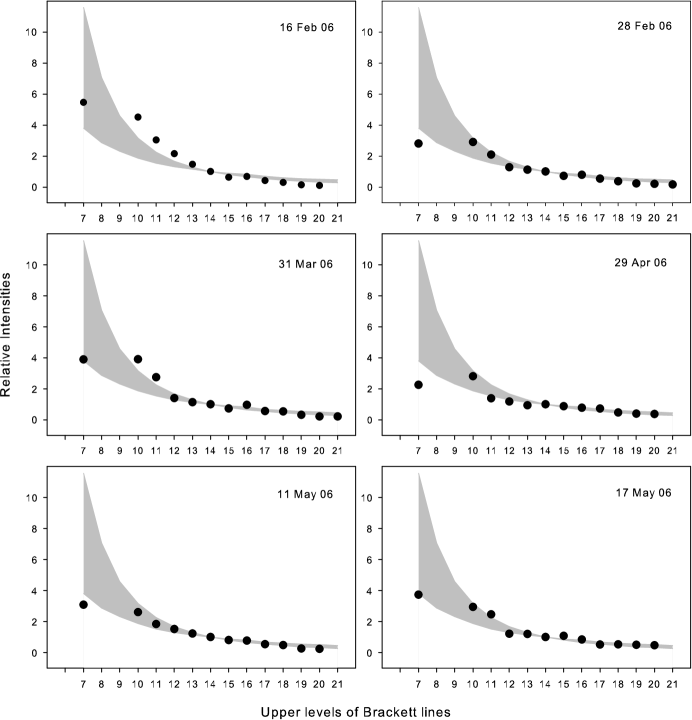
We present in Figure 6 the recombination Case B analysis for the HI lines on six reasonably equispaced epochs that sample the evolution upto 94 days after the outburst. The observed spectra were flux calibrated using the magnitudes of Table 2 after correcting for reddening using = 0.73 (or = 2.26; Snijders 1987). The observed line luminosities were then compared with the Case B emissivities of Storey Hummer (1995). Three points may be made regarding Figure 6. Since Case B calculations are only mildly sensitive to changes in the electron density and temperature , we have shown by the gray shaded area, the case B predictions (normalized to unity at Br 14) for the parameter space of varying between to cm-3 and varying between 5000 to 20000K. By showing an extended range in the parameter space, it becomes easier to establish when observed data clearly falls outside the range of plausible model values. The second point concerns the errors involved in comparing the luminosities of lines situated in different bands (Pa in band, Br 10-21 in band and Br in band). The robustness of the estimated line luminosities depends on how reliably the flux in the continuum has been calibrated in each of these bands which in turn depends on how reliable is the estimate of the reddening in the band concerned (the amount of extinction in each of the , and bands is different). Thus as a cross-check for the extinction of = 2.26 obtained by Snijders (1987), we note that modelling of the galactic interstellar extinction by Marshall et al. (2006) indicates a extinction in the direction of RS Oph of = 0.21 to 0.25 (or = 2.1 to 2.5 for = 10) for an adopted distance of 1.6kpc (Snijders 1987) to the source. Thus there is a consistency in the values estimated by different authors and it is unlikely that major errors are being introduced in the analysis by an incorrect estimate of . The third point concerns the difficulty in estimating the equivalent widths (and hence line luminosities) of the Br 10 and 11 lines because they are so strongly blended with the Fe II lines. We have measured the equivalent widths of these lines after trying to deblend the features using gaussian fits but the exercise is not entirely satisfactory. Thus, while we do show the Br 10 and 11 lines in Figure 6, their strengths are subject to considerable uncertainty (of about 30 percent) and they should be accepted with caution; the formal error in the strength of the other lines is in the range of 10 to 15 percent.
Examination of the spread in the Case B values in Figure 6 (the gray shaded area) indicates that the higher Br lines (Br15 to 20) are really not sensitive enough to discriminate whether there are deviations between the observed data and Case B model values. The lines that are sensitive are Br and Pa . In RS Oph, except for the 16 Feb 2006 data, it is seen that Br is consistently weaker than expected and that the Br /Br14 ratio is generally in the range of 2 - 4 against an expected median value of 6. There is also a suggestion that Br 10 and Br 11 are stronger than expected and Br 10 nearly equal to or stronger than Br on all days except 16 Feb. Departures in the ratio of Pa /Br from Case B are also seen - this ratio is expected to be around 6 whereas we obtain values of around 6.5, 9.5, 11.5,15,11 and 6 for the six days shown in Figure 6. Thus the Pa /Br ratio diverges considerably from Case B on most days except Feb 16 and May 17. However, on May 17, the Br lines do not conform to Case B behavior - the Br /Br14 ratio is low. The general conclusion that is therefore suggested, after taking into account the behaviour of all the HI lines, is that the Feb 16 data conforms to a reasonable extent with Case B conditions; on other days there are marked deviations from it. On these days, the observed behaviour of the Br lines i.e the presence of a Br line that is weaker than expected when compared to the higher Br lines accompanied by the additional observation that the Br line strengths are possibly peaking around Br 10 to 11 (instead of at Br ), suggests that the Br lines are optically thick. Such behaviour of the Br lines has been observed in other novae like Nova Ophiuchi 1998 (Lynch et al. 2000) and V4643 Sgr (Ashok et al. 2006) and also in Be stars (Banerjee et al. 2001). Such effects have been shown by Lynch et al. (2000) to arise from optical depth effects in an environment with high particle densities ( = to cm-3) which tends to thermalize the level populations through collisions. It would thus appear that invoking high density conditions could explain the observed deviations from Case B. It is also noted that such high density conditions prevailed throughout our observations except in the very beginning at around 16 Feb 2006. At this stage, just four days after the outburst, the ejecta has been clearly shown to be in a free expansion stage. That is, it had not yet swept up enough of the red giant wind for the deceleration to begin and possibly for the dense contact surface of the shockfront to fully develop. Hence, the high density conditions, that can create a departure from Case B, were likely to be absent at this time. The Fe II line analysis of the previous sub-section, which also suggested the need for high density conditions, is consistent with the line of argument suggested here.
3.7 Evolution of the coronal lines
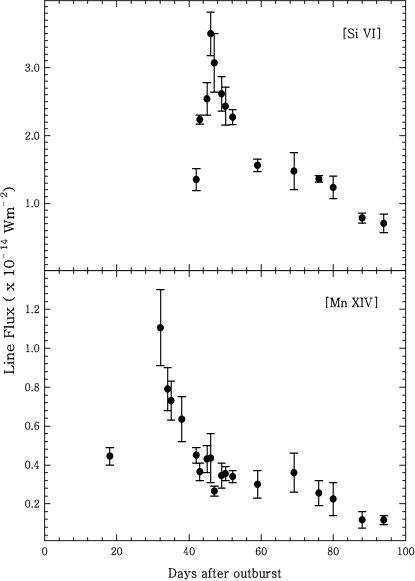
We consider the temporal evolution of the [Si VI] 1.9641 m and the [Mn XIV] 2.0894 m coronal lines here. The uncertainty in the assignment of the latter line to [Mn XIV] has already been discussed in section 3.2; we proceed by assuming that this assignment is correct. The observed strength of these lines on different days is presented in Table 4 and their temporal evolution is shown in Figure 7. The [Si VI] line is first detected clearly on around Mar. 26.88 ( 42 days after outburst). It then increases in strength, peaking at around March 30.86 ( 46 days after outburst) and subsequently declines in intensity. The [Mn XIV] line appears on Mar. 2.95 ( 18 days after outburst), earlier than the [Si VI] line, but shows a similar evolution in the sense that it increases in strength with time and subsequently declines. Unfortunately, no spectra were recorded between 3 to 16 March 2006 (i.e. 18 to 32 days after outburst) to monitor the evolution of the [Mn XIV] line during this period. The observed temporal behaviour of the coronal lines can be interpreted in a simple manner. The coronal lines are expected to arise from the hot, shocked gas in the shockfront. This gas, whose temperature in the very early stages was determined to be as high as K (Sokoloski et al. 2006), gradually cools with time. The fractional abundance of an ion (e.g. N(Si VI)/N(Si)) in a collisionally ionized, low density plasma is known to be temperature dependent. Model calculations show that the fractional abundance of Si VI peaks at a temperature of 4 K ( Jordan 1969; Shull and van Steenberg, 1982) while the Mn XIV ion peaks at 1.6 K respectively (Landini and Monsignori Fossi, 1972). Since the strength of a line associated with an ion is proportional to the abundance of the ion, it is expected that the strength of the line will change as the temperature of the plasma changes (thereby changing the abundance of the ion). It would appear that this phenomenon is being manifested here. As the shocked gas in the RS Oph system cools, a temperature will be reached that is conducive for the formation of a particular ion to begin. Subsequent lowering of the temperature should see the fractional abundance of the ion reach its peak value at the optimum temperature for its production and the fractional abundance should subsequently decline as the temperature continues to decrease.
The temporal evolution of the [Si VI] and [Mn XIV] lines, as shown in Figure 7, is consistent with such a scenario (there is, however, a possible complication which is discussed shortly) . Further, since the 2.0894 m line is detected earlier than the [Si VI] line (therefore at a phase when the shocked gas is relatively hotter), the analysis suggests that it is likely that the 2.0894 m line originates from an ion with higher ionization potential than Si VI. In this sense it is consistent to identify this line with [Mn XIV] since it has a higher ionization potential of 344 eV compared to 166.8 eV for [Si VI]. Since the [Mn XIV] and [Si VI] line emission peaks on March 16.95 and March 30.86 respectively, the temperatures on these days are indicated to be 1.6 K and 4 K respectively based on the ionization balance models discussed earlier ( Jordan 1969; Shull and van Steenberg, 1982; Landini and Monsignori Fossi, 1972). These temperatures may be compared with those derived from X-ray observations on nearby dates. Nelson et al. (2008) obtain a value of 6.3 K on 11-12 March 2006 (day 27.7 after outburst; Table 4 of Nelson et al. 2008). This is reasonably in agreement with the temperature of 1.6 K that we obtain on March 16.95. Ness et al. (2007) determine a temperature range of (6.3 - 8.3) K on day 39.7 after outburst (24 March 2006) while we get a value of 4 K on March 30.86. Here too, the temperature estimates are in reasonable agreement with each other.
In the case of RS Oph, a complication that arises in applying models for the fractional ion abundance, based on purely collisional effects, is that the effect of any radiation field is assumed to be negligible. X-ray spectra in the initial stages after outburst clearly indicate that the plasma in RS Oph is collisionally dominated (Nelson et al. 2008). However, these authors observe a super soft x-ray phase in RS Oph during weeks 6-10 arising from the hot central white dwarf (WD) whose temperature was estimated to be 800,000K. The radiation field from the central WD could thus be expected to affect the ionization balance in the ejecta. We consider it a difficult problem, beyond the scope of this work, to assess the extent to which the WD radiation field - in conjunction with collisional ionization - affects the ionization balance. We, however, note that our analysis/discussion on the [Mn XIV] line is unlikely to be affected by the super soft x-ray phase since this phase began towards the end of March (Nelson et al. 2008) after the [Mn XIV] line had peaked in intensity. However, the [Si VI] line emission, could be affected to some extent by the super-soft X-ray phase.
| Date of | Days after | Line flux ( x 10-14 W m-2) | |
|---|---|---|---|
| Observation | outburst | [Si VI] | [Mn XIV] |
| Mar. 2.9465 | 18.1165 | - | 0.445 0.045 |
| Mar. 16.9465 | 32.1165 | - | 1.105 0.195 |
| Mar. 18.9372 | 34.1072 | - | 0.790 0.110 |
| Mar. 19.8833 | 35.0533 | - | 0.730 0.100 |
| Mar. 22.8682 | 38.0382 | - | 0.635 0.115 |
| Mar. 26.8778 | 42.0478 | 1.350 0.160 | 0.450 0.040 |
| Mar. 27.8644 | 43.0344 | 2.235 0.065 | 0.365 0.045 |
| Mar. 29.8462 | 45.0162 | 2.540 0.240 | 0.430 0.070 |
| Mar. 30.8629 | 46.0329 | 3.500 0.320 | 0.435 0.125 |
| Mar. 31.8701 | 47.0401 | 3.070 0.430 | 0.265 0.025 |
| Apr. 2.8736 | 49.0436 | 2.615 0.255 | 0.345 0.065 |
| Apr. 3.9691 | 50.1391 | 2.430 0.280 | 0.355 0.035 |
| Apr. 5.9607 | 52.1307 | 2.270 0.110 | 0.340 0.030 |
| Apr. 12.8454 | 59.0154 | 1.560 0.090 | 0.300 0.070 |
| Apr. 22.9392 | 69.1092 | 1.475 0.275 | 0.360 0.100 |
| Apr. 29.8355 | 76.0055 | 1.360 0.050 | 0.255 0.065 |
| May 3.8100 | 79.9800 | 1.235 0.165 | 0.225 0.085 |
| May 11.8353 | 88.0053 | 0.785 0.075 | 0.118 0.043 |
| May 17.8103 | 93.9803 | 0.705 0.135 | 0.117 0.023 |
4 Summary
and band photometry and spectroscopy of the 2006 outburst of RS Ophiuchi are presented. This work, in conjunction with the band observations presented earlier in Das et al. (2006), documents the near-IR evolution of RS Oph in a detailed manner. An extensive set of spectra have been presented and an analysis and discussion has been made of the emission lines seen therein (HI Paschen and Brackett recombination lines, coronal lines, Fe II lines etc.). The Fe II lines at 1.6872 and 1.7414 m, rather uncommon in novae, have been studied in some details. They appear to arise from a combination of Lyman alpha plus Lyman continuum fluorescence and collisional excitation. The site of origin of the near-IR line emission is explored based on the analysis of the Fe II lines and Case B recombination studies. An analysis is made of the temporal evolution of the [Si VI] 1.9641 m coronal line and another coronal line at 2.0894 m which is attributed to [Mn XIV]. Assuming collisional effects to dominate in the hot coronal gas, we estimate the coronal temperature to be 1.6 K and 4 K on 2006 March 16.95 and March 30.86 respectively.
Acknowledgments
The research work at Physical Research Laboratory is funded by the Department of Space, Government of India. We are thankful for the online availability of the Kurucz atomic linelist database which was extensively used in this work. We thank the referee, Prof. Aneurin Evans, for his suggestions which greatly helped in improving the results presented here.
References
- [\citeauthoryearAshok2006] Ashok N. M., Banerjee D. P. K., Varricatt W. P., Kamath U. S., 2006, MNRAS, 368, 592
- [\citeauthoryearBanerjee2001] Banerjee D. P. K., Janardhan, P., Ashok, N. M., 2001, AA, 380, L13
- [\citeauthoryearBautista2004] Bautista M. A., Rudy R. J., Venturini C. C., 2004, ApJ, 604, L129
- [\citeauthoryearBode2006] Bode M. F. et al., 2006, ApJ, 652, 629
- [\citeauthoryearBode2007] Bode M. F., Harman D. J., O’Brien T. J., Bond H. E., Starrfield S., Darnley M. J., Evans A., Eyres S. P. S., 2007, ApJ, 665, L63
- [\citeauthoryearBrandi2009] Brandi E., Quiroga C., Mikolajewska J., Ferrer O. E., García L. G., 2009, AA, 497, 815
- [\citeauthoryearBuil2006] Buil C., 2006, CBET, 403
- [\citeauthoryearChesneau2007] Chesneau O. et al., 2007, AA, 464, 119
- [\citeauthoryearDas2006] Das R.K., Banerjee D.P.K., Ashok N.M., 2006, ApJ, 653, L141
- [\citeauthoryearDas2008] Das R.K., Banerjee D.P.K., Ashok N.M., Chesneau, O., 2008, MNRAS, 391, 1874
- [\citeauthoryearEvans1988] Evans A., Callus C. M., Albinson J. S., Whitelock P. A., Glass I. S., Carter B., Roberts G., 1988, MNRAS, 234, 755
- [\citeauthoryearEvans2007a] Evans A. et al., 2007a, MNRAS, 374, L1
- [\citeauthoryearEvans2007b] Evans A. et al., 2007b, ApJ, 671, L157
- [\citeauthoryearFekel2000] Fekel F.C., Joyce R.R., Hinkle K.H., Skrutsie M.F., 2000, AJ, 119, 1375
- [\citeauthoryearFuji2006] Fujii M., 2006, IAU Circ. 8869
- [\citeauthoryearGorbatski1972] Gorbatski V. G., 1972, Soviet Astronomy, 16, 32
- [\citeauthoryearHirosawa2006] Hirosawa K., 2006, IAU Circ. 8671
- [\citeauthoryearHamann1989] Hamann F., Persson S. E., 1989, ApJS, 71, 931
- [\citeauthoryearHamann1994] Hamann F., Simon M., Carr J. S., Prato L., 1994, ApJ, 436, 292
- [\citeauthoryearHarman2008] Harman D. J. et al., 2009, ASPC, 401, 246,
- [\citeauthoryearIijima2006] Iijima T., 2006, IAU Circ. 8675
- [\citeauthoryearJohanson1977b] Johansson S., 1977, MNRAS, 178, 17
- [\citeauthoryearJohanson1984] Johansson S., Jordan C., 1984, MNRAS, 210, 239
- [\citeauthoryearJordan1969] Jordan C., 1969, MNRAS, 142, 501
- [\citeauthoryearKantharia2007] Kantharia N. G., Anupama G. C., Prabhu T. P., Ramya S., Bode M. F., Eyres S. P. S., O’Brien T. J., 2007, ApJ, 667, L171
- [\citeauthoryearLandini1972] Landini M., Monsignori Fossi B. C., 1972, AAS, 7, 291
- [\citeauthoryearLynch2000] Lynch D. K., Rudy R. J., Mazuk S., Puetter R. C., 2000, ApJ, 541, 791
- [\citeauthoryearLynch2004] Lynch D. K., Wilson J. C., Rudy R. J., Venturini C., Mazuk S., Miller N.A., Puetter R. C., 2004, AJ, 127, 1089
- [\citeauthoryearMarshall2006] Marshall, D. J., Robin, A. C., Reyle, C., Schultheis, M., Picaud, S. 2006, AA, 453, 635
- [\citeauthoryearMonnier2006] Monnier J.D. et al., 2006, ApJ, 647, L127
- [\citeauthoryearNelson2008] Nelson T., Orio M., Cassinelli J. P., Still M., Leibowitz E., Mucciarelli P., 2008, ApJ, 673, 1067
- [\citeauthoryearNess2007] Ness J. U. et al., 2007, Ap.J, 665, 1334
- [\citeauthoryearNess2008] Ness J. U. et al., 2009, AJ, 137, 3414
- [\citeauthoryearO’Brien1992] O’Brien T. J., Bode, M. F., Kahn, F. D., 1992, MNRAS, 255, 683
- [\citeauthoryearO’Brien2006] O’Brien T. J., et al., 2006, Nature, 442, 279
- [\citeauthoryearRodriguez-Andila2002] Rodriguez-Ardila A., Viegas S. S., Pastoriza M. G., Prato L., 2002, ApJ, 565, 140
- [\citeauthoryearRosino,Iijima1987] Rosino L., Iijima T., 1987, in ”RS Ophiuchi and the recurrent nova phenomenon”, ed M. F. Bode, VNU Science press, Utrecht, p. 27
- [\citeauthoryearRudy1991] Rudy R. J., Rosano G.S., Puetter R. C., 1991, ApJ, 383, 344
- [\citeauthoryearRudy2000a] Rudy R. J., Puetter R. C., Mazuk S., Hamann, F., 2000, ApJ, 539, 166
- [\citeauthoryearRudy2001] Rudy R. J., Lynch D. K., Mazuk S., Venturini C. C., Puetter R. C., 2001, PASP, 113, 916
- [\citeauthoryearRudy2002] Rudy R. J., Lynch D. K., Mazuk S., Venturini C. C., Puetter R. C., Perry R. B., 2002, BAAS, 34, 1162
- [\citeauthoryearRudy2003] Rudy R. J., Dimpfl W. L., Lynch D. K., Mazuk S., Venturini C. C., Wilson J. C., Puetter R. C., Perry R. B., 2003, ApJ, 596, 1229
- [\citeauthoryearRupen2008] Rupen M. P., Mioduszewski A. J., Sokoloski J. L., 2008, ApJ, 688, 559
- [\citeauthoryearShull1982] Shull J. M., van Steenberg M., 1982, ApJS, 48, 95
- [\citeauthoryearSkopal2006] Skopal A., Pribulla T., Buil C., Vittone A., Errico L., 2009, ASPC, 401, 227
- [\citeauthoryearSnijders1987] Snijders T., 1987, in ”RS Ophiuchi and the recurrent nova phenomenon”, ed M. F. Bode, VNU Science press, Utrecht, p. 51
- [\citeauthoryearSokoloski2006] Sokoloski J.L., Luna G.J.M., Mukai K., Kenyon S.J., 2006, Nature, 442, 276
- [\citeauthoryearStorey,Hummer1995] Storey P. J., Hummer D. G., 1995, MNRAS, 292, 41
- [\citeauthoryearVaytet2007] Vaytet N. M. H., O’Brien T. J., Bode, M. F., 2007, ApJ, 665, 654
- [\citeauthoryearWagner1996] Wagner R. M., Depoy D. L., 1996, ApJ, 467, 860
- [\citeauthoryearWhitelock1984] Whitelock P. A., Carter B. S., Feast M. W., Glass I. S., Laney D., Menzies J. W., Walsh J., Williams P. M., 1984, MNRAS, 211, 421
- [\citeauthoryearWorters2008] Worters H L., Eyres S. P. S., Bromage G. E., Osborne J. P., 2007, MNRAS, 379, 1557