Strong cooperativity and inhibitory effects in DNA multi-looping processes
Abstract
We show the existence of a high interrelation between the different loops that may appear in a DNA segment. Conformational changes in a chain segment caused by the formation of a particular loop may either promote or prevent the appearance of another. The underlying loop selection mechanism is analyzed by means of a Hamiltonian model from which the looping free energy and the corresponding repression level can be computed. We show significant differences between the probability of single and multiple loop formation. The consequences that these collective effects might have on gene regulation processes are outlined.
pacs:
87.14.Gg, 05.50.+q, 87.15.akLoop formation in DNA complexes has been identified as a fundamental mechanism in gene regulation processes switch ; data1 ; data2 ; widom ; vilar2 . Operators for DNA-protein interaction modify their relative positions through the formation of loops and thereby may operate even if they are not physically close together. This mechanical process is governed by the physical properties of the DNA and the concentration of proteins and has a deep impact on gene synthesis processes. The fixation of operators combined with protein concentrations is responsible for control processes inside the cell.
Elastic models have been proposed for the study of the physical properties of the DNA chain and the emerging phenomena like cyclisation and looping metzler ; purohit , and are the basis for large scale simulations of protein complexes villa . Within this approach, the elasticity of the bonds between the nucleotid bases determine the physical properties of DNA through its degrees of freedom. An important step toward the understanding of looping phenomena within a physical context was given in vilarPRL , where the effect of protein concentration was related to multiprotein bonding positions. An induced phase transition to the loop phase is controlled by the protein concentration. Following this physical analysis, a model of loop formation has been proposed using ideas from statistical mechanics which provides a clear picture of the connection between the protein concentrations, the free energy involved in loop formation vilar2 and protein binding, as well as the structure of the DNA. The transition between the loop formation phase was reported for the case of a single loop and multiple proteins.
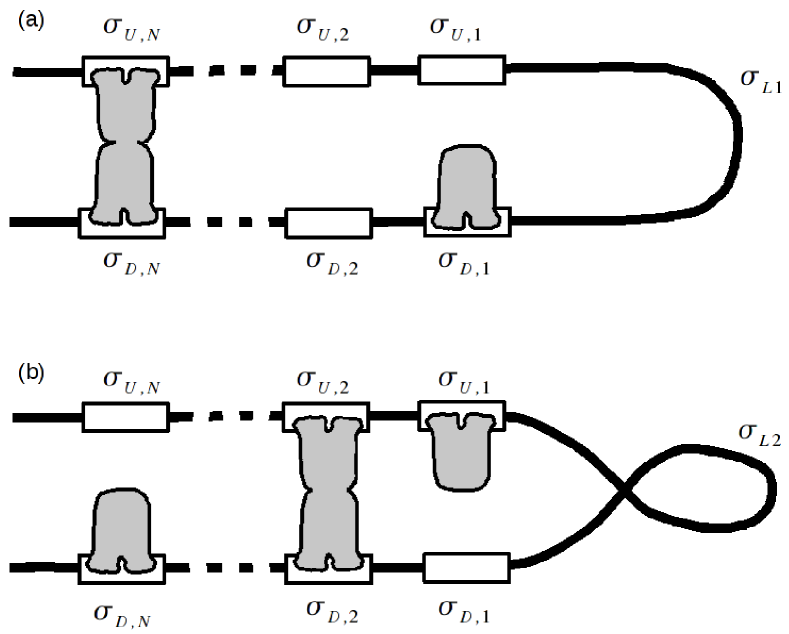
In this Letter, we show that the loop selection process is the result of a strong competition between the different types of loops that can be formed in the same DNA fragment. These loops may appear in DNA segments with several binding configurations, but also in single loop configurations with the possibility of different spatial dispositions of the looped segment gelles . Loop formation entails changes in the structure of the DNA chain which allow distal operators to come into range of a binding protein (see Fig.1). However, in a scenario where multiple loops may appear, these conformational changes can hamper or even promote additional loop creation once the appearance of a loop has modified the conditions necessary for the formation of additional loops. The possibility of formation of multiple loops becomes manifest through an effective interaction between loops that may for instance affect their size markoPRL .
We focus on the formation of competing types of loops in a segment of DNA assuming that only one loop may be present at the same time in the segment. The conditions necessary for the formation of a loop are either geometrical, where the required operators have been set in positions that are incompatible with additional loop formation, or energetic, where the energy to form another loop is not strong enough to undo an existing loop. In general, the most energetically favorable loops will be dominant; however, other loops may also emerge due to the interaction of the proteins binded to the chain during loop formation. As a result, a conformational interaction is induced between potential loops.
Loop formation due to the binding of multiple proteins can be put in a statistical mechanics language by means of a Hamiltonian model which reflects the successive steps intervening in the process vilarPRL . In a DNA segment with binding positions with different loops, the corresponding Hamiltonian can be written as
| (1) | |||||
Here the set of binary variables (=0,1) accounts for the formation of a type loop, and the variables and indicate the binding of a protein monomer at the corresponding position (see Fig.1). The contributions to the free energy for the formation of a loop are introduced through the coefficients (which are independent of the chain length), while the coefficients on the other hand, multiply the number of dimers contributing to loop formation which can be a function of the chain length. Different types of loops may carry different values of and . The coefficients and are associated to the contributions of binding a monomer to the chain. Throughout this work we set , where the protein concentration is introduced in the Hamiltonian, and the binding contribution is site independent.
Two-loop interaction- We focus our analysis on the case which shows the basic features of loop interactions. An additional study of cases with has revealed the absence of important differences in the loop selection mechanism. Changes in the chain due to the formation of a loop modify the conditions under which another potential configuration of a looped phase may emerge. This situation can be found in short chains where the deformation of the DNA after the formation of a loop alters the distance and possible contact between distal monomers. We then envisage a scenario where loops of different free energies of formation compete. Once one of the loops is formed, there is no room for others. This restriction can be mathematically expressed as
| (2) |
By using Montecarlo methods, the probabilities and can be computed from the resulting equilibrium states. Analytical results can be obtained for the single-loop scenario, and are used as a reference for the multiple-loop results shown here. The protein concentration is the order parameter which describes the transition between the looped/unlooped phases vilarPRL of the different . To analyze this transition, we deal with body interactions corresponding to the interaction of two operator sites to form one loop and the restriction imposed over the loops. Adding the restriction Eq.2, we study the values and for a chain with two possible loops with different free energy contributions.
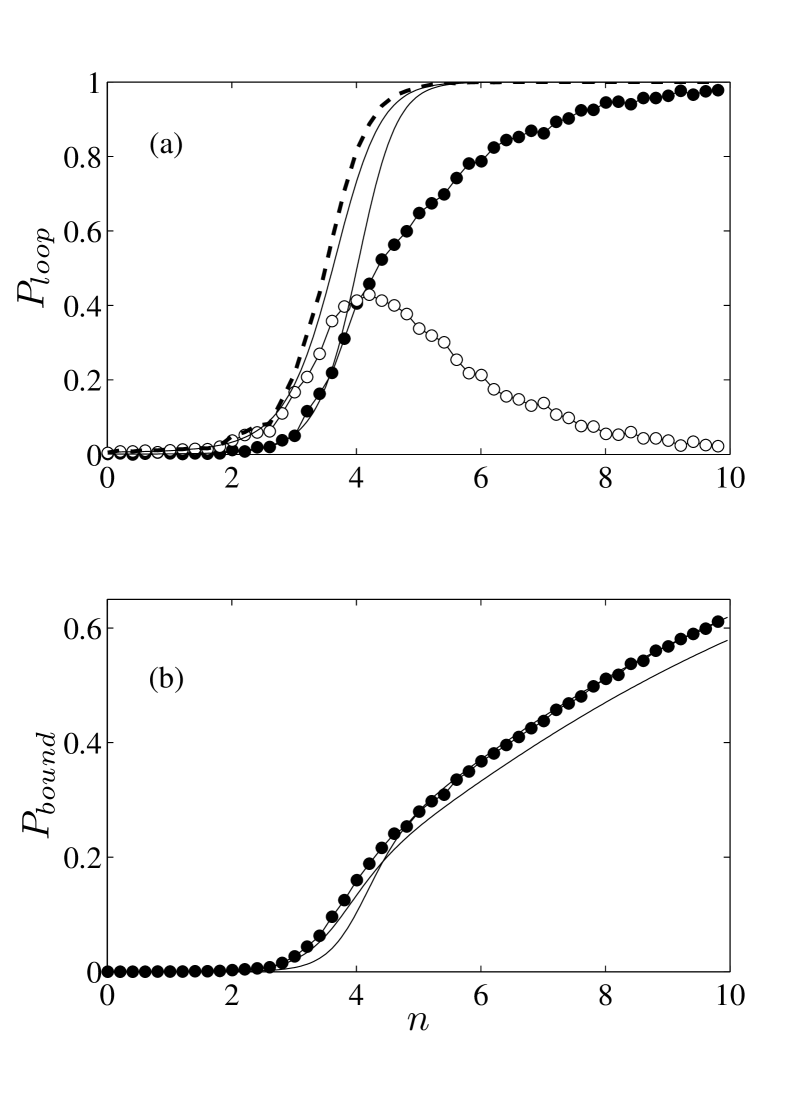
We start by studying the formation of two loops and in a chain with , kcal/mol, kcal/mol, kcal/mol and kcal/mol. We set kcal/mol and kcal/mol in all our computations. In Fig.2, we show the results for the probabilities of loop formation (top) and the probability of binding a monomer (bottom). The solid lines represent the expected values of the probability of single-loop formation in the absence of interaction, taken from vilarPRL . The formation of multiple loops can be analyzed similarly through that of a single-loop with an effective interaction. The marks show the corresponding results of the Montecarlo simulation.
Under these conditions, one of the two loops appears only in a small range of the protein concentration . Thus, the activity of the cell processes associated with the formation of this loop is restricted to this range of concentrations, making induced loop interaction a mechanism for gene control inside the cell. This behavior is produced by the two different contributions to the free energy of the loop formation, given through the term , independent of the chain size, and the term which depends on the number of protein dimers present in the chain. This contribution depends on the protein concentration inside the cell, becoming greater for higher values of . Thus, a loop may become dominant at low due to a dominant constant contribution . By increasing the protein concentration, the free energy contribution of term becomes dominant due to the formation and binding of more dimers contributing to loop formation. This mechanism changes the corresponding loop probability of the different types of loops (see Fig.2(a)). The binding probability of the monomers gets contributions from the two forming loops, thus becoming the basic mechanism behind loop interaction. In Fig.2(b), is equal to that of the dominant loop for high , while for , it receives contributions from the two loops.
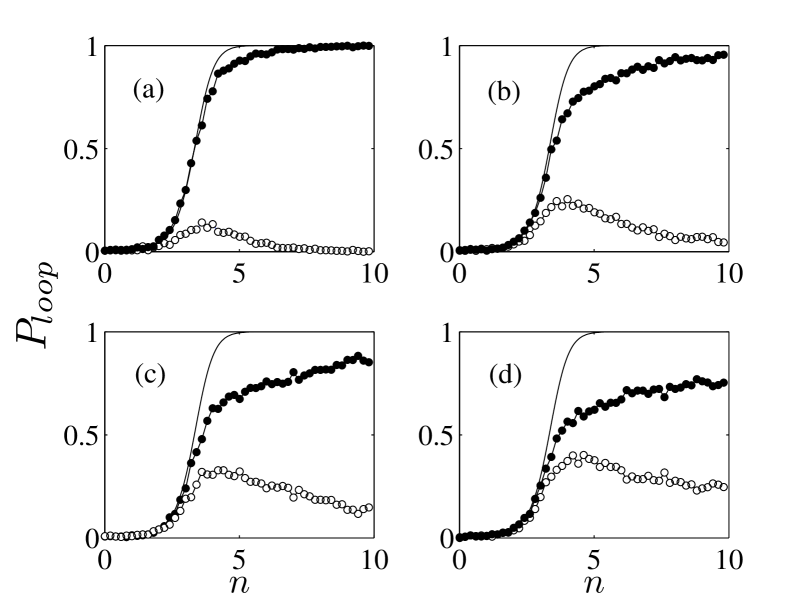
We have extended the interaction study to a range of values of and for which the coexisting loop picture goes from an equiprobable disposition of both loops (fixing ) to a situation where one of the loops dominates. For , with increasing , we identify the transition region where the probability is zero for high protein concentrations. The results are shown in Fig.3. This transition depends nontrivially on the respective values of and and the protein concentration and shows a progressive inhibition of formation for increasing . The formation is restricted to a progressively narrow range of values of , making this mechanism a way to activate some cell processes for very particular protein concentrations. As explained above, this fact is a consequence of the dimer formation that contributes to the formation of the loop. The dimer concentration increases with which can be interpreted as the contribution to the free energy of the dimer formation.
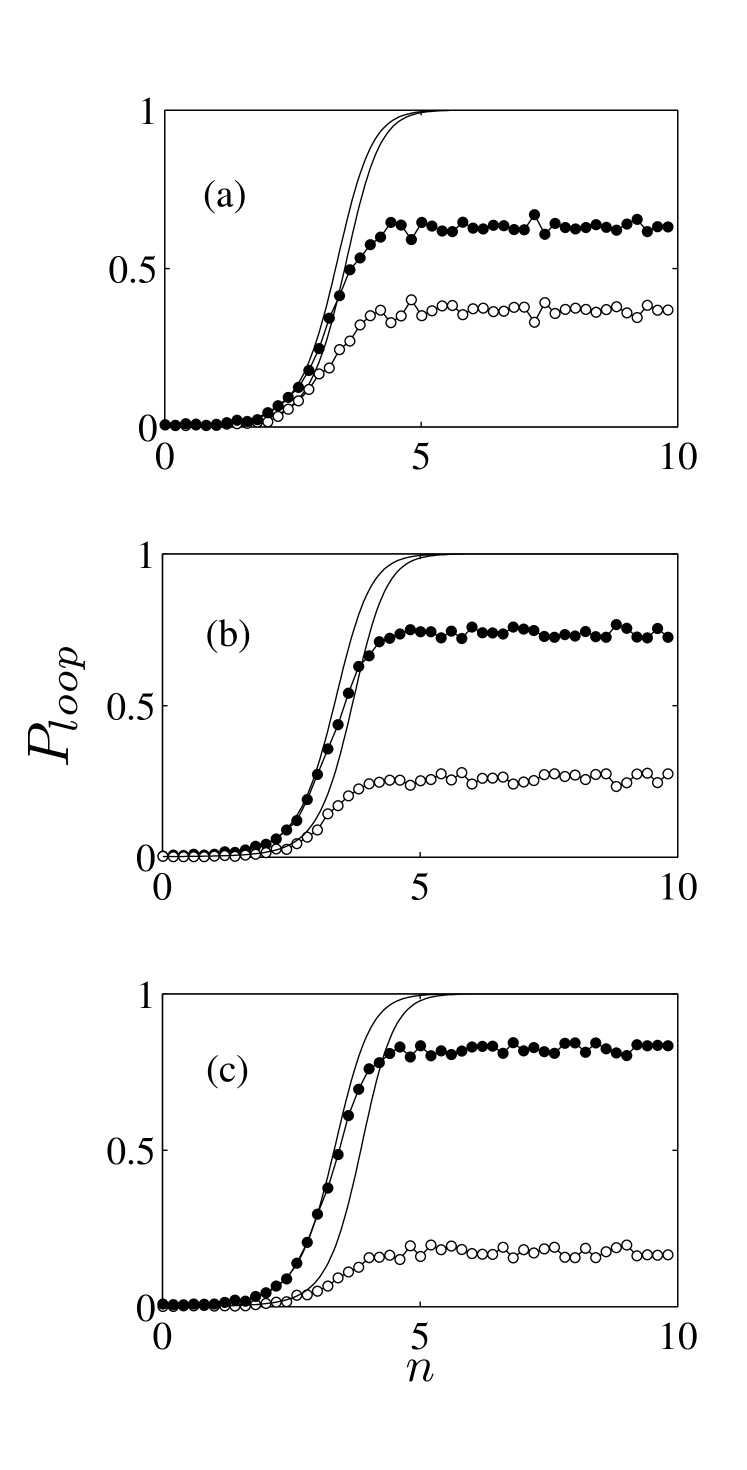
We will now analyze the case of two loops with and . The transition in this case is driven by a constant contribution to the Hamiltonian independent of . In Fig.4, we show for different values of . As expected, for high values of there is no variation in after the transition, resulting in the same relative probabilities for the two loops at different protein concentrations. This behavior is of a completely different nature from that shown in Fig.3 and can be interpreted as the contribution of the different structures of DNA to the free energy. This situation may appear in loops with different potential physical dispositions, with different values of , but formed in equivalent conditions of dimer bonding.
Repression level- We have computed the probabilities of two types of loops and in a single DNA chain. In physiological conditions where the looped phase is associated with the repression of a gene (i.e. the lac operon in E.coli lac ), an effective looped phase probability can be computed. Under some conditions this probability is higher than the respective probabilities in the single-loop case (see Fig.2(a)): and . The probability of a sate is determined by its standard free energy through , normalized by the probabilities of all the possible configurations. Thus the effective free energy of the looped phase satisfies
| (3) |
where and are the corresponding free energies of the looped phases and .
The contributions to the free energy of the DNA molecule can be identified with the repression levels vilar-leibler ; rpnas . The free energy of the DNA molecule can be computed from the different contributions of binding and loop formation. Hence we can connect this physical interpretation with the experimental measurements of the repression levels. Taking into consideration the lac repression mechanism, the repression level with a single looped phase is given by rpnas
| (4) |
The repression level in loop interaction conditions , considering the effective loop free energy contribution and Eq.(3), satisfies
| (5) |
The repression of transcription induced by the loop formation, in situations where multiple loop formation can appear, is affected by the corresponding conditions of protein concentrations and loop properties. Repression levels in the single-loop scenario have been reported in data1 ; data2 .
Conclusions- We have shown the presence of strong correlations between the different loops that can be formed in a given DNA segment. Geometrical changes in the chain, caused by the formation of a loop, can alter the conditions under which another loop may come up, thereby implying modifications of the loop formation probability and consequently of their statistical properties. These correlations can give rise to cooperative effects for which loops may appear under otherwise forbidden conditions and to inhibitory effects hampering the loop formation under apparently favorable conditions. The loop interrelation effect can be quantified through an effective free energy which can be computed from a Hamiltonian that incorporates all the energies coming into play in the process. These collective effects can be adapted to a wide combination of physical conditions inside the cell, where small changes of the protein concentrations can dramatically alter the cellular processes controlling the repression level. The implications that loop collective effects may have in gene regulation processes can then be studied from measurable quantities establishing a clear connection between the repression level and the possible loop configurations in a fragment of DNA.
References
- (1) M. Ptashne, A Genetic Switch: Phage revisited, Cold Spring Harbor Laboratory (2004).
- (2) J. Müller, S. Oehler and B. Müller-Hill, J. Mol. Biol. 257, 21-29 (1996).
- (3) N.A. Becker, J.D. Kahn and L. James Maher III, J. Mol. Biol. 349, 716-730 (2005).
- (4) T.E. Cloutier and J. Widom, Molecular Cell 14, 355-362 (2004).
- (5) J.M.G. Vilar and L. Saiz, Current Opinion in Genetics and Development 15, 136-144 (2005).
- (6) R. Metzler, T. Ambjornsson, A. Hanke, Y. Zhang and S. Levene, J. Comput. Theoret. Nanoscience 4, 1 (2007).
- (7) P. K. Purohit and P. C. Nelson, Phys. Rev. E 74, 061907 (2006).
- (8) E. Villa, A. Balaeff and K. Schulten, PNAS 102, 6783-6788 (2005).
- (9) J.M.G. Vilar and L. Saiz, Phys. Rev. Lett. 96, 238103 (2006).
- (10) O.K. Wong, M. Guthold, D.A. Erie and J. Gelles, PLos Biol 6(9):e232 (2008).
- (11) S. Sankararaman and J.F. Marko, Phys. Rev. Lett. 95, 078104 (2005).
- (12) B. Müller-Hill, The lac Operon: A Short History of a Genetic Paradigm, Walter de Gruyter, Berlin (1996).
- (13) J. M. G. Vilar and S. Leibler, J. Mol. Biol. 331, 981-989 (2003).
- (14) L. Saiz, J.M. Rubi and J.M.G. Vilar, PNAS 102, 17642-17645 (2005).