Shock fronts in the symbiotic system BI Crucis
Abstract
We investigate the symbiotic star BI Crucis through a comprehensive and self-consistent analysis of the spectra emitted in three different epochs: 60’s, 70’s, and late 80’s. In particular, we would like to find out the physical conditions in the shocked nebula and in the dust shells, as well as their location within the symbiotic system, by exploiting both photometric and spectroscopic data from radio to UV. We suggest a model which, on the basis of optical imaging, emission line ratios and spectral energy distribution profile, is able to account for collision of the winds, formation of lobes and jets by accretion onto the WD, as well as for the interaction of the blast wave from a past, unrecorded outburst with the ISM. We have found that the spectra observed throughout the years show the marks of the different processes at work within BI Cru, perhaps signatures of a post-outburst evolution. We then call for new infrared and millimeter observations, potentially able to resolve the inner structure of the symbiotic nebula.
keywords:
binaries: symbiotic - stars: individual: BI Cru1 Introduction
BI Crucis (BICru) is a dusty (D-type) symbiotic system (SS) (Kenyon et al. 1986) which hosts an early Mira whose pulsation period is 280d (Whitelock et al. 1983), and a hot star of 26500 K (Rossi et al. 1988, hereafter R88). With respect to other dusty SSs, BI Cru shows a less strong IR excess which can be attributed to thermal emission of relatively cool dust (Angeloni et al. 2007a).
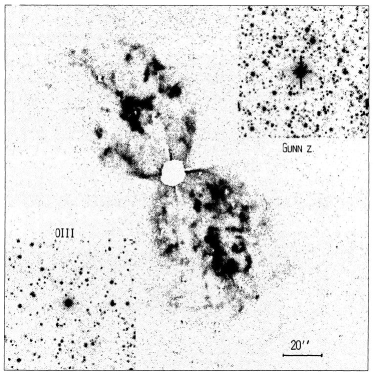
The discovery of an associated bipolar nebula with a total extent of 1.3pc (Fig. 1) by Schwarz & Corradi (1992, hereafter SC92), pointed out a strong morphological similarity between BI Cru and He2-104, the Southern Crab. However, the BI Cru nebula seems to have a dynamical age of 3000 yrs, being thus at a slightly different evolutionary age with respect to the He2-104 one (Corradi & Schwarz1993, hereafter CS93).
Previous studies by Morris (1987) proposed a binary model for the formation of bipolar planetary nebulae via variable accretion rates onto the WD. Jets and fast winds would be thus naturally created, but for a meaningful modelling of BI Cru at least two other elements should be taken into account, namely, the bipolar nebula expands at as high velocities as the jets (200 , CS93), and there are hints of multiple events, such as periodic (every 1000 yr, CS93) hydrogen shell flashes that may have occurred on the WD surface.
Bipolar jets and lobes suggest the presence of an accretion disk, whose formation may be plausible assuming a typical accretion rate of 10-7 M⊙ yr-1 (Morris 1987). CS93 suggest that the fast winds from the hot star are produced by thermonuclear runaways on the surface of the WD. Disk instabilities are less indicated because stable hydrogen burning occurs only in a very little range of accretion rates, which would constrain the binary parameters.
Previous modelling of SSs in different phases of outburst and quiescence (Contini et al. 2009a, Angeloni et al 2007a, and references therein) led to recognize some main dynamical mechanisms, that can be summarized by: the collision of the stellar winds which leads to shocked nebulae at different location on the orbital plane, the formation of a disk as a consequence of accretion phenomena, the ejection of jets and lobes perpendicularly to the orbital plane, and the outburst of the WD, at the origin of the blast wave propagation outwards in the ISM. Furthermore, also the dust shells emitted by the Mira contribute to the line and continuum spectra and might be responsible for obscuration episodes.
In this paper, we investigate the origin of the emission fluxes at different epochs. analyzing the spectral and morphological appearance of BI Cru. On the basis of the observational and theoretical evidences described previously, we will account for episodes of wind collisions, ejection of lobes and jets due to the accretion processes, and expansion of the blast wave in the surrounding medium as a consequence of past outbursts of the WD.
Quantitative informations can be derived only by modelling the 1962 spectrum presented by Henize & Carlson (1980, hereafter HC80), which provides intensities and velocities of several observed lines. Further, important informations can be obtained by the observation of the broad H line reported by Whitelock et al. (1983) and by the polarization of its wings discussed by Harries (1996). Eventually, some upper and/or lower limits to the physical parameters derived from the spatial distribution of some important emission lines (e.g. [OII], [OIII]) were found by SC92.
We adopt the models presented for He2-104 and for R Aqr by Contini & Formiggini (2001 and 2003, respectively). There, the winds from the WD and the red giant star collide head-on between the stars and head-on-back outward the binary system, leading to a network of shock fronts in the equatorial plane of the binary system (Girard & Willson 1987). Moreover, the jets from the accretion disk, colliding with the circumstellar matter, give origin to the bipolar nebula in the perpendicular direction (Contini & Formiggini 2003). In fact, the jet velocity and the velocities observed in the bipolar nebula are similar ( 200-250 ).
The modelling of line and continuum spectra makes use of SUMA111http://wise-obs.tau.ac.il/marcel/suma/index.htm, a code that simulates the physical conditions of an emitting gaseous nebula under the coupled effect of photoionization from an external source and shocks. The important role of dust is investigated following Angeloni et al. (2007a,b,c).
The observations of BI Cru at different epochs are presented in Sect. 2. The 1962 spectra are analyzed in Sect. 3, the broad H line is extensively discussed in Sect. 4, and the bipolar lobes are modelled in Sect. 5. The continuum spectral energy distribution (SED), calculated consistently with the line spectra, is compared with the data in Sect. 6. Discussion and concluding remarks follow in Sect. 7.
2 Observational data
SSs are rarely observed with a clear long-term strategy through the years. For most objects, the data from the literature are either the result of specific observations or belong to large surveys of those generally said ”peculiar emission-line stars” such as PNe, Novae, CVs, etc. Unfortunately, this is also the case of BI Cru, since its discovery on Michigan-Mount Wilson Southern H Survey plates in 1949. In the following, we summarize the data we have exploited in order to constrain our physical interpretation of this SS.

2.1 Photometric data
Besides the two upper limits (namely, missed detections) reported in Purton et al. (1982), the only information we have about the radio-mm wavelength range in BI Cru comes from the survey by Ivison et al. (1995 - Fig. 2, bottom panel). Unfortunately, this implies that there is no way to investigate any radio variability, which may be expected according to its specific nature of SS.
With regards to the IR photometric data, it is worth mentioning that there is a reasonable agreement between observations taken at different times (Fig. 2, top panel). This means that our discussion of the continuum SED is not invalidated by the well known IR variability mainly ascribed to the Mira pulsations. The data come from the IRAS Point Source Catalog (the 60 m point being actually an upper limit) and the Midcourse Space Experiment Point Source Catalog (Version 2.3, Egan et al. 2003) for the longer wavelengths, and from Munari et al. (1992) and the 2MASS survey for the NIR range.
2.2 Spectroscopic data
The absence of a long-term strategy in observing BI Cru has not prevented to recognize an
intrinsic variability of both emission and absorption lines since the late ’40s.
In particular, variations in H intensity were suspected already by
HC80, which pointed out that the line was stronger in 1950-51 than in 1949.
Moreover, they reported on a Mount Stromlo slit spectrogram obtained in 1962 which
shows an emission line spectrum of relatively high excitation, superposed on a weak bluish
continuum (HC80, Table 1).
In the 70’s, Lee (1973) noticed on a spectrum taken in 1968 the presence of strong unusual emission features, probably due to FeII, as well as a very strong H , and a moderately strong H. Allen (1974), on the other hand, recorded more than 40 lines of FeII, [FeII], weak lines of HeI, and also suspected [OI], in addition to Balmer emission lines. Interestingly, he found rather broad emission lines and a weak violet component to H displaced from the principal line by several hundred .
In any case, the most remarkable difference between the 1962 and 1974 spectra is the presence of [OIII], [NeIII], and [SII] with different FWHM in 1962, and their absence in 1974 (HC80).
In the 80’s, Whitelock et al. (1983) presented some infrared photometry, from which they deduced the evidence of a possible secular decrease in intensity between 1979 and 1982, as well as new optical spectra taken in 1974 just 55 days before the Allen’s spectrum. In these spectra, surprisingly, a strong H emission was evident showing blue displaced P Cyg absorption and extensive emission wings with FWHM of 1500-2000 , and FeII lines with a P Cyg profile where the E-A radial velocity difference was of 145 .
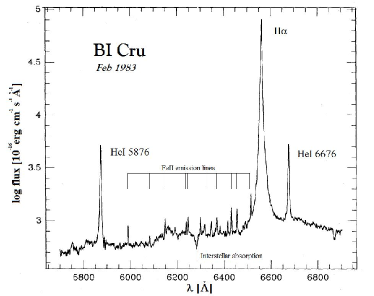
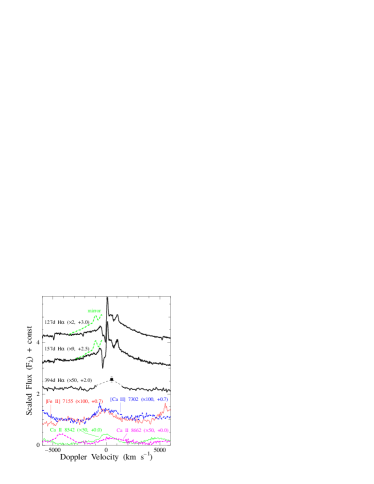
A few years later, R88 analyzed a spectrum taken in 1983 with the 1.5m ESO telescope at La Silla. Strong H emission and prominent HeI lines confirmed that BI Cru was in a fairly high ionization stage. Several FeII emission lines were also present (Fig. 3). The spectrum observed by R88 shows strong H and blend of FeII. R88 calculated a minimum black body (bb) T=26500 K for the hot star and referred to two emission components in H of 110 and 350 , with a violet shifted absorption extending from 0 to -300 .
In the 90’s, SC92 finally reported the discovery of a bipolar nebula associated with BI Cru (Fig. 1), whose morphology and derived expansion velocity (420 ) immediately suggested an evolution similarity with He2-104, the ”Southern Crab”. The 1986 low resolution and 1988 high resolution spectra presented there and in the following papers (such as in CS93) pointed out significant optical-UV spectral changes between 1986 and 1987, on a time-scale 1 year. Since then, the link between SSs and bipolar planetary nebulae has become stronger, demonstrating the need of improved models to explain such complex sets of data.
3 The 1962 spectrum
We start by analyzing the spectrum presented by HC80 and taken on 14 June 1962. We focus mainly on the BI Cru emission lines in 1962, because there are too few forbidden lines in the 1983 spectrum reported by R88 to allow a reliable modelling of the nebulae.
In 1962, the complex and unusual spectrum includes HeII 4686 and blended NIII 4634,41,42, while [OII] is not visible. HeI 4043 and 4026 show absorptions and P Cyg profiles. These lines led HC80 to suggest that one component of the system possesses an expanding atmosphere with an improbably large velocity of 1940 , and to conclude that the forbidden lines may arise in a region apart from the one in which the permitted lines occur.
The analysis of the ion velocities shows three distinct velocity regimes: one at -55 represented only by HI, a second at -115 which includes HeI and FeII, and a third at about -180 which includes HeII and the forbidden lines. The individual velocities give an approximate mean error of 20 . Only the [OIII] 4959 line shows a velocity of 377 . In Table 1, the observed intensities corrected for reddening, and the FWHM are shown for the forbidden lines and He permitted lines.
Since the several emitting components recognizable in a symbiotic spectrum can be alternately visible or hidden from view depending on the different configuration with respect to the line of sight, as well as on the activity phase of the system, in the following we start identifying the emitting nebulae through their emission signatures. Then, we try to interpret the spectra on the basis of the orbital motion and of the activity status of BI Cru.
3.1 The colliding wind scenario
In the last years, several observational evidences have proved that compact hot stars loose mass through fast ( 1000 ), low-density wind. Regarding SSs, Nussbaumer et al. (1995) were the first that, by analyzing observations of a fast wind from the compact object, called for a symbiotic colliding-wind scenario.
The winds from the hot and the cool stars collide within and outside the system, hence creating a complex network of wakes and shock fronts that result in a complicated structure of gas and dust nebulae (Nussbaumer 2000). In the light of this scenario, one can consider that two main shock-fronts develop from the head-on collision of the winds between the stars. The binary colliding wind configuration discussed in some theoretical works, e.g. Girard & Willson (1987), Kenny & Taylor (2005), describes one strong shock-front facing the WD and the other, very weak, facing the cool giant. Similarly, in the extended circumbinary region, two shock fronts develop from the head-on-back collision of the winds: one expanding outwards and the second, virtually negligible, facing the system center. This latter shock network corresponds to the concentric colliding wind configuration of e.g. Kwok (1988a), which is a theoretical basis to the more realistic picture of shock fronts disrupted by instabilities.
Generally, we can figure out that for all shock waves there is an upstream region, where
the gas enters into the shock front, and a downstream region, on the opposite side.
The shock front discontinuity is very thin, the thinner the faster the shock velocity.
The gas entering the strong shock front is thermalized and a high temperature region appears
immediately behind the
discontinuity, in the downstream region. On the opposite side of the shock front, upstream,
the temperature of the
gas is slightly increased by precursor radiation from the hot slabs of the gas downstream
and by radiation from the WD, without reaching temperatures as high as those in
the immediate post-shock region, though. The gas recombines following a high cooling rate due to the
high pre-shock densities and to compression downstream.
The key parameter is obviously the shock velocity, . For high-velocity shocks, the very high temperature reached in the post-shock region leads to the X-ray emission observed in several SSs. Moreover, broad strong lines can also be observed along the whole electromagnetic spectrum, particularly the coronal lines in the infrared (e.g. Angeloni et al. 2007a): therefore, from the spectral point of view, different line profiles trace different velocity regimes, allowing to highlight the different physical conditions within a symbiotic system.
Also BI Cru shows the signatures of the colliding-winds, because the range of velocities observed in literature (Sect. 2.2) fits with both the head-on shock between the stars (”high-velocity” regime) and the expanding shock front outward the system (”low-velocity” regime), and cannot be reconciled with a single velocity model. For instance, the [OIII] 4959 line observed in the central system corresponds to 400 , while [NII] lines observed in the lobes display widths of 200 . Lower velocities ( 50 ) of optical-UV lines appear also in the 1962 spectra reported in HC80.
In the frame of colliding winds already exploited to interpret many others symbiotic spectra (Contini et al. 2009b and references therein), we schematically refer to the nebulae downstream of the main shock fronts: 1) the head-on shock between the stars facing the hot star (named hereafter reverse shock) and 2) the head-on-back shock propagating outward the system (hereafter expanding shock). Moreover, we also consider 3) the shock front accompanying the expansion of the lobes (Sect. 5). The nebula downstream of the reverse shock between the stars is thus characterized by photoionizing radiation and shocks acting on the same edges of the shocked nebula, while the models describing the expanding shock propagation outside the system are characterized by photoionization and shocks acting on opposite edges. For both the inverse and expanding shocks, the shock velocity is suggested by the FWHM of the line profiles, while the other physical conditions in the emitting region downstream are constrained by the observed line ratios.
The models must then account consistently for shocks and photoionization. This is one reason why the SUMA code is particularly suited for this kind of spectral analysis applied to SSs. The input parameters of the code are those relative to the shock: the pre-shock density , the shock velocity , the pre-shock magnetic field ; and those relative to photoionization: the hot star ionizing radiation flux, its color temperature , and the ionization parameter . The chemical abundances of He, C, N, O, Ne, Mg, Si, S, Ar and Fe, relative to H, the dust-to-gas ratio and the geometrical thickness of the nebulae , are also accounted for. Notice that is a lower limit in radiation-bound models. Dust reprocessed radiation and bremsstrahlung are consistently calculated throughout the nebulae, as well as the dust grain sputtering.
Specifically, the line and continuum fluxes downstream are calculated integrating throughout many plane-parallel slabs (up to 300) with different geometrical widths derived automatically from the temperature gradient. By the way, the plane-parallel geometry is necessary in the interbinary region where the collision of the winds is head-on. It is also valid in the circumbinary region where the radius of the expanding shock created by the head-on back interaction of the outflowing winds from the stars is large enough.
Furthermore, since the matter is highly inhomogeneous at the shock fronts because of instabilities at the nebula interface (e.g. the Rayleigh-Taylor (R-T), Kelvin-Helmholtz (K-H), Meshkov-Richtmyer (M-R) instabilities), different physical conditions should be accounted for, particularly regarding the density.
| line | Vel. | obsa | m1 | m2 | m3 | m4 | mav |
| [NeIII]3869+3896 | -152 | 0.17 | 0.26 | 0.004 | 0.154 | 0.06 | 0.113 |
| [SII] 4068+4077 | -174 | 0.03 | 0.001 | 0.0 | 0.3 | 0.008 | 0.02 |
| [OIII] 4363 | -189 | 0.09 | 0.11 | 0.001 | 0.15 | 0.09 | 0.06 |
| HeI 4471 | -79 | 0.17 | 0.048 | 0.11 | 0.89 | 0.05 | 0.13 |
| HeII 4686 | -227 | 0.13 | 0.0016 | 0.2 | 5.e-4 | 0.005 | 0.11 |
| [OIII] 5007+4959 | -480 | 0.33 | 0.6 | 0.043 | 1.6 | 0.44 | 0.35 |
| H b | - | - | 1.37e4 | 6.2e-3 | 0.086 | 1.0 | - |
| () | - | - | 190 | 150 | 70 | 400 | - |
| () | - | - | 2e5 | 1.6e3 | 3e4 | 1.e5 | - |
| (10-3 gauss) | - | - | 1 | 1 | 0.1 | 1 | - |
| U | - | - | 15 | 25 | - | 1 | - |
| typec | - | - | RDo | RDo | SD | RD | - |
| (1015 cm) | - | - | 1 | 1 | 5 | 0.1 | - |
| log w | - | - | -7.0 | -0.045 | -2.2 | -5 | - |
| Ne () | - | 1e6-1e7d | - | - | - | - | - |
| (K) | - | 5.5e4e | - | - | - | - | - |
3.2 Modelling the line spectrum
The modelling of a line spectrum is based on some basic points. The most significant are the following:
1) recombination lines (e.g. H , HeI, HeII) depend strongly on the temperature of the star and on the ionization parameter.
2) line ratios of a single element from the same ionization level but corresponding to a different quantum configuration depend on the physical conditions of the emitting gas (density, temperature, etc).
3) line ratios of single elements from different ionization stages depend on the ionization rates: radiative and/or collisional. The radiative ones are strong at temperatures 105 K, while the collisional ones are strong at high temperatures. Therefore collisional ionization rates are important when shocks are at work.
4) ratios of lines from different elements are strongly linked to the relative abundances.
For a spectrum with a rich number of lines, these rules act together and constrain the models. Generally, in SSs the spectra from different nebulae must be accounted for at the same time. The results will depend on the relative weights adopted to sum up single nebula spectra.
The spectrum from Bi Cru in 1962 shows the HeI and HeII line ratios to H which are examples of condition 1) and the [OIII] 5007+4959/[OIII]4363 ratio which refer to condition 2); however, lines from different levels refer to different elements leading to an uncertain modelling. Moreover, each line is characterized by a different FWHM, indicating that a pluri-nebula model must be adopted.
We have tried to complete the insufficient informations derived from the line ratios from the modelling of other SSs. For instance, the model with =400 is accompanied by a high preshock density ( 105 ) because located between the stars. R88 indicated a WD temperature of at least 26500 K , Bohigas et al. (1989) proposed a preshock magnetic field of 10-3 gauss in SSs similar to that of isolated giants. This value was confirmed e.g. in the CH Cyg system by Crocker et al. (2001) and Contini et al. (2009a). The nebula network throughout SSs is further complicated because each of the nebulae is characterized by relative abundances suiting either those of the WD atmosphere or those of the red giant (Contini 1997). We discuss the abundances in the following: in our first trial we have used solar abundances (Allen 1973).
3.3 The selected models
We have run a grid of models covering reasonable ranges of all the input parameters in order to find the best and most consistent fit of calculated to observed line ratios.
Four models are selected amongst the best fitting ones and are described in the bottom of Table 1. For each of them, = 26500 K and a dust to gas ratio = 4 10-4 by mass are adopted.
Models labeled with RDo indicate a radiation-dominated case where radiation flux and shock act on opposite edges of the nebula (expanding shock). Models labeled with RD deals with a radiation dominated case for which radiation flux and shock act on the same edge (reverse shock); the models labeled with SD are shock dominated (ionization parameter U=0).
The [OIII] 4959+5007 FWHM of 400 is accounted for by model m4. The other input parameters are purposely chosen in order to give a negligible contribution to the other lines which show narrow profiles. In the frame of the colliding wind picture, model m4 represents the reverse shock front between the stars which explain the ISO IR spectra of D-type SSs, so we adopt =105 (Angeloni et al. 2007a). Model m4 is radiation dominated and represents the shocked nebula downstream of the shock front facing the hot star.
The [OII]FWHM (200 ) indicate that a model with =200 should be adopted (model m1). To further constrain this model, we notice that such velocities are characteristic of the expanding shock. We adopt therefore preshock densities of 105 as, e.g., for CH Cyg (Contini et al 2009b).
Model m3 shows a very high HeI 4471/H ratio and a low , in agreement with the FWHM reported by HC80. Lower velocities ( 50-70 ) are suitable to the expanding shock front at a large distance from the stars, therefore, model m3 is characterized by U=0. Model m3 represents the shock dominated case, i.e. the ionization conditions throughout the nebula are dictated only by the shock, the flux being absorbed by some intervening matter (a dust shell?).
The geometrical thickness D are constrained by the dimensions of the system, while the other parameters (e.g. U) are chosen phenomenologically for all the models. Models m1, m3, and m4, which are dictated by the observations, either refer to a rather strong shock or are shock dominated, leading to HeI/HeII 10. The observations show HeI/HeII=1.3, suggesting that another nebula dominated by a strong photoionizing flux, should contribute to the averaged spectrum. Model m2 with U=25 produces a very high HeII/H line ratio.
The models are summed up adopting relative weights w which lead to the fit of all the observed line ratios at least within a factor of 2 (model mav, Table 1) with a larger precision for the strongest lines.
Complex models such as the pluri-nebula ones used for BI Cru, require the combination of two calculation processes. The first is achieved by the SUMA code which calculates the spectrum emitted from a single nebula, the second is an ad hoc program which provides the weighted sum of the single-nebula spectra. The results of the two processes are cross-checked until a fine tune between the observed and calculated line ratios is obtained. The whole procedure requires a large grid of models which are constrained by the data, by the range of the physical parameters in symbiotic systems, and by consistency of line and continuum modelling.
The average line ratios are calculated by:
(Iλ/IHβ)av = ((I)i (IHβ)i wi) / (IHβ)i wi
where i= 1 to 4 refers to the models. The calculated line ratios (I)i and calculated absolute H fluxes (IHβ)i are given in Table 1.
The absolute fluxes of the lines are very different for the different models, depending particularly on n. Mathematically, the weights wi roughly compensate for the line fluxes. Physically, they represent the factors which are introduced in Sect. 6 in order to compare fluxes calculated at the nebula with fluxes observed at Earth.
The results obtained by modelling the line spectrum lead to a better understanding of BI Cru system. For instance, the contribution of model m2, which is characterised by =150 and 103 , leads to a better fit of the HeI/HeII line ratio. This shock velocity is also suitable to the expanding shock, even if models m1 and m2 show different pre-shock densities by a factor of 100, and a different ionization parameter. This confirms that the expanding shock is very disrupted and propagates in the a non homogeneous medium.
Shock velocities through clouds of different densities are inversely proportional to the density square root ratio: this is evident when comparing and of models m2 and m3. In turn, model m3 shows both lower and than model m1, thereby indicating that the corresponding nebula has reached a larger distance from the central system than that corresponding to the model m1.
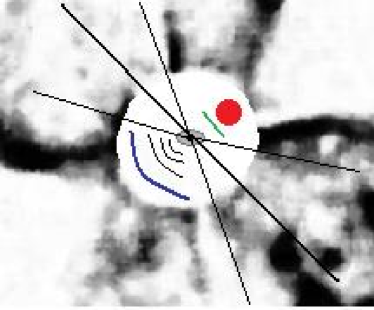
A sketch showing the location of the shock fronts within BI Cru symbiotic system is shown in Fig. 4
Notice that calculated [NeIII]/H and [SII]/H can be ameliorated adopting relative abundances of Ne and S slightly higher than solar by a factor of 1.5. We can deduce directly from the fitting results the abundances of Ne and S because they are not strong coolant. Ne/H and S/H higher than solar might be characteristic of WD atmospheres, although in BI Cru they are highly diluted by merging with the ISM.
The electron density and the electron temperature measured from the observations appear in the bottom of Table 1 for comparison.
Using SUMA, the spectra emitted from each nebula result from integration throughout different gas regions downstream characterized by different physical conditions which derive from the cooling rate, from radiation transfer of the primary and secondary (diffuse) radiation flux, and from compression which characterizes models accounting for the shocks. We present in Fig. 5 the profiles of the electron density Ne, electron temperature Te, and of the fractional abundance of the most significant ions which lead to the different lines ratios. The lines in Table 1 correspond to low and intermediate ionization levels, meaning that most of the lines are emitted from gas at 5 104 K.


3.4 The FeII lines
Finally, we refer to the several permitted FeII lines, often recorded in BI Cru spectra (Fig. 3) but not included in Table 1, which deserve a special discussion. Emission lines of FeII are seen in the ultraviolet spectra of many SSs (e.g. RR Tel, AG Peg). In some objects, optical multiplets of FeII are also seen in emission, indicating that the ultraviolet resonance lines are optically thick (Penston 1987).
Transitions between even 5-eV levels and even 3-eV levels correspond to the permitted optical multiplets 27, 28, and 29, around 4000 Å, and to the well-known feature at 4570 Å (Collin & Joly 2000), which are all observed in BI Cru, while forbidden [FeII] lines are rarely observed. Therefore, an overabundance of iron cannot help to explain the FeII emission by a photoionization model, but the FeII region should be heated by an additional mechanism; that is, the FeII spectrum is not produced directly by photoionization but more probably by shocks. Indeed, it is generally believed that collisional excitation is responsible for the bulk of the FeII emission, and it has been shown how these lines may represent, especially in SSs, one of the most direct traces of fast outflows of WD winds (Eriksson et al. 2007). Inelastic collisions with electrons excite the odd parity levels near 5 eV which then decay into the optical and UV lines. Self-fluorescence and fluorescent excitation by Ly are also important sources of excitation (Sigut & Pradhan 2003).
Verner et al. (2000) have shown that at low densities (ne 102 - 104 ) the permitted optical Fe II lines are relatively weak, the reason being that the 63 lowest levels, the most populated at these densities, are all of the same (even) parity and are able to radiate only forbidden lines. The situation dramatically changes near 106 because, then, levels of odd parity are populated by collisions, enough to produce the permitted lines. Therefore, if both the permitted Fe II and forbidden lines were produced in the same region, the density should be larger than 106 and lower than 108 because forbidden lines would be collisionally deexcited (Veron-Cetty et al. 2004).
In the case of BI Cru, it is interesting to note that models m1 and m4 correspond to 2 105 and 105 , respectively, which lead to ne 106 downstream. In this density range, the FeII lines can then be produced without invoking a different emission region for permitted and forbidden lines, conversely to what stated by HC80.
4 The broad H line
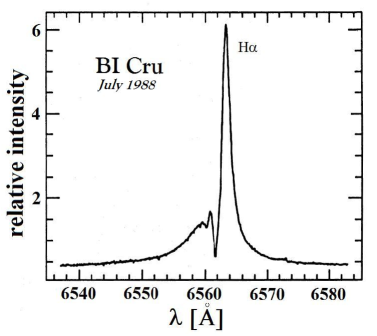
Whitelock et al. (1983) reported on a strong H with blue displaced P Cyg absorption at -228 and extensive emission wings with FWHM of 1500-2000 , observed in the 1974 spectra. On Feb 1984, R88 observed the H region, noting a double emission with a strong and broad violet-shifted absorption extending to about -300 . The H absorbed portion was thought to arise from gas in front of an HII region with a large velocity gradient, hence suggesting a possible location in the cool giant wind accelerated by the intense radiation of the hot component. SC92 recorded, on a high-resolution spectrum taken in 1988, an H line with a FWZI of more than 3000 (Fig. 6): such velocities are generally explained by scattering in an accretion disk (Robinson et al. 1989).
Linear spectropolarimetry of BI Cru was presented by Harries (1996). Interestingly, he found that the broad blue H wing is unpolarized, while the red one is strongly polarized. As already suggested by R88, Harries (1996) proposed that the H emission is produced in two separate velocity regimes: the central narrow peak being formed in the slow moving part of the cool component wind, while the broad component in the part of the wind approaching the hot source. The spectropolarimetric observations supported this hypothesis, although Harries (1996) believed the source of the high velocity material had to be identified in a bipolar flow.
The broad blue wing of H could neither be emitted from the accretion disk because the blue wing and the red wing show different polarization. Actually, lines emitted from an accretion disk are generally double peaked with asymmetry in peak heights. The modelling by Robinson et al. (1994) leads to two peaks with similar intensity, while in SSs that are believed to contain an accretion disk, eclipses are invoked to explain unequal emission peaks. For instance, an exceptionally broad nuclear H was observed in M2-9 by Balick (1989) and explained as emitted from the accretion disk because double-peaked. However, the ratio of the red and blue component intensities and a line width of 11,000 deserve a different interpretation.
Our analysis of the exceptionally broad H in BI Cru focuses on the evidence that the blue wing is unpolarized, meaning that this part of the line is formed out of the scattering region, and excluding therefore broadening by scattering by a high opacity (Mikalojewska et al. 1988).
Moreover, in Fig. 3 the H line appears abnormally broad, whereas the other strong permitted lines (e.g. He I 5876 and 6676) which should be emitted from the same emitting gas region, are both much narrower.
According to our recent interpretation concerning the appearance of a broad Ly in the CH Cyg spectra at the end of the active phase 1977-1986 (Contini et al. 2009b), we would like to explain the broad H line in BI Cru by means of the theory of charge transfer reactions between ambient hydrogen atoms and post-shock protons at a strong shock front (Heng & Sunyaev 2008). Particularly, recall that in the circumstellar side of the WD opposite to the red giant, the effect of symbiosis is less enhanced. Here, we can apply to the WD outburst the theory developed by Chevalier (1982) for Type II supernovae.
We rely on the hypothesis of CS93 that multiple bursts could occur in BI Cru, similarly to He2-104. The WD temperature 26500 K found by modelling the line spectra is an indication that the last burst is completely run out. Whitelock et al. (1983) reported on FeII narrow lines and Allen’s (1984) spectrum is rich in NIII and HeII lines which could be emitted from the expanding region. According to the shock front network created by collision of the wind, the expanding shock front is located in the circumbinary side of the system opposite to the red giant star. Therefore we can apply Chevalier’s theory.
Actually, Kawabata et al. (2009) published the optical spectra of Type II SN 2006gy at late state detection. A strong similarity with BI Cru H line profile (Fig. 6) can be noticed.
The interaction of the freely expanding matter with the surrounding medium gives rise to a high-energy density region bounded by shock waves. Two shock fronts develop, one proceeding inward in the high density region, the other expanding outward in the circumstellar medium. Following Chevalier, we consider the interaction of the outburst with circumstellar matter on the assumption that it is built up by a steady wind. If the ambient density is described by r-s (= 1.4 mH n, where n is the density in number and mH the mass of the H atom) the steady wind corresponds to s=2.
By 3D hydrodynamic simulation in the case of RS Ophiuci, Walder et al. (2008) found that the density decreases throughout the nova remnant as 1/r2 in average. Accordingly, we will use the case of the uniform expanding gas described by s=2 and =5/3.
For s=2, the radius of the outer shock corresponding to the blast wave RBW is given by the Primakoff solutions (Chevalier 1982, eq.5) :
| (1) |
where E is the total energy (twice the kinetic energy), = A R, = 1.4 mH , and the density of the gas upstream.
This equation is valid for times longer than a specific time, called the time of change
| (2) |
between that of the interaction of freely expanding matter with the surrounding medium and the following one, i.e. when the flow tends toward the self-similar solution for a point explosion in a power-law density profile (Sedov 1959). Mej is the ejected mass.
The velocity of the blast wave is:
| (3) |
On the basis that no burst has been recorded in the last 60 years of observations, we adopt t60 years as a lower limit. Following the method indicated by Contini et al. (2009b) for CH Cyg, a present blast wave velocity VBW= 1500-2000 , at least 60 yr after the outburst, would then translate to Vo 5800-7700 one year after the burst. A velocity of 5800 is about the maximum predicted by the models of Yaron et al. (2005) for nova outbursts. A period shorter than one year after Bi Cru burst would lead to higher velocities. We cross-check whether one year from the burst is compatible with the time of change ts (eq. 2). If so, we adopt an initial velocity of 5800 as the escape velocity.
The results of Yaron et al (2005) and Prialnik & Kovetz (1995) models of nova outbursts indicate that a velocity of 5800 is possible for a 1 M⊙ WD.
Considering an escape velocity of 5800 and a WD mass MWD=1. M⊙ , we obtain the radius of the WD, RWD 6.7 108 cm. This in turn corresponds to L* 7 1035 erg s-1 for =200,000 K, still below the Eddington luminosity. Therefore, a stellar wind could not develop from BI Cru and confirms the hypothesis of a nova-type wind.
The radius of the blast wave in BI Cru 60 years after the outburst, is calculated by RBW = 3/2 VBW t, leading to RBW=4 1017 cm. The ejected mass is then calculated by eq. 2. Notice that A = 1.4 mH R is a constant. We assume that the preshock density at a radius of 4 1017 cm from the binary system is of the order of that of the ISM (0.1 - 10 ). Then, if ts = 1 year, Mej/ = 4.8 10-6 M⊙ cm3, in agreement with Prialnik & Kovetz (1995).
We can calculate by A that a density of 109 could be found within a radius of 1.2 1013 cm from the WD.
5 The bipolar lobes
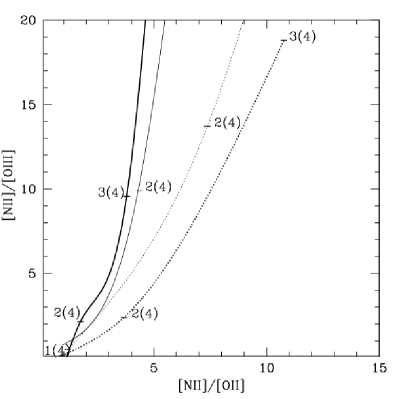
The central image of BI Cru taken by SC92 (Fig. 1) is in the [NII] light. No [OIII] and [OII] appear in the lobes. In the 1986/87 spectra they have identified: HI,HeI,HeII,OI,OII,OIII, [OIII],NII,NIII,[SII], SiII, FeII,[FeIII],[FeVI], [ClIII],[ClIV]. The 1987 spectrum, much richer than the 1986 one, confirms the important variability of the object.
The ejecta (jets) interact with the ISM with velocities 200 , similarly to what happens in the He 2-104 ’crab legs’. Two lobes are seen in the [NII] light but not in the [OII] and the [OIII], in both BI Cru and He2-104. Contini & Formiggini (2001) have modelled and discussed the formation of the ”crab legs” in He2-104: therefore we follow the same modelling approach. First, we constrain the models by [NII]/[OII] and [NII]/[OIII] 1. We have run a shock dominated (U=0) grid of models with between 200 and 250 as measured by SC92. Fig. 7 shows that the critical line ratios result easily for =200 . Higher velocities can be excluded. The pre-shock densities are 104 , high enough to reduce the [OII] line intensity by collisional deexcitation downstream, as can be seen in Fig. 8, where the electron density , electron temperature , and the fractional abundances of the most significant ions in the lobes, are shown as a function of distance from the shock front (in cm). The magnetic field is =10-3 Gauss, the same as that found in the system centre. The geometrical thickness of the filaments in the lobes is =1017 cm, leading to radiation-bound models.

6 The continuum SED
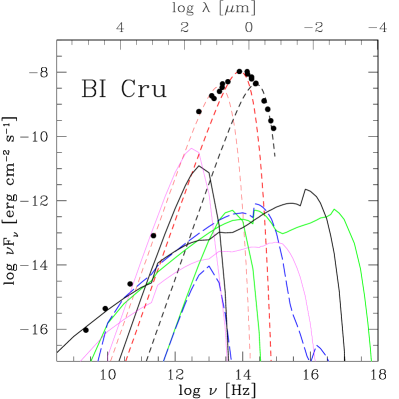
The observed SED of the continuum, calculated consistently with the line spectra that were extensively presented in the previous sections, is shown in Fig. 9. There are no data for the continuum flux in the years corresponding to the 1962 line spectra (Sect. 3). We are thus forced to refer to later data, having already checked that the intrinsic flux variations at different epochs are not as strong as to invalidate the results (Sect.2). At high frequencies ( 1015 Hz) there are no data, so we constrain the models on the basis of the radio-IR-optical data presented in Sect. 2.
As we have shown in previous papers (e.g. Contini et al. 2009a), a few schematic models can describe the variable spectra of SSs: therefore we compare the combination of models calculated by the fit of the line spectrum on the basis of a data-set taken on a certain time, with a mosaic of continuum data observed at very different epochs. The modelling is presented in Fig. 9, left diagram. The models are scaled according to the weights shown in Table 1, last row.
Model m4 (Fig. 9, left diagram, green lines) shows the characteristic self-absorption in the radio range already found in other SSs (e.g. H1-36, Angeloni et al. 2007b). It describes the physical conditions of the nebula downstream of the reverse shock which is characterized by relatively high densities downstream ( 106 ). This model shows that X-rays could be expected in 1962. Emission in the UV - soft X-ray is suggested by model m2 (black lines) which explains also the data at longer wavelengths. This model represents the nebula expanding with =150 . The bremsstrahlung emitted from the shock dominated model m3 (violet lines) is not directly seen throughout the SED; however, its reprocessed emission from dust may contribute to very far IR emission ( 1012 Hz).
We suggest that the presence of many shock fronts in BI Cru should be confirmed by synchrotron radiation in the radio range, produced by the Fermi mechanism.
The line spectra are generally modelled referring to the line , while the SED of the continuum is modelled on the basis of fluxes. Since the observations are taken at the Earth, while the models are calculated at the nebula, we define the factor =( ff R/d)2, where r is the distance of the nebula from the SS center, d the distance to Earth ( 2 kpc for BI Cru), and ff the filling factor. The factors, depending on the distance of the nebulae from the system center, further constrain the models.
Adopting a continuum SED similar to that observed in later epochs, we find that the radius of the different nebulae which contribute to the 1962 line spectrum are rm1 = 6. 1013 cm, rm2 = 1.8 1017 cm, and rm3= 1.5 1016 cm, adopting ff=1.
The distance of the reverse shock from the hot star is r= 2.8 1013 cm, considering that for model m4, U=1 can be combined with by means of (r/r2)=U n c, where is the flux in number of photons cm-2 s-1 corresponding to = 26500 K, and adopting rWD= 5.4 108 cm (Sect. 3.3).
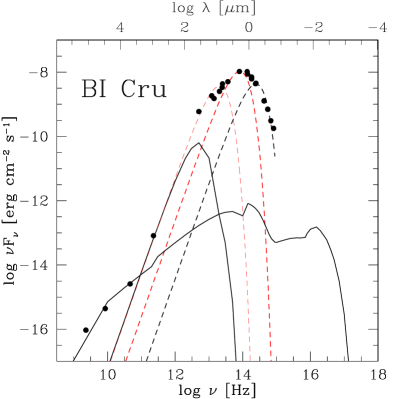
In Fig. 9, right diagram, we refer to the modelling of the lobe spectra (Sect. 3.3).
We select a model (ml) representing the filaments in the lobes, with =210 as indicated by SC92,
=2 104 , =10-3 Gauss, =0.33 pc.
The bremsstrahlung calculated by model ml is then compared with the data in Fig. 9 (right diagram,
blue lines), leading to log =-12.5. SC92 indicate that the lobes had expanded to a radius rl1.3 pc.
Combining with rl we obtain ff 0.001.
According to its nature of dusty SS, also BI Cru confirms that in order to reproduce the NIR-MIR continuum slopes, different ”dust” temperatures should be combined (e.g. Anandarao et al. 1988, Angeloni et al. 2009, in preparation). In BI Cru, two dust shells result from the continuum SED modelling, an internal one at a temperature of 800 K with a radius of 1.5 1014 cm, and the outer one at 250 K with a radius of 1.6 1015 cm, probably circumbinary.
| BI Crua | He2-104b | R Aqrc | CH Cygd | |||||||||||||||
|---|---|---|---|---|---|---|---|---|---|---|---|---|---|---|---|---|---|---|
| (K) | 26500 | 130000 | 80000 | 150000-35000 | ||||||||||||||
| rev | exp | lobe | rev | exp | lobe | rev | exp | jets | rev | exp | jets | |||||||
| U | 1 | 0 - 25 | 0. | 0.4 | 0.005 | 0. | 0.005-0.01 | - | 0.-0.0023 | 1-6 | 0.01-0.001 | - | ||||||
| () | 400 | 70-190 | 210 | 300 | 50 | 250 | 110-120 | - | 50-150 | 600-1200 | 70-150 | 70-100 | ||||||
| (104) | 10 | 0.16-20 | 2 | 7 | 2 | 0.1 | 6 | - | 0.005-7 | 1000-5000 | 10-1000 | 0.5 | ||||||
| (10-3 g) | 1 | 0.1-1 | 1 | 1 | 1 | 1 | 2 | - | 0.1-1 | 3 | 1 | 3 | ||||||
| (1015 cm) | 0.1 | 1-5 | 100 | 4.5 | 2. | 10 | 0.2 | - | 1.4-10 | 0.1 | 5-300 | 1 | ||||||
7 Discussion and concluding remarks
We present the quantitative results obtained by the analysis of the spectra observed
from BI Cru in different epochs.
1962 : we analysed the spectra observed in 1962 within a colliding-wind theoretical framework (Sect. 3). The data of the continuum were observed many years later than those of the 1962 line spectra. Even considering a minimum set of prototypes, the emerging picture of the BI Cru nebular network is consistent.
The result obtained by modelling the line spectra indicates that in 1962 BI Cru may have been in a post-eruption ”classical” phase, with two main shock networks created by the collision of the stellar winds. The shock front between the stars, facing the hot star, has a velocity of =400 , while the expanding shock shows different components with = 70-190 , in agreement with the observed FWHM. The shock velocities are thus similar to those found in other SSs for the reverse and expanding shocks, respectively (Angeloni et al. 2007a,b,c and references therein).
The physical conditions (e.g. ne 106 downstream) which result from line modelling, are responsible
for self-absorption of free-free radiation in the radio range, and also indicate that both
permitted and forbidden FeII lines can be emitted from the same region.
1974 : we argued that the observed broad blue wing of H could not be emitted from the accretion disk because the blue wing and the red wing show different polarization. So we present in this paper a new interpretation of the H broad blue wing adopting the model developed by Chevalier (1982) to explain the hydrodynamical picture in SNae after the explosion, combined with the Heng & Sunyaev (2008) theory of broad Lyman and Balmer emission line production.
In particular, the broad blue wing of the H line observed by Whitelock et al. (1983) in 1974 is explained by emission throughout the blast wave shock front created by a past (60 years ago), unrecorded outburst which has now reached a radius 1 pc. Adopting the Robinson et al. (1989) model of line formation from the accretion disk, the broad H line emission should originate from the innermost regions of the disk, being always perceived only if the accretion disk is face-on, but hardly seen in other configurations. On the other hand, by Chevalier’s theory (Sect. 3.3) the broad H line is formed within the limit of the system ( 0.3 pc) and is seen only from the side of the WD opposite to the Mira.
We have demonstrated that, even though no outbursts have been recently observed in BI Cru at least in the last 60 years of historical observations, this does not invalidate our analysis; on the contrary, this negative evidence is exploited as a temporal constrain in the calculations.
Interestingly, the blast wave velocity ( 5800-7700 ) estimated for BI Cru at very early times after the outburst (Sect. 4), is about twice the velocity of the nova ejecta in RS Ophiuci immediately after the 1985 outburst ( 2700-3900, Shore et al. 1996) and after the 2006 outburst ( 3500 , Walder et al. 2008). However, in the broad-line phase of RS Ophiuci observed 6 days after the brightness peak, the OI 1300 and NIII] 1750 lines showed FWZI of 7000 (Shore et al. 1996). Moreover, the detection of X-rays from RS Ophiuci (e.g. O’Brien et al. 1992) was explained by shocks. X-ray emission could be expected also from BI Cru (Fig. 9).
Concluding, the spectrum observed from BI Cru in 1962 indicates that we were seeing the internal region between the stars. The broad H reported in 80’s and 90’s indicated that we were seeing the system from the side of the WD opposite to the Mira. We wonder whether these insights are sufficient to suggest a likely orbital period for BI Cru of 100 years.
1992:
the lobes observed by SC92 in 1992, expanding out to 1.3 pc, are dominated by the [NII] 6584 line.
We have modelled the filaments in the lobes by constraining the model by the absence of [OII] 3727 and [OIII] 5007.
The fit of the calculated model to the observed continuum SED leads to a filling factor in the lobes of about 0.001.
Finally, in Table 2 we compare the results obtained for BI Cru with those obtained for He2-104, R Aqr and CH Cyg, all objects showing lobes and jets extending outwards.
The temperatures of the hot star are within the range of moderately WD at quiescence
( 30000 K - BI Cru) and those ( 100000 K - CH Cyg) that power the typical high ionization
emission line spectra of SSs; R Aqr, with =80000K, is just in between.
Ionization parameters, shock velocities, pre-shock densities, pre-shock magnetic fields, and geometrical thickness
of the disrupted filaments are rather similar in BI Cru and He2-104.
The relatively high geometrical thickness of the nebula downstream of the reverse shock in He 2-104
would result in a large binary separation, but the large ranges of physical conditions in the expanding
fragments of BI Cru firmly indicate that its surrounding medium is actually more inhomogeneous.
The jets in R Aqr have a different aspect due to a complex combination of
shock dominated and radiation dominated spectra with a low U,
indicating strong dilution of the ionizing radiation.
By consistent modelling of the UV spectra emitted from the reverse nebula in R Aqr,
Contini & Formiggini (2003) confirmed that the inverse shock is
a standing shock and that a strong shock does not form in R Aqr, even if the lines show a
large FWHM. In contrast, a strong shock
appears in BI Cru (=400 ), and can be very strong ( 1500 )
in CH Cyg.
Acknowledgments
The authors acknowledge many helpful conversations with Dina Prialnik. They also would like to thank the referee, R.L.M. Corradi, for helpful comments that improved the readability of the paper.
References
- Allen (1973) Allen, C. W. 1973, London:University of London, Athlone Press, 1973, 3rd ed.
- Allen (1974) Allen, D.A. 1974, Inf. Bull. Var. Stars, 911
- Allen (1984) Allen, D. A. 1984, AP&SS, 99, 101
- Anandarao et al. (1988) Anandarao, B. G., Taylor, A. R., & Pottasch, S. R. 1988, A&A, 203, 361
- Angeloni et al. (2007a) Angeloni, R., Contini, M., Ciroi, S., & Rafanelli, P. 2007a, AJ, 134, 205
- Angeloni et al. (2007b) Angeloni, R., Contini,M., Ciroi, S., & Rafanelli, P. 2007b, A&A, 471, 825
- Angeloni et al. (2007c) Angeloni, R., Contini,M., Ciroi, S., & Rafanelli, P. 2007c, A&A, 472, 497
- Balick (1989) Balick, B. 1989, AJ, 97, 476
- Bohigas et al. (1989) Bohigas, J., Echevarria, J., Diego, F., & Sarmiento, J. A. 1989, MNRAS, 238, 1395
- (10) Chevalier, R.A. 1982, ApJ, 259, L85
- Collin & Joly (2000) Collin, S., & Joly, M. 2000, New Astronomy Review, 44, 531
- Contini (1997) Contini, M. 1997, ApJ, 483, 887
- Contini, M. & Formiggini, L. (2001) Contini, M. & Formiggini, L. 2001 A&A, 375, 579
- Contini & Formiggini (2003) Contini, M. & Formiggini, L. 2003, MNRAS, 339, 148
- Contini et al. (2009a) Contini, M., Angeloni, R., Rafanelli, P., 2009a, submitted to AN
- Contini et al. (2009b) Contini, M., Angeloni, R., Rafanelli, P., 2009b, A&A, in press
- Corradi, Schwarz (1993) Corradi, RLM, & Schwarz, H.E. 1993, A&A, 268, 714
- Crocker et al. (2001) Crocker, M. M., Davis, R. J., Eyres, S. P. S., Bode, M. F., Taylor, A. R., Skopal, A., & Kenny, H. T. 2001, MNRAS, 326, 781
- Egan et al. (2003) Egan, M. P., Price, S. D., & Kraemer, K. E. 2003, Bulletin of the American Astronomical Society, 35, 1301
- Eriksson et al. (2007) Eriksson, M., Veenhuizen, H., & Nilsson, H. 2007, Baltic Astronomy, 16, 95
- (21) Girard, T., Willson, L.A. 1987, A&A, 183, 247
- Gromadzki et al. (2006) Gromadzki, M., Mikolajewski, M., Tomov, T., Bellas-Velidis, I., Dapergolas, A., & Galan, C. 2006, Acta Astronomica, 56, 97
- Harries (1996) Harries, T. J. 1996, A&A, 315, 499
- Henize,Carlson (1980) Henize, K.G. & Carlson, E.D. 1980, PASP, 92, 479
- Heng & Sunyaev (2008) Heng, K., & Sunyaev, R. A. 2008, A&A, 481, 117
- Ivison et al. (1995) Ivison, R. J., Seaquist, E. R., Schwarz, H. E., Hughes, D. H., & Bode, M. F. 1995, MNRAS, 273, 517
- Kawabata et al. (2009) Kawabata, K. S., Tanaka, M., Maeda, K., Hattori, T., Nomoto, K., Tominaga, N., & Yamanaka, M. 2009, arXiv:0902.1440
- Kenny & Taylor (2005) Kenny, H. T., & Taylor, A. R. 2005, ApJ, 619, 527
- Kenyon et al. (1986) Kenyon, S.J., Fernandez-Castro, T., Stencel, R.E. 1986, AJ, 95, 1118
- Kwok (1988) Kwok, S. 1988, The Symbiotic Phenomenon, Proceedings of IAU Colloq. 103, held in Torun, Poland, 18-20 August, 1987. Edited by Joanna Mikolajewska, Michael Friedjung, Scott J. Kenyon, and Roberto Viotti. Dordrecht, Kluwer Academic Publishers (Astrophysics and Space Science Library. Volume 145), 1988., p.129, 129
- Lee (1973) Lee, S.G. 1973, Inf. Bull. Var. Stars, N.813
- Livio et al. (1986) Livio, M., Soker, N., & Dgani, R. 1986, ApJ, 305, 267
- Livio (1988) Livio, M. 1988, The Symbiotic Phenomenon, Proceedings of IAU Colloq. 103, held in Torun, Poland, 18-20 August, 1987. Edited by Joanna Mikolajewska, Michael Friedjung, Scott J. Kenyon, and Roberto Viotti. Dordrecht, Kluwer Academic Publishers (Astrophysics and Space Science Library. Volume 145), 1988., p.323, 323
- Luna & Sokoloski (2007) Luna, G. J. M., & Sokoloski, J. L. 2007, ApJ, 671, 741
- McCollum et al. (2008) McCollum, B., Bruhweiler, F. C., Wahlgren, G. M., Eriksson, M., & Verner, E. 2008, ApJ, 682, 1087
- Mikolajewska et al. (1988) Mikolajewska, J., Selvelli, P. L., & Hack, M. 1988, A&A, 198, 150
- Morris (87) Morris,M. 1987, PASP¡ 95, 1115
- Munari et al. (1992) Munari, U. et al. 1992, A&A Suppl. 93, 383
- Nussbaumer et al. (1995) Nussbaumer, H., Schmutz, W., & Vogel, M. 1995, A&A, 293, L13
- Nussbaumer (2000) Nussbaumer, H. 2000, Thermal and Ionization Aspects of Flows from Hot Stars, 204, 317
- O’Brien et al. (1992) O’Brien, T. J., Bode, M. F., & Kahn, F. D. 1992, MNRAS, 255, 683
- Penston (1987) Penston, M. V. 1987, MNRAS, 229, 1P
- Prialnik & Kovetz (1995) Prialnik, D., & Kovetz, A. 1995, ApJ, 445, 789
- Purton et al. (1982) Purton, C. R., Feldman, P. A., Marsh, K. A., Allen, D. A., & Wright, A. E. 1982, MNRAS, 198, 321
- Robinson et al. (1989) Robinson, K., Bode, M. F., Meaburn, J., & Whitehead, M. J. 1989, Dynamics of Astrophysical Discs, 85
- Robinson et al. (1994) Robinson, K., Bode, M. F., Skopal, A., Ivison, R. J., & Meaburn, J. 1994, MNRAS, 269, 1
- Rossi (1988) Rossi, C., Altamore, A., Ferrari-Toniolo, M., Persi, P., Viotti, R. 1988, A&A, 206, 279
- Schwarz & Corradi (1992) Schwarz, H.E. & Corradi, R.L.M. 1992, A&A, 265, L37
- Sedov (1959) Sedov, L. I. 1959, Similarity and Dimensional Methods in Mechanics, New York: Academic Press, 1959
- Sigut & Pradhan (2003) Sigut, T. A. A., & Pradhan, A. K. 2003, ApJS, 145, 15
- Shore et al. (1996) Shore, S. N., Kenyon, S. J., Starrfield, S., & Sonneborn, G. 1996, ApJ, 456, 717
- Sokoloski (2003) Sokoloski, J. L. 2003, Journal of the American Association of Variable Star Observers (JAAVSO), 31, 89
- Verner et al. (2000) Verner, E. M., Verner, D. A., Baldwin, J. A., Ferland, G. J., & Martin, P. G. 2000, ApJ, 543, 831
- Véron-Cetty et al. (2004) Véron-Cetty, M.-P., Joly, M., & Véron, P. 2004, A&A, 417, 515
- Walder et al. (2008) Walder, R., Folini, D., & Shore, S. N. 2008, A&A, 484, L9
- Whitelock et al. (1983) Whitelock, P.A., Feast, M.W., Roberts, G., Carter, B.S., Catchpole, R.M., 1983, MNRAS, 205, 1207
- Yaron et al. (2005) Yaron, O., Prialnik, D., Shara, M. M., & Kovetz, A. 2005, ApJ, 623, 398