An integrated atom detector: single atoms and photon statistics
Abstract
We demonstrate a robust fiber optics based fluorescence detector, fully integrated on an atom chip, which detects single atoms propagating in a guide with 66% efficiency. We characterize the detector performance and the atom flux by analysing the photon statistics. Near-perfect photon antibunching proves that single atoms are detected, and allows us to study the second-order intensity correlation function of the fluorescence over three orders of magnitude in atomic density.
pacs:
03.75.-b, 42.50.Lc, 42.81.-i, 07.60.VgThe ability to efficiently detect single particles is of fundamental importance to many branches of science. For example counting single photons was one of the starting points of quantum optics Mandel and Wolf (1995) and single particle (qubit) detection is one of the key ingredients for quantum technologies Bouwmeester et al. (2001).
Detecting atoms is usually achieved by illumination with near-resonant light, followed by a measurement of the absorption, phase shift or fluorescence. Placing an optical cavity around the detection region significantly enhances the signal and single atom sensitivity can be achieved Mabuchi et al. (1996); Münstermann et al. (1999); Hood et al. (2000); Öttl et al. (2005); Haase et al. (2006); Aoki et al. (2006); Teper et al. (2006); Colombe et al. (2007); Trupke et al. (2007). Active alignment of the cavities is however technically challenging.
Single pass absorption does not allow one to detect single free atoms van Enk and Kimble (2001), is necessary to hold the atom in a trap to reach sufficiently long integration times Quinto-Su et al. (2004); Tey et al. (2008). Similarly, fluorescence detection is very efficient if atoms are tightly localized in a trap and many photons can be collected. It is the method of choice for many single atom or ion experiments Kuhr et al. (2001); Rowe et al. (2001); Leibfried et al. (2003); Darquie et al. (2005); Volz et al. (2006); Weber et al. (2006); Sortais et al. (2007). Free neutral atoms are considerably harder to detect because the few scattered photons are difficult to distinguish from background light. Recently, fluorescence detection of freely falling single atoms has been demonstrated by using macroscopic mirrors covering a solid angle of almost Bondo et al. (2006).
In an ideal fluorescence detector, the background is negligible and a single detected photon implies that an atom is present in the detection region. In this letter we present a simple fluorescence detector based on fiber optics fully integrated on an atom chip Folman et al. (2002); Fortágh and Zimmermann (2007) that detects single atoms in a magnetic guide with high signal to noise ratio 11endnote: 1Signal to noise ratio (SNR) is defined as the signal count rate divided by the count rate of the background. In our present experiments it ranges between 20 and 100 and is only limited by the dark counts of the APD. and an efficiency of 66%. Previous implementations of on chip detectors have been based on absorption detection where small atomic ensembles (typical 100 atoms) could be detected Quinto-Su et al. (2004), or used cavities Teper et al. (2006); Colombe et al. (2007); Trupke et al. (2007), which are more complex to handle.
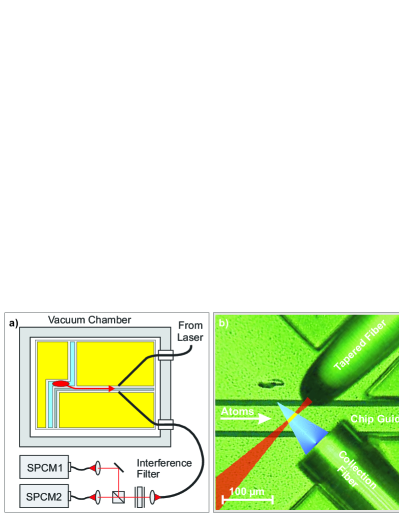
Our detector consists of a tapered lensed single mode fiber (focal length of 40 µm and a mode diameter of 5 µm) used to excite the atoms in a small detection region, the fluorescence photons are selectively collected from this small volume by a standard gradient-index multimode fiber with low mode dispersion, and numerical aperture (NA) of 0.275, mounted at an angle of 90 degrees (Fig. 1b) to reduce stray light 22endnote: 2The advantages of this setup are related to properties of a confocal microscope: The tapered lensed fiber delivers the excitation light efficiently to a small detection region and the multimode fiber selectively collects the fluorescent photons from this small volume and a large fraction of the background noise is filtered away very efficiently, even when the detection region is located only 62.5 µm above the chip surface. The difference to a regular confocal microscope is that the involved point spread functions are different.. The collected light is sent through an interference filter to photon counter(s) (SPCM) as illustrated in Fig. 1a. The overall probability of detecting a fluorescent photon in this setup is %, including the collection efficiency, losses, and the SPCM efficiency.
The detector is fully integrated on our atom chip Groth et al. (2004) by mounting the two fibers on the chip surface in lithographically defined holders fabricated from SU-8 resist which allow very stable passive alignment. Liu et al. (2005); Wilzbach et al. (2006).
The fiber-based detector presented here has exceptionally low background, the dominating contribution are the dark counts ( cps) of the employed photon counter (Perkin-Elmer, SPCM-AQR-12). Despite the proximity of the chip surface, the influence of stray probe-light is essentially eliminated with a suppression of better than . 1 nW excitation light contributes only cps to the background. This extremely low background allows high fidelity detection of a single atom and accurate measurements of photon and atom statistics.
The experiment is carried out in a setup similar to the one described in Wildermuth et al. (2004). 87Rb atoms are first laser cooled in a magneto-optic trap, optically pumped into the state, and transferred to a Ioffe-Pritchard type magnetic trap generated by a Z-shaped wire on the chip surface. The atoms are then transferred into a magnetic guide where the atomic cloud can expand towards the detector situated mm away from the magnetic chip trap used to prepare the atoms (Figure 1a). The phase space density in the magnetic trap and guide is always less than .
The position of the magnetic guide above the chip surface is aligned with the focus of the tapered lensed fiber at the detection region by adjusting the current through the chip wire and the strength of the external magnetic field. Atoms passing through the focus of the lensed fiber are excited by laser light tuned near the to transition in 87Rb. Over the next 2000 ms atoms pass the detector and the arrival times of the fluorescent photons are registered. The experiment is repeated several times to measure the photon statistics (Fig. 2).
One observation from these measurements is that the effects of stray light on the guided atoms can be neglected. This is quite remarkable, because magnetic traps are extremely sensitive to the presence of light close to resonance with an atomic transition. On average, scattering of a little more than a single photon is sufficient to pump the atom into a magnetically untrapped state, removing it from the magnetic guide.
When an atom arrives at the detector, it absorbs and then re-emits photons. A few of these photons are counted by the SPCM. This photon scattering strongly disturbs the atom, will pump it into a un-trapped state, or even into a different hyper fine ground state which is not excited by the probing light. Consequently after a time the atom will either leave the detection region or stop scattering photons. Except for random background counts with very low probability the detector sees no further light until the next atom arrives (Fig. 3). Therefore for small atom flux the photon count distribution should reflect both (i) the instantaneous photon emission of the detected atom and its decay at time scales , and (ii) the statistical distribution of the atoms at long time scales ().
To analyze these features, it is useful to measure the statistics and time correlations of the photon counts. In the experiments presented here we use thermal atoms in a multimode guide (typically transverse modes are occupied). Consequently, the atoms exhibit Poissonian statistics as can be verified by a time interval analysis of the atom arrival distribution Köhl et al. (2007) described below .
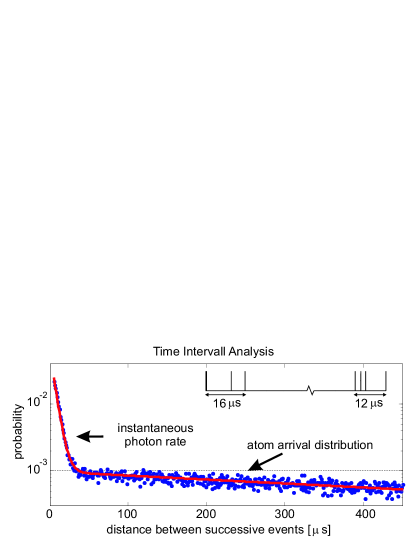
In the case of a constant atom flux composed of uncorrelated atoms, the probability of finding consecutive bins that contain no photons is given by , where is the probability for an empty bin. This means that is a linear function of . In Fig. 3 we see that the time interval distribution is composed of two exponential decays (red line). The steep slope for short time intervals is determined by the instantaneous fluorescence rate of individual atoms. For long time intervals the slope is given by the atom arrival rate. Our measurements show that in the latter region equals the mean rate of atom detections, consistent with a Poissonian distribution of arrival times. Any atom correlations present could be identified from time interval analysis of single measurements Köhl et al. (2007).
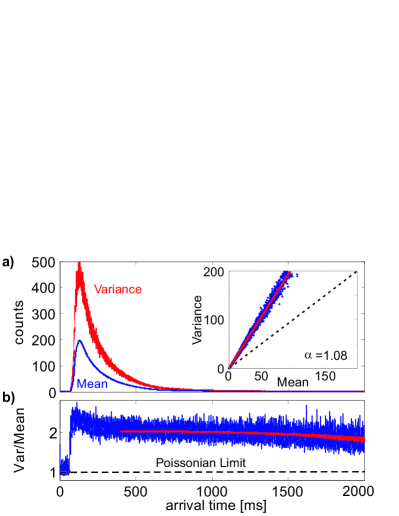
An analysis of the photon noise shows that we can relate the variance and mean of the photon counts directly to the average number of photons detected from each atom Mandel and Wolf (1965). The photon flux from a constant source during time intervals much longer than the excited state life time is described by a Poissonian probability distribution, where the mean photon number and the variance are both equal to . If the fluorescent photons come from a random flow of atoms described by a statistical distribution then is not constant in time. Mandel’s formula must then be used to describe the statistics of these photons Teper et al. (2006): where is the conditional probability of obtaining photons when the observation region contains atoms. With the average number of photons detected per atom, defined by the relation , the conditional photon distribution is given by
For the mean and the variance of the photon distribution one obtains the ratio
| (1) |
When the atoms obey Poissonian statistics, as in our experiments, Eq.(1) reduces to . The mean number of photons detected from each atom () can be directly retrieved from the ratio of variance to mean. If additionally a Poissonian background is taken into account the photon statistics can be expressed as
| (2) |
The atom detection efficiency can be determined from . If there is one atom in the detection region, it will generate at least one photon count with a probability .
From the photon statistics in the data shown in Fig. 2, one obtains and for 1 nW probe beam power, 3 MHz blue detuning, and 300 µs integration time.
The total number of photons scattered by the atoms can be independently obtained by measuring the ratio of the fluorescence counts for F=2F’=1 and the F=2F’=3 transitions. On the F=2F’=1 transition an atom scatters slightly more than one photon before being optically pumped into the other hyperfine ground state, where it remains dark. From the measured ratio we conclude that each atom scatters photons before it leaves the detector. These numbers are in good agreement with =1.08 and the photon detection efficiency % given above. In addition the value of was confirmed from independent global atom number measurements using absorption imaging.
We can investigate if we really detect single atoms by looking at the correlations in the detected fluorescence photons. Since a single atom can emit only one photon at any given time one would expect photon antibunching, characterized by Kimble et al. (1977); Loudon (2000), where the second-order intensity correlation function is given by
| (3) |
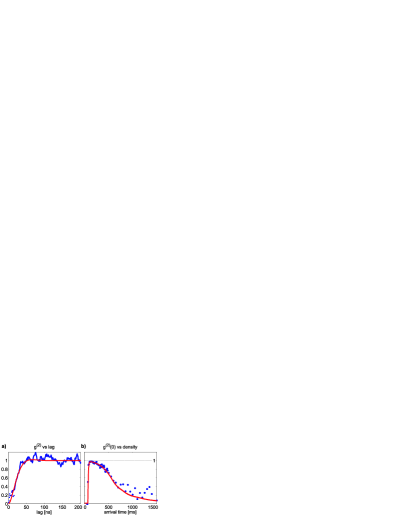
Fig. 4a shows a measurement of from the cross-correlation of photon counts in two SPCMs arranged in a Hanbury Brown-Twiss type setup as shown in Fig.1a. The correlation function was reconstructed from the low density tail of the atom distribution where the mean atomic distance is large enough to guarantee the presence of at most one atom in the detection region at any given time. An evaluation of the raw data results in a value of . If we correct for coincidental background counts, is compatible with zero. Thus we observe near-perfect photon antibunching in the emission of single atoms passing the detector, a clear signature of single atom detection. The single photon count rate is approximately 3500 cps. The red line of Fig. 4a is the theoretically expected shape of for the employed excitation power according to Loudon (2000).
For a single-mode field with mean photon number the second-order correlation at lag =0 is limited by Loudon (2000)
| (4) |
while for the lower limit is 0. For a Fock state with fixed photon number the inequality (4) becomes an equality and the minimal value of is reached. While for classical light sources holds the region is exclusively nonclassical and can only reached by quantum emitters.
Since is evaluated when at least one photon count has been recorded, the mean photon number has to be calculated under the condition . This leads to with mean atom number . Hence is limited by
| (5) |
As can be seen from Fig. 4b the measured follows the expected shape for the full atom pulse duration. With this measurement we extend the original experimental investigation Kimble et al. (1977, 1978) of the influence of atomic density on the second-order correlation function by almost three orders of magnitude change in atomic density.
To conclude, we have built and evaluated an atom detector which is fully integrated on an atom chip, alignment free by fabrication, and mechanically very robust. It is capable of detecting single atoms with 66% efficiency and high signal to noise ratio, which allowed us to study the interplay between atom and photon statistics.
Low noise, high efficiency and insensitivity to stray light is achieved using fiber optics to create very selective excitation of the atoms in a small, matched observation volume. The detection efficiency is currently limited by the numerical aperture of the multimode collection fiber. A straightforward substitution of the employed NA=0.275 fiber by a commercially available fiber with NA=0.53 increases the photon collection to = 4.5 counts/atom and the single atom detection efficiency to 95% at 50 kHz bandwidth. With these improvements, atom counting becomes feasible.
The high efficiency, signal-to-noise ratio and bandwidth of our integrated detector make it suitable for many physical systems where only a few photons can be scattered like in detecting single trapped cold molecules. With it s extremely low sensitivity to stray light, our detector is well suited for studies of correlated atomic systems and scalable quantum experiments on a single-atom or molecule level.
We thank T. Fernholz, A. Haase, and M. Schwarz for help in the early stages of the experiment and S. Groth, I. Bar-Joseph, K.H. Brenner and X. Liu for fabrication of the chip and holding structures. We gratefully acknowledge financial support from Landesstiftung Baden-Würtemberg, the and European Union (SCALA, Atomchip, HIP), and the FWF (PLATON).
References
- Mandel and Wolf (1995) L. Mandel and E. Wolf, Optical Coherence and Quantum Optics (Cambridge University Press, 1995).
- Bouwmeester et al. (2001) D. Bouwmeester, A. Ekert, and A. Zeilinger, The Physics of Quantum Information: Quantum Cryptography, Quantum Teleportation, Quantum Computation (Springer Verlag, Heidelberg, 2001).
- Mabuchi et al. (1996) H. Mabuchi, Q. Turchette, M. Chapman, and H. Kimble, Opt. Lett 21, 1393 (1996).
- Münstermann et al. (1999) P. Münstermann, T. Fischer, P. Maunz, P. Pinkse, and G. Rempe, Phys. Rev. Lett. 82, 3791 (1999).
- Hood et al. (2000) C. Hood, T. Lynn, A. Doherty, A. Parkins, and H. Kimble, Science 287, 1447 (2000).
- Öttl et al. (2005) A. Öttl, S. Ritter, M. Köhl, and T. Esslinger, Phys. Rev. Lett. 95, 090404 (2005).
- Haase et al. (2006) A. Haase, B. Hessmo, and J. Schmiedmayer, Opt. Lett. 31, 268 (2006).
- Aoki et al. (2006) T. Aoki, et al., Nature(London) 443, 671 (2006).
- Teper et al. (2006) I. Teper, Y. Lin, and V. Vuletić, Phys. Rev. Lett. 97, 023002 (2006).
- Colombe et al. (2007) Y. Colombe, et al., Nature(London) 450, 272 (2007).
- Trupke et al. (2007) M. Trupke, et al., Phys. Rev. Lett. 99, 063601 (2007).
- van Enk and Kimble (2001) S. J. van Enk and H. J. Kimble, Phys. Rev. A 63, 023809 (2001).
- Quinto-Su et al. (2004) P. Quinto-Su, M. Tscherneck, M. Holmes, and N. Bigelow, Opt. Expr. 12, 5098 (2004).
- Tey et al. (2008) M. Tey, et al., Arxiv preprint arXiv:0802.3005 (2008).
- Kuhr et al. (2001) S. Kuhr, et al., Science 293, 278 (2001).
- Rowe et al. (2001) M. Rowe, et al., Nature 409, 791 (2001).
- Leibfried et al. (2003) D. Leibfried, R. Blatt, C. Monroe, and D. Wineland, Rev. Mod. Phys. 75, 281 (2003).
- Darquie et al. (2005) B. Darquie, et al., Science 309, 454 (2005).
- Volz et al. (2006) J. Volz, et al., Phys. Rev. Lett. 96, 030404 (2006).
- Weber et al. (2006) M. Weber, J. Volz, K. Saucke, C. Kurtsiefer, and H. Weinfurter, Phys. Rev. A73, 043406 (2006).
- Sortais et al. (2007) Y. R. P. Sortais et al., Phys. Rev. A75, 013406 (2007).
- Bondo et al. (2006) T. Bondo, M. Hennrich, T. Legero, G. Rempe, and A. Kuhn, Opt. Comm. 264, 271 (2006).
- Folman et al. (2002) R. Folman, et al., Adv. At. Mol. Phys. 48, 263 (2002).
- Fortágh and Zimmermann (2007) J. Fortágh and C. Zimmermann, Rev. Mod. Phys. 79, 235 (2007).
- Abraham and Cornell (1998) E. Abraham and E. Cornell, Appl. Opt 37, 1762 (1998).
- Groth et al. (2004) S. Groth, et al., Appl. Phys. Lett. 85, 2980 (2004).
- Liu et al. (2005) X. Liu, et al., Appl. Opt 44, 6857 (2005).
- Wilzbach et al. (2006) M. Wilzbach, et al.,Fortschritte der Physik 54, 746 (2006).
- Wildermuth et al. (2004) S. Wildermuth et al., Phys. Rev. A69, 030901(R) (2004).
- Köhl et al. (2007) M. Köhl, et al., Appl. Phys. B 86, 391 (2007).
- Mandel and Wolf (1965) L. Mandel and E. Wolf, Rev. Mod. Phys. 37, 231 (1965).
- Loudon (2000) R. Loudon, The Quantum Theory of Light (Oxford Science, 2000).
- Kimble et al. (1977) H. J. Kimble, M. Dagenais, and L. Mandel, Phys. Rev. Lett. 39, 691 (1977).
- Kimble et al. (1978) H. J. Kimble, M. Dagenais, and L. Mandel, Phys. Rev. A 18, 201 (1978).