An improved model for the transit entropy of monatomic liquids
Abstract
In the original formulation of vibration-transit (V-T) theory for monatomic liquid dynamics, the transit contribution to entropy was taken to be a universal constant, calibrated to the constant-volume entropy of melting. This model suffers two deficiencies: (a) it does not account for experimental entropy differences of among elemental liquids, and (b) it implies a value of zero for the transit contribution to internal energy. The purpose of this paper is to correct these deficiencies. To this end, the V-T equation for entropy is fitted to an overall accuracy of to the available experimental high temperature entropy data for elemental liquids. The theory contains two nuclear motion contributions: (a) the dominant vibrational contribution , where is temperature and is the vibrational characteristic temperature, and (b) the transit contribution , where is a scaling temperature for each liquid. The appearance of a common functional form of for all the liquids studied is a property of the experimental data, when analyzed via the V-T formula. The resulting implies the correct transit contribution to internal energy. The theoretical entropy of melting is derived, in a single formula applying to normal and anomalous melting alike. An ab initio calculation of , based on density functional theory, is reported for liquid Na and Cu. Comparison of these calculations with the above analysis of experimental entropy data provides verification of V-T theory. In view of the present results, techniques currently being applied in ab initio simulations of liquid properties can be employed to advantage in the further testing and development of V-T theory.
pacs:
05.70.Ce, 61.20.Gy, 64.70.dm, 71.15.MbI Introduction
We are interested in the theoretical description of the motion of nuclei (or atoms) in real monatomic liquids. For many years, such descriptions have been available for gases and crystals, consisting in each case of an approximate but tractable “zeroth order” Hamiltonian, plus complicated but small corrections. Zeroth order for a gas is free particle motion, from Boltzmann Boltzmann (1872), and the correction is potential energy. Zeroth order for a crystal is harmonic vibrational motion Born and von Karmen (1912); Born and Huang (1954), and the major correction is anharmonicity. These theories are extremely valuable, as the zeroth order Hamiltonian provides a complete orthogonal basis set for the nuclear motion. Hence for any physically meaningful problem, the motion can be analyzed and statistical mechanics can be constructed in terms of the basis set. These theories account for equilibrium and nonequilibrium properties of gases and crystals to an accuracy on the order of experimental accuracy.
Our proposal for this kind of theory for monatomic liquids is vibration-transit (V-T) theory Wallace (1997). The key postulate is that the many-body potential energy surface is overwhelmingly dominated by intersecting macroscopically equivalent random valleys. The zeroth order Hamiltonian expresses normal mode vibrational motion in a single random valley harmonically extended to infinity. “Macroscopic equivalence” means that this Hamiltonian for any random valley gives the same statistical averages in the thermodynamic limit macro_equiv . The motion of nuclei is then composed of two parts: brief periods of vibration in one random valley, interspersed with transits which carry the system between neighboring random valleys. Transits, each involving a small local group of nuclei, proceed at a high rate throughout the liquid. For calculation of the partition function, the effect of transits is to correct the potential surface for the valley-valley intersections Wallace (1997, 2002). For nonequilibrium calculations as, e.g., of time correlation functions, the same transits provide the diffusive jumps of the nuclei Wallace (1997); De Lorenzi-Venneri et al. (2008). The vibrational motion is tractable, and is calibrated from potential properties of a single random valley. The vibrational contribution to a thermodynamic function is around of the total Wallace (1997, 2002). The transit motion is complicated, but its contribution to a thermodynamic function is only around Wallace (1997, 2002). This paper is mainly concerned with the vibrational and transit contributions to the entropy of monatomic liquids.
In the original formulation of V-T theory, transits are accounted for only insofar as they give the liquid access to all the random valleys. This property is modeled by multiplying the single random valley partition function by a universal number, calibrated from entropy of melting data Wallace (1997). For , the transit contribution to entropy, this yields , the same for every monatomic liquid. Theory for the total entropy agrees with high-temperature experimental data for normal melting elements to within (Wallace (1997), Fig. 2). Since is approximately of the total entropy for the elemental liquids, the original V-T formulation is quite satisfactory for such a simple model. Nevertheless, the original formulation suffers two deficiencies which we wish to correct here.
-
1.
Since is a universal constant, it does not account for the different behaviors of individual liquids. However, these differences largely account for the scatter which results in theoretical errors of up to in the entropy.
-
2.
Since does not depend on or , the consistent contribution to all other thermodynamic functions is zero. But we now know that the transit contribution to internal energy at melt is around , and this energy must be included to get a good theoretical value of the melting temperature .
To correct these deficiencies, we must account explicitly for the and dependences of .
To this end, in Sec. II we extend the original analysis of experimental high-temperature entropy data to normal and anomalous melting elemental liquids. We find that all the data for at constant volume can be fitted to a single curve, providing a scaling formula for the and dependences of . The fitting yields values for each liquid of the vibrational characteristic temperature and of a new transit characteristic temperature . The original “universal entropy constant” has a role in the present formulation, where it is expected to vary weakly with , and also to vary weakly among the elemental liquids.
In liquids, as in all condensed matter systems, the potential energy that governs the nuclear motion is the electronic ground state energy as a function of nuclear positions Born and Huang (1954); Wallace (2002). Hence the parameters in the liquid dynamics Hamiltonian can be calculated from electronic structure theory. Over the years, pseudopotential perturbation theory for nearly-free-electron (NFE) liquids has been extremely useful in the study of liquid dynamics for real liquids Harrison (1966); Ashcroft (1966); Faber (1972); Ashcroft and Stroud (1978); March (1990). This is the basis of a series of tests of V-T theory for liquid Na De Lorenzi-Venneri et al. (2008); Wallace and Clements (1999); Clements and Wallace (1999); Chisolm et al. (2001); De Lorenzi-Venneri and Wallace (2007). Extension of this principle beyond NFE liquids, by means of density functional theory (DFT), is the subject of Sec. III. First, V-T theory for the entropy of melting is reviewed, and a single equation covering normal and anomalous melting is derived. Results from a new method Bock et al. (2008); Holmström et al. , using DFT to calculate the vibrational parameters, are then applied to test the V-T theory of entropy for Na and Cu. Ab initio techniques are currently being applied to a wide range of liquid dynamics studies, and their potential in testing and developing V-T theory is noted. In Sec. IV, broader application of the present reformulation of the transit entropy is described. The verification of V-T theory provided by the present ab initio test is also discussed.
II Analysis of experimental entropy data
In V-T theory, the liquid entropy is given by
| (1) |
describes the nuclear motion in a single random valley harmonically extended to infinity. In classical statistical mechanics,
| (2) |
The characteristic temperature is given by
| (3) |
where is the average over the vibrational normal mode frequencies . The quantum corrections to Eq. (2) are straightforward Wallace (2002), and are negligible in the present analysis. represents the transit motion of the nuclei. represents the excitation of electrons from their ground state with nuclear positions fixed at a random structure. Two small contributions, neglected here, express anharmonicity of the vibrational motion and the interaction between nuclear motion and electronic excitations (Wallace (2002), Sec. 4).
The experimental data are at ambient pressure, where the volume increases with temperature. It is most helpful to remove the volume dependence of the experimental data, by correcting to , where is the fixed volume of the liquid at melt. At fixed volume, the parameters of our analysis are simply constants. With , where is the thermal expansion coefficient and is the isothermal bulk modulus, the correction to second order is
| (4) |
where . For a given liquid the analysis requires highly accurate experimental data for the entropy and its first volume correction, at a significant range of temperatures above . The liquids satisfying this requirement are ten NFE metals. These are listed in Table 1, along with , the highest temperature of our analysis , and references for the experimental data.
| Element | (K) | (K) | References | (K) | (K) | () | () |
|---|---|---|---|---|---|---|---|
| Na | Gol’tsova (1966); Trelin et al. (1966); Shaw and Caldwell (1985); Hultgren et al. (1973) | ||||||
| K | Trelin et al. (1966); Shpil’rain et al. (1985); Shaw and Caldwell (1985); Chase, Jr. et al. (1985) | ||||||
| Rb | Shaw and Caldwell (1985); Vargaftik et al. (1977); Chase, Jr. et al. (1985) | ||||||
| Cs | Shaw and Caldwell (1985); Vargaftik et al. (1977); Chase, Jr. et al. (1985) | ||||||
| Al | Brandes (1983); Miller (1952); Chase, Jr. et al. (1985); Tsu et al. (1982) | ||||||
| Pb | Gitis and Mikhailov (1966); Brandes (1983); Miller (1952); Hultgren et al. (1973) | ||||||
| In | Almond and Blairs (1980); Hultgren et al. (1973) | ||||||
| Hg | Spetzler et al. (1975); Hultgren et al. (1973) | ||||||
| Sn | Gitis and Mikhailov (1966); Brandes (1983); Hultgren et al. (1973) | ||||||
| Ga | Köster et al. (1970); Hultgren et al. (1973) |
The second volume correction is negligible until the first volume correction reaches a magnitude around . The second volume correction is calculated for Hg, since the data are sufficient for this purpose Spetzler et al. (1975). For the alkali metals, the second volume correction is estimated from experimental data in the vicinity of the melt curve Makarenko et al. (1977). For the remaining five liquids, the highest temperature is such that the second volume correction can be neglected.
The analysis will now be confined to the volume , and the corresponding notation will be suppressed. The first step is to find from , using Eq. (1) in the form
| (5) |
is calculated from free electron theory in the leading Sommerfeld expansion. This is sufficiently accurate for the liquids studied here, because throughout the analysis. is calculated from Eq. (2) with an initial choice for . At this point, eight curves of vs. have clear maxima, with the exceptions being Pb and Ga. For the eight, the temperature at the maximum is denoted , and we graph vs. . The curves look like they will fall on a single line if they are shifted by various constants in . This is done by varying , since a change in changes by a constant [Eqs. (2) and (5)]. To bring the curves together, a common value for the maximum of is needed. We choose , the universal entropy constant of the original V-T formulation. All ten liquids, including Pb and Ga, can be shifted to lie on a single smooth curve, as shown in Fig. 1.
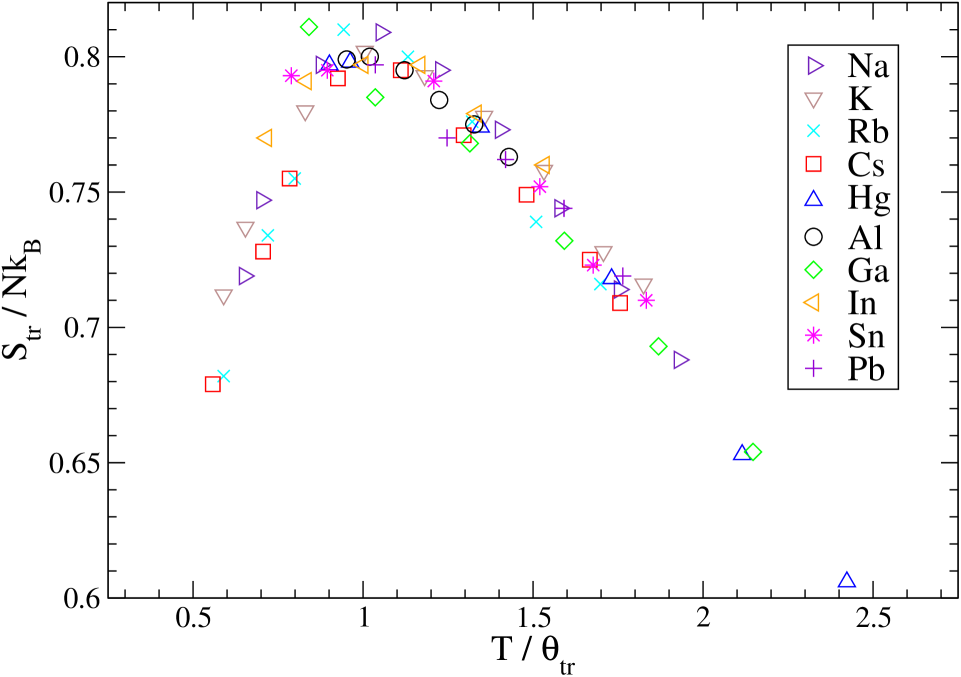
In this analysis, the actual data for for each liquid is a set of points with small scatter. Therefore, placing the ten data sets on a single curve is not a precise operation. But the scatter is so small that this imprecision is negligible. The fitted values of and are listed in Table 1. The total nuclear motion entropy is
| (6) |
To show its magnitude, is also listed in Table 1.
Aside from experimental data, the information used in the analysis is Eqs. (1)-(3), plus the constraint that all the curves must have a common maximum of at . For each liquid, this information plus the parameters and constitute a fit of the experimental entropy data at volume . However, we do not expect a precise common maximum to hold for all monatomic liquids, nor do we expect this maximum to be volume independent. For a more quantitative analysis of this issue, we turn next to the entropy of melting.
III Testing V-T theory
III.1 Theory for the entropy of melting
The experimental information relating to the universality of the transit entropy is the entropy of melting. To use this information we need to express the entropy of melting theory in terms of the entropy formulation of Sec. II. To keep the notation simple we shall continue with our standard notation for the liquid, and use a superscript to denote the crystal. Hence and are the entropy of the liquid and crystal respectively, and is the liquid volume at the melting temperature . The measured constant-pressure entropy of melting, corrected so that both crystal and liquid have the same volume , is
| (7) |
For all the normal melting elements for which accurate experimental data are available to determine this quantity, the mean and standard deviations are Wallace (2002, 1991); del_Tl
| (8) |
The distribution is essentially the same when is evaluated at the crystal volume , so the volume dependence is weak. Among the elements for which accurate experimental data are available, six do not belong to this distribution and are called anomalous. Their values of in units of are (Sn), (Ga), (Sb), (Bi), (Si), and (Ge). The anomalous are not only larger than the normal value, they are much larger. As a fiducial for elemental metals, the liquid entropy at melt is . In comparison, experimental error is , the width of the normal distribution is very small at , and the anomalous is very large at .
To rationalize these experimental results, we shall write the V-T equation for . The crystal entropy, with classical harmonic vibrations, is
| (9) |
| (10) | |||||
In normal melting, there is no significant change in the electronic structure, so that the internuclear forces are nearly the same in liquid and crystal, and so is the electronic density of states. Hence and , so that from Eq. (10), . It then follows from Eq. (8) that
| (11) |
for normal melting elements.
In contrast, anomalous melting is accompanied by a change in the electronic structure. Si and Ge melt from covalent crystal to metallic liquid (Glazov et al. (1969), Chap. 3), while Sb and Bi melt from semimetal crystal to metallic liquid (Faber (1972), p. 81). For Sn and Ga, the electronic structure change upon melting becomes apparent through compression. Si, Ge, Sb, and Bi all have a triple point on the melt curve at modest compression Young (1976), and so do Sn and Ga Young (1976); Jayaraman et al. (1963). The interpretation is that compression drives a relative shifting of electronic bands, the shift being continuous with compression for the liquid, but being concentrated at the crystal-crystal transition in the solid. Hence the melting is anomalous in the vicinity of a triple point. The classic example is Cs Jayaraman et al. (1967); Yamashita and Asano (1970); McWhan et al. (1974), where melting is normal at ambient pressure, but becomes anomalous under compression when the triple point is approached (Wallace (2002), Fig. 26.5).
Because of the change in electronic structure, the internuclear forces and electronic density of states are significantly different between liquid and crystal. Hence in addition to the normal on the right hand side of Eq. (10), the terms in nuclear vibration and electronic excitation are both important. These terms have positive sum because melting is entropy driven, and the term in is usually dominant.
Let us apply these results to Fig. 1. Equation (11) holds for normal melting, and since changes little between and , according to Fig. 1, for normal melting elements. But this is a purely liquid quantity, independent of the melting process, so this relation should be valid for monatomic liquids in general. Let us denote this common maximum , a function of volume. The above argument suggests
| (12) |
In Fig. 1, the approximation is taken to be an equality. In principle, is a material parameter, but as the following test shows, we are not yet able to resolve specific material dependence.
III.2 Testing through ab initio calculations
The test reported here is the comparison of from ab initio calculations with results from the analysis of experiment for Na and Cu. The technique Bock et al. (2008); Holmström et al. calculates the electronic ground state by DFT (using the VASP code VAS ) for a system of atoms in a cubic cell, with periodic boundary conditions on the nuclear positions. The system is quenched to a structure, where the frequencies and eigenvectors of the normal vibrational modes are calculated, and is evaluated from Eq. (3). The eigenvalues (mass times squared frequencies) are always positive, except for the three expressing translation, which are zero to numerical accuracy. The structures found are numerically dominated by random ones. Each calculation is done at the density of the liquid at melt, and (DFT) is listed in Table 2.
| Liquid | (g/cm3) | (DFT) (K) | (expt) (K) |
|---|---|---|---|
| Na | |||
| Cu |
Table 2 also lists (expt), which is from Table 1 for Na. For Cu, with insufficient data for the analysis of Sec. II, (expt) is estimated separately. The estimation procedure is general and is outlined for Cu in Appendix B. The agreement between theory and experiment in Table 2 is certainly better than we should expect.
The application of DFT to liquid dynamics research is currently making notable progress. From ab initio MD, melting properties of Si have been calculated by Sugino and Car Sugino and Car (1995), and Wang et al. Wang et al. (2005) calculated the carbon phase diagram. This work points to the possibility of an ab initio test of Eq. (10) for anomalous melting. High pressure melting curves have been calculated for Pb by Cricchio et al. Cricchio et al. (2006) and also for Ta by Taioli et al. Taioli et al. (2007). In each case the shape of suggests normal melting, and this again can be tested by calculating the quantities in Eq. (10). Kresse’s summary of DFT calculations of the static structure factor and pair distribution function for group IIIB-VIB elements shows better results for metallic than nonmetallic liquids Kresse (2002). While the metallic liquids should be well described by random valleys, the molecular character of As, Se, and Te, possessing strong and weak bonds, poses a challenge regarding the underlying potential energy surface. A similar challenge is posed by Ge, whose ab initio static and dynamic structure factors compare well with experiment as shown by Chai et al. Chai et al. (2003), and whose primarily metallic liquid appears to have some tetrahedral coordination in its fluctuation spectrum at .
The example of highly compressed Na has attracted much attention. It was predicted from theory by Neaton and Ashcroft Neaton and Ashcroft (2001) that under compression crystalline Na will transform to low symmetry structures that include semimetallic behavior, and tend ultimately to semiconducting. Experiments by Hanfland et al. Hanfland et al. (2002) and Syassen Syassen (2002) confirmed the structural changes to GPa, and work by Gregoryanz et al. Gregoryanz et al. (2005) revealed a change from normal to anomalous melting. This was in turn confirmed by ab initio MD calculations by Raty et al. Raty et al. (2007), which also showed that the liquid undergoes electronic structure changes analogous to those in the solid. We notice that the anomalous melting regime in Na involves and electrons entering the valence, and is related theoretically to the sequence of anomalous melting elements Sn, Ga, Sb, and Bi mentioned in Sec. III.1.
A novel theoretical technique uses Monte Carlo perturbation theory to make accurate first principles calculations of the liquid free energy at arbitrary temperatures Greeff and Lizárraga (2007); Greeff (2008). This technique, as well as ab initio MD, will make possible more accurate tests of V-T theory than we can obtain through analysis of experimental data, as in the present study.
IV Discussion and conclusions
In this work, we are able to improve the formulation of the transit contribution to thermodynamic functions, and to carry out an ab initio test of the V-T theory of liquid entropy. The broad implications of these results will be discussed.
IV.1 Transit contribution to thermodynamics
In the original formulation, transits are accounted for through the multiplicative factor in the partition function, where is calibrated from entropy of melting data. Hence the transit free energy is , the transit entropy is the universal constant , still a good approximation, but the transit internal energy is zero. Now, in Sec. II, the experimental high-temperature entropy data are analyzed, and Fig. 1 is found for at constant . In principle one can integrate the constant-volume relation to find up to a volume-dependent constant of integration. We then have the transit free energy to replace our original in the liquid free energy. This accomplishes the goal set out in the Introduction, and provides in principle the transit contribution to every thermodynamic function.
The shape of the transit entropy curve in Fig. 1 can be understood from qualitative properties of transits. At very low temperatures () the system freezes into a single random valley and becomes an amorphous solid. The motion is entirely vibrational, there are no transits, and , as is the corresponding . Upon warming, transits begin at a given temperature and both and increase from zero. This behavior is seen in MD simulations of supercooled liquid Na, where the mean potential energy increases from its pure vibrational value of at around K (Wallace and Clements (1999), Fig. 4). This is confirmed as a transit effect by observing that self diffusion increases from zero at approximately the same temperature (Wallace and Clements (1999), Fig. 10). With increasing temperature, and saturate and have zero slope at the common temperature . The reason for the saturation of and , and their subsequent decrease with increasing , is the truncation of the random valley potential surface at the intervalley intersections. A model for part of this decrease, the boundary effect, has been applied to the high-temperature specific heat of Hg Wallace (1998). Now we have more information than specific heat data, since Fig. 1 shows both the low- increase and high- decrease of the transit entropy. Figure 1 explains the previously disorganized behavior of liquid specific heat curves (Wallace (1998), Fig. 2). Figure 1 will be helpful in modeling the statistical mechanics of transits, and especially in modeling the transit free energy.
In the past we have used as a scaling temperature for liquid properties. This is not satisfactory in principle, because depends partially on properties of the crystal. Not surprisingly, utterly fails as a liquid scaling temperature for anomalous melting elements (Wallace (1991), Figs. 3 and 4). We now have a two-component theory for the nuclear motion entropy, where each component has its independent scaling temperature, for and for . This is a purely liquid theory, with no parametric dependence on crystal properties.
IV.2 Ab initio testing of V-T theory
At the time of the original formulation Wallace (1997), no potential energy property of any random valley had been calculated. Indeed, the existence of the random and symmetric classes of valleys, and their contrasting potential energy properties, was only hypothesized in that first paper. At the time, we adopted the approximation for normal melting elements, since was available from force-constant models calibrated to experimental dispersion curves Schober and Dederichs (1981). This is still a respectable approximation, probably accurate to on average for normal melting elements (but not for anomalous melting elements; see Chisolm and Wallace (2004), Tables I and II). But now, with ab initio values of , the correct theoretical can be calculated from Eq. (2) and compared with extracted from experiment. This is essentially the comparison made in Sec. III.2. But that comparison goes much deeper than a casual glance would suggest. That test provides the following extensive support of V-T theory.
-
1.
The test verifies the original hypothesis that the random valleys are numerically dominant and hence account for the entire statistical mechanics as , and that the random valleys are uniform in their potential properties so that a single example is sufficient as . The verification results from the fact that a single random valley is used for the calculation of for each liquid, while the experiment samples enormous numbers of valleys of all types.
-
2.
The test verifies that vibrational motion in a harmonically extended random valley is the correct theory for that part of the experimental entropy which is identified with . This is because that part of the experimental entropy is reproduced by ab initio evaluation of Eq. (2) over the entire temperature range of the available experimental data for each liquid tested.
-
3.
The test is consistent with for Na and Cu. The expected material dependence of is a refinement remaining for future work.
V-T theory is unique in that it offers a Hamiltonian theory capable of unifying equilibrium and nonequilibrium theories of liquid dynamics. Further testing will help to develop a robust theory. Techniques currently being applied in ab initio simulations can be employed to advantage in the development of V-T theory.
Appendix A Error estimates
Error in arises from experimental error in the high- entropy data, and the experimental error in the volume correction. We estimate the mean of each error over the range from to , and add their magnitudes to obtain the total mean experimental error , as listed in Table 1. Much of this error is already present in the data for . The remaining error is -dependent and has an average around zero for each liquid. This error is large enough to cause a noticeable error in the shape of Fig. 1.
The relative experimental error in is , and is almost entirely due to . From Eq. (2) it follows that
| (13) |
This gives a range of for the experimental error in in Table 1. The error in is entirely due to the -dependent error, because depends on the shape of the curve and not on its magnitude. The error in in Table 1 can reach .
Moments of the frequency distribution can be calculated from DFT to an accuracy of for elemental crystals. These crystal calculations are done in the infinite lattice model Born and Huang (1954), where an arbitrary number of Brillouin-zone -points is possible. In contrast, the liquid system has only normal models for an -atom system. Because of the small system size () for our DFT calculations, the present error in is allowed as .
Appendix B Estimation of scaling temperatures for Cu
The slope of is , the transit contribution to the specific heat, which can be found from data as follows. The experimental specific heat at constant volume is , while the vibrational contribution in classical statistical mechanics is , so that . Matching this quantity, with error estimates, to the slope of a smooth curve fitted to Fig. 1 yields in the range for Cu at . Then Fig. 1 implies that is . From experimental entropy data for Cu, , so that , giving K. For Cu, is just the estimated experimental entropy error at , namely .
This method becomes inaccurate when is large. For a compilation of for elemental liquids at melt, see Wallace (1997).
Acknowledgements.
For many helpful discussions and insights we thank Brad Clements, Giulia De Lorenzi-Venneri, Carl Greeff, Erik Holmström, and Travis Peery. This work was supported by the U. S. DOE under Contract No. DE-AC52-06NA25396.References
- Boltzmann (1872) L. Boltzmann, Wien. Ber. 66, 275 (1872).
- Born and Huang (1954) M. Born and K. Huang, Dynamical Theory of Crystal Lattices (Clarendon Press, Oxford, 1954).
- Born and von Karmen (1912) M. Born and Th. von Karmen, Phys. Z. 13, 297 (1912).
- Wallace (1997) D. C. Wallace, Phys. Rev. E 56, 4179 (1997).
- (5) Macroscopic equivalence applies to one liquid at one density. Statistical properties of random valleys vary with density, and vary from one liquid to another.
- Wallace (2002) D. C. Wallace, Statistical Physics of Crystals and Liquids (World Scientific, New Jersey, 2002).
- De Lorenzi-Venneri et al. (2008) G. De Lorenzi-Venneri, E. D. Chisolm, and D. C. Wallace, Phys. Rev. E 78, 041205 (2008).
- Harrison (1966) W. A. Harrison, Pseudopotentials in the Theory of Metals (W. A. Benjamin, New York, 1966).
- Ashcroft (1966) N. W. Ashcroft, Phys. Lett. 23, 48 (1966).
- Faber (1972) T. E. Faber, Theory of Liquid Metals (Cambridge University Press, Cambridge, 1972).
- Ashcroft and Stroud (1978) N. W. Ashcroft and D. Stroud, Solid State Phys. 33, 1 (1978).
- March (1990) N. H. March, Liquid Metals: Concepts and Theory (Cambridge University Press, Cambridge, England, 1990).
- Wallace and Clements (1999) D. C. Wallace and B. E. Clements, Phys. Rev. E 59, 2942 (1999).
- Clements and Wallace (1999) B. E. Clements and D. C. Wallace, Phys. Rev. E 59, 2955 (1999).
- Chisolm et al. (2001) E. D. Chisolm, B. E. Clements, and D. C. Wallace, Phys. Rev. E 63, 031204 (2001).
- De Lorenzi-Venneri and Wallace (2007) G. De Lorenzi-Venneri and D. C. Wallace, Phys. Rev. E 76, 041203 (2007).
- Bock et al. (2008) N. Bock, T. Peery, E. D. Chisolm, G. De Lorenzi-Venneri, D. C. Wallace, E. Holmström, and R. Lizárraga, Bull. Am. Phys. Soc. 53(2), J9:00004 (2008).
- (18) E. Holmström, N. Bock, T. Peery, R. Lizárraga, G. De Lorenzi-Venneri, E. D. Chisolm, and D. C. Wallace, unpublished.
- Wallace (1991) D. C. Wallace, Proc. R. Soc. London, Ser. A 433, 615 (1991).
- Gol’tsova (1966) E. I. Gol’tsova, High Temp. 4, 348 (1966).
- Hultgren et al. (1973) R. Hultgren, P. D. Desai, D. T. Hawkins, M. Gleiser, K. K. Kelley, and D. D. Wagman, Selected Values of the Thermodynamic Properties of the Elements (ASM, Metals Park, OH, 1973).
- Shaw and Caldwell (1985) G. H. Shaw and D. A. Caldwell, Phys. Rev. B 32, 7937 (1985).
- Trelin et al. (1966) Yu. S. Trelin, I. N. Vasil’ev, V. B. Proskurin, and T. A. Tsyganova, High Temp. 4, 352 (1966).
- Chase, Jr. et al. (1985) M. W. Chase, Jr., C. A. Davies, J. R. Downey, Jr., D. J. Frurip, R. A. McDonald, and A. N. Syverud, J. Phys. Chem. Ref. Data Suppl. No. 1 14, 61 (1985).
- Shpil’rain et al. (1985) E. E. Shpil’rain, K. A. Yakimovich, V. A. Fomin, S. N. Skovorodjko, and A. G. Mozgovoi, in Handbook of Thermodynamic and Transport Properties of Alkali Metals, edited by R. W. Ohse (Blackwell, London, 1985), p. 435.
- Vargaftik et al. (1977) N. B. Vargaftik, V. F. Kozhevnikov, V. G. Stepanov, V. A. Alekseev, and Y. F. Ryzhkov, in Seventh Symposium on Thermophysical Properties, edited by A. Cezairliyan (ASME, New York, 1977), p. 926.
- Brandes (1983) E. A. Brandes, Smithells Metals Reference Book (Butterworths, London, 1983).
- Miller (1952) R. R. Miller, in Liquid Metals Handboook, 2nd ed., edited by R. N. Lyon (U. S. Government Printing Office, Washington, D. C., 1952), p. 38.
- Tsu et al. (1982) Y. Tsu, H. Suenaga, K. Takano, and Y. Shiraishi, Trans. Japn. Inst. Metals 23, 1 (1982).
- Gitis and Mikhailov (1966) M. B. Gitis and I. G. Mikhailov, Sov. Phys. Acoust. 11, 372 (1966).
- Almond and Blairs (1980) D. P. Almond and S. Blairs, J. Chem. Thermodyn. 12, 1105 (1980).
- Spetzler et al. (1975) H. A. Spetzler, M. D. Myer, and T. Chan, High Temp. - High Press. 7, 481 (1975).
- Köster et al. (1970) H. Köster, F. Hensel, and E. U. Franck, Ber. Bunsenges. Phys. Chem. 74, 43 (1970).
- Makarenko et al. (1977) I. N. Makarenko, A. M. Nikolaenko, and S. M. Stishov, Inst. Phys. Conf. Ser. 30, 79 (1977).
- (35) In the years between Wallace (1991) and Wallace (2002), we realized that Tl should be removed from the analysis because available crystal data are for hcp, while melting proceeds from bcc. This changes the average insignificantly, from to .
- Glazov et al. (1969) V. M. Glazov, S. N. Chizhevskaya, and N. N. Glagoleva, Liquid Semiconductors (Plenum, New York, 1969).
- Young (1976) D. A. Young, Phase Diagrams of the Elements (University of California Press, Berkeley, CA, 1976).
- Jayaraman et al. (1963) A. Jayaraman, W. Klement, Jr., and G. C. Kennedy, Phys. Rev. 130, 540 (1963).
- Jayaraman et al. (1967) A. Jayaraman, R. C. Newton, and J. M. McDonough, Phys. Rev. 159, 527 (1967).
- Yamashita and Asano (1970) J. Yamashita and S. Asano, J. Phys. Soc. Jpn. 29, 264 (1970).
- McWhan et al. (1974) D. B. McWhan, G. Parisot, and D. Bloch, J. Phys. F 4, L69 (1974).
- (42) http://cms.mpi.univie.ac.at/vasp/
- Sugino and Car (1995) O. Sugino and R. Car, Phys. Rev. Lett. 74, 1823 (1995).
- Wang et al. (2005) X. Wang, S. Scandolo, and R. Car, Phys. Rev. Lett. 95, 185701 (2005).
- Cricchio et al. (2006) F. Cricchio, A. B. Belonoshko, L. Burakovsky, D. L. Preston, and R. Ahuja, Phys. Rev. B 73, 140103(R) (2006).
- Taioli et al. (2007) S. Taioli, C. Cazorla, M. J. Gillan, and D. Alfè, Phys. Rev. B 75, 214103 (2007).
- Kresse (2002) G. Kresse, J. Non-Cryst. Solids 312-314, 52 (2002).
- Chai et al. (2003) J.-D. Chai, D. Stroud, J. Hafner, and G. Kresse, Phys. Rev. B 67, 104205 (2003).
- Neaton and Ashcroft (2001) J. B. Neaton and N. W. Ashcroft, Phys. Rev. Lett. 86, 2830 (2001).
- Hanfland et al. (2002) M. Hanfland, I. Loa, and K. Syassen, Phys. Rev. B 65, 184109 (2002).
- Syassen (2002) K. Syassen, in High Pressure Phenomena, edited by R. J. Hemley, G. Chiarotti, M. Bernasconi, and L. Ulivi (IOS, Amsterdam, 2002), p. 251.
- Gregoryanz et al. (2005) E. Gregoryanz, O. Degtyareva, M. Somayazulu, R. J. Hemley, and H. K. Mao, Phys. Rev. Lett. 94, 185502 (2005).
- Raty et al. (2007) J.-Y. Raty, E. Schwegler, and S. A. Bonev, Nature (London) 449, 448 (2007).
- Greeff and Lizárraga (2007) C. W. Greeff and R. Lizárraga, Shock Compression of Condensed Matter - 2007, AIP Conf. Proc. No. 955 (AIP, New York, 2007), p. 43.
- Greeff (2008) C. W. Greeff, J. Chem. Phys. 128, 184104 (2008).
- Wallace (1998) D. C. Wallace, Phys. Rev. E 57, 1717 (1998).
- Schober and Dederichs (1981) H. Schober and P. H. Dederichs, in Landoldt-Bornstein New Series Vol. 13a, edited by K.-H. Hellwege (Springer, Berlin, 1981).
- Chisolm and Wallace (2004) E. D. Chisolm and D. C. Wallace, Phys. Rev. E 69, 031204 (2004).