Dust detection by the wave instrument on STEREO:
nanoparticles picked up by the solar wind?
Abstract
The STEREO wave instrument (S/WAVES) has detected a very large number of intense voltage pulses. We suggest that these events are produced by impact ionisation of nanoparticles striking the spacecraft at a velocity of the order of magnitude of the solar wind speed. Nanoparticles, which are half-way between micron-sized dust and atomic ions, have such a large charge-to-mass ratio that the electric field induced by the solar wind magnetic field accelerates them very efficiently. Since the voltage produced by dust impacts increases very fast with speed, such nanoparticles produce signals as high as do much larger grains of smaller speeds. The flux of 10-nm radius grains inferred in this way is compatible with the interplanetary dust flux model. The present results may represent the first detection of fast nanoparticles in interplanetary space near Earth orbit.
keywords:
Plasma Physics; Solar Wind; Waves, Plasma1 Introduction
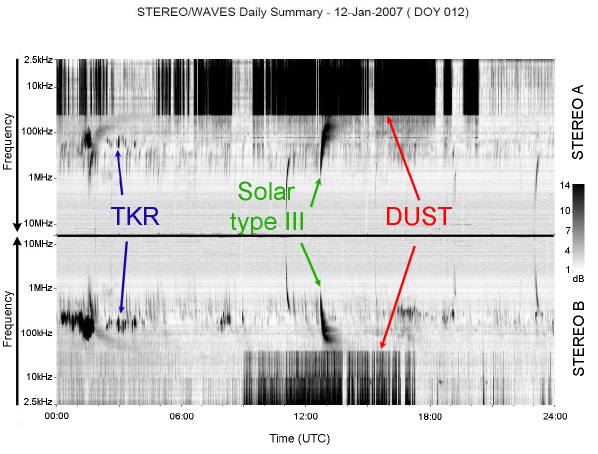
The wave instrument [Bougeret et al., 2008] on the STEREO spacecraft was designed to study solar radio emissions and solar wind plasma waves. It also detects frequent wave bursts that cannot be explained with the known solar wind plasma emissions (Figure 1). The spectral shapes of these events are similar to those first recognised as dust impacts in Saturn’s G ring on Voyager (Aubier et al., 1983; Gurnett et al., 1983) and then observed in many other environments (see a review in Meyer-Vernet 2001), which have been mainly interpreted by impacts of micron-sized dust moving at Keplerian speeds. Basically, the energy dissipated upon impact vaporises and partly ionises the grain as well as a part of the target’s material [Drapatz and Michel, 1974]. This produces an expanding plasma cloud whose residual charge induces an electric pulse which is detected by the antennas - a process akin to that used by grain mass spectrometers in space [Göller and Grün, 1989].
If these STEREO wave burst observations in the solar wind at 1 AU were produced by impacts of micron-sized grains [Kaiser et al., 2007], the observed impact rate and signal amplitude would imply a flux exceeding that suggested by the interplanetary dust model by about four orders of magnitude. On the other hand, the observed impact rate is consistent with particles of much smaller size - in the nano-meter range, which are much more numerous since the interplanetary flux is expected to increase fast as mass decreases (Figure 5).
We hence study whether impacts of nanoparticles on the spacecraft can produce such wave signals. That this is indeed the case is suggested by a recent analysis of the wave data acquired on the spacecraft Cassini in the solar wind during the Jupiter fly-by, which are consistent with impacts of high speed nanoparticles detected simultaneously by the on-board dust analyzer [Meyer-Vernet et al., 2009]. The latter nanoparticles move fast because they have a very large charge-to-mass ratio, so that the jovian corotational electric field accelerates them very efficiently. And since the charge released upon impact on the spacecraft increases very fast with speed, they produce wave pulses as high as do much larger grains moving more slowly.
We here propose that the numerous voltage pulses observed on STEREO are also produced by impacts of high speed nanoparticles. The micrometer-sized dust mentioned above is mainly affected by the gravitational force and moving on roughly Keplerian orbits, so that the impact speeds onto the spacecraft are of the order of a few 10 km s-1. The smaller dust particles in the 0.1 to 1 micrometers range - the so-called meteoroids, are affected by the solar radiation pressure and ejected at speeds of the order of several 10 km s-1 [Wehry and Mann, 1999]. On the other hand, for particles of size below about 10 nm the Lorentz force is dominant, and the gyrofrequency is much greater than the orbital frequency. In this case the final velocity of ejected particles is of the order of magnitude of the solar wind speed [Mann, Murad, and Czechowski, 2007].
The acceleration process is similar to that of freshly produced ions in the solar wind [Luhmann, 2003], which produces pickup ions from interstellar gas [Möbius et al., 1985] and from dust interaction with the solar wind [Geiss et al., 1995]. The nano particles are produced by collisional fragmentation of the larger dust particles and their production rate increases with increasing dust number density and dust relative velocities toward small distances from the Sun.
In the following we describe these STEREO wave observations and estimate the signal expected from dust impacts. We then estimate the speed expected for nano particles and derive their charge production upon impact onto a target. We finally deduce an average flux of nano particles from the observed voltage spectral density and show that this flux is close to the order of magnitude predicted by the model distribution of interplanetary dust at 1 AU. Unless otherwise indicated, units are SI.
2 Wave observations
The spacecraft STEREO A and B travel close to Earth’s orbit, respectively ahead and behind, at angular distances increasing by /year. The S/WAVES instrument measures separately the waveform and the power spectral density of the voltage [Bougeret et al., 2008] at the ports of three 6-m antenna booms [Bale et al., 2008].
The antennas have an asymmetric configuration, with the three mutually orthogonal booms (X, Y, Z on Figure 2) mounted on a corner of the anti-sunward face of the spacecraft, at about to the Sun-spacecraft line. Thus a large part of the Z boom, which extends along the anti-sunward face, lies in the wake of the spacecraft, whereas the X and Y booms extend respectively close to and far from the spacecraft. This configuration also produces an asymmetry between both spacecraft, since the booms are mounted close to respectively the orbital ram and rear face for STEREO A and B. Hence, since orbital motion tilts the wake axis with respect to the sun-spacecraft line, the parts of the X and Y booms closest to the spacecraft are respectively outside and within the wake for STEREO A and B. As a result, there is only one boom that is both close to the spacecraft and fully outside the wake: the X-boom, and this occurs only on Stereo A; this is also the boom that shows the largest wave pulses.
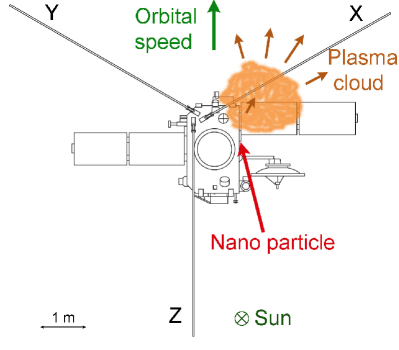
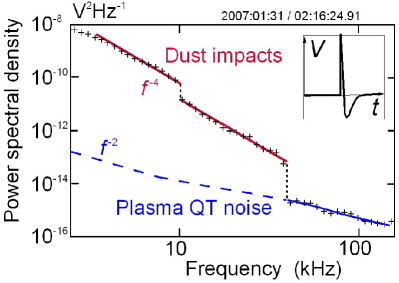
Figure 1 shows typical spectrograms exhibiting voltage pulses, and Figure 3 shows an example of the power spectral density recorded on the low-frequency receiver with the X-Y dipole during periods of voltage pulses on STEREO A. The insert contains a typical waveform recorded by the time-domain sampler of the instrument; note that simulations have shown that the observed undershoot of the pulse should be produced by instrumental filtering.
The low-frequency receiver consists of three 2-octave frequency bands which are sequentially connected to the antennas, with acquisition times inversely proportional to the mid-band frequency. The observed power spectrum has a shape which flattens at lower frequencies - a generic behaviour for pulses of rise time greater than , as observed in previous dust detections by wave instruments (Meyer-Vernet, 2001, and references therein). The amplitude often exhibits a discontinuity at the low end of the middle band, whose response is affected by the non-stationarity of the dust signal because of the short acquisition time. The acquisition time of the higher band is still shorter, so that it is not much affected by dust impacts and thus shows the ubiquitous plasma quasi-thermal noise in the solar wind, plus the shot noise due to photoemission and ambient electron impacts [Meyer-Vernet and Perche, 1989].
For pulses of rate , maximum amplitude , and rise time , the theoretical power spectrum can be shown to be
| (1) |
at frequencies much greater than the pulses’ inverse decay time [Meyer-Vernet, 1985], where the angular brackets stand for averaging over the pulses detected during the acquisition time. Comparison with (1) of the observed spectral shape in the lower band (which has the greatest acquisition time) shows that on average during these events on STEREO A, we have
| (2) |
at the preamplifier input, taking into account the receiver gain , where the averaging involves a large number of pulses, and s.
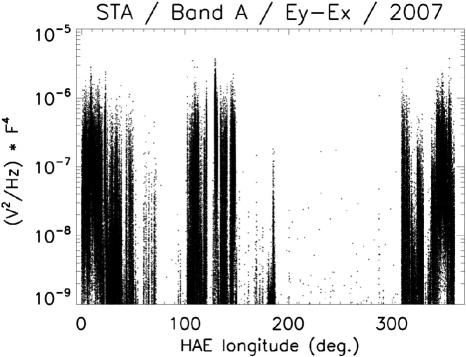
These observations are summarised in Figure 4 which shows the squared voltage observed with the X-Y dipole on STEREO A (normalised to and averaged in the lower band) as a function of ecliptic longitude in 2007. Further analysis shows that this signal is mainly due to the X boom (the Y boom signal being generally much smaller), and that the power on the Z boom is also generally smaller by at least one order of magnitude. These wave bursts are observed much less frequently on STEREO B, and with a smaller power.
3 Electric signal of dust impacts
Consider a dust grain which impacts the spacecraft, vaporises and ionises, producing an expanding plasma cloud. For a preliminary order of magnitude estimate, we model this cloud as made of elementary charges of each sign at temperature , moving and expanding at velocity ; here is a kinetic temperature, not implying thermal equilibrium. Several scales enter the problem: the cloud’s radius after time , so that the plasma density is , the cloud’s proper Debye length
| (3) |
the spacecraft size m (not including appendages), and the ambient Debye length, which depends on the impact site and geometry. The latter is m for the unperturbed solar wind, 1 m for the sunward photoelectron sheath (proportional to the inverse square root of the photoelectron yield of the sunward face), and much larger in the hot and depleted spacecraft wake, where the charge dynamics is governed by the large wake-induced negative potential.
At the beginning of the expansion, the plasma cloud is so dense that its proper Debye length is smaller than its radius , so that it remains quasi-neutral. When becomes greater than , charge decoupling occurs, so that the cloud’s electrons, of speed , can leave. From (3), one sees that this takes place when the cloud’s radius reaches the value
| (4) |
after a time . The density in the cloud is then roughly equal to , where is the cloud’s temperature in eV.
In the present case, this cloud density is generally still greater than the ambient density , and is smaller than the ambient Debye length (which results from since the cloud temperature , the ambient temperature), so that a voltage can be detected. This holds until the density in the cloud has decreased to the ambient value , which takes place when the radius of the cloud is
| (5) |
Since the spacecraft equilibrium potential is expected to be a few times the photoelectron energy, which is smaller than the solar wind electron energy, the ambient density is close to the solar wind density (except in the sunward photoelectron sheath where it is greater, and in the wake of the spacecraft where it is smaller). The scale given in (5) gives the maximum radius of the plasma cloud, which is reached at the time
| (6) |
Since the surfaces are charged positively because the ejected photoelectrons dominate the charging process in the absence of dust impacts, the electrons are easily recollected by the spacecraft of capacitance , producing a voltage pulse
| (7) |
It can be detected (with opposite sign) by a monopole antenna that measures the difference of potential between the antenna boom and the spacecraft.
For monopole antennas which are long and not very close to the spacecraft, charge recollection by the spacecraft as described above is generally the main process governing dust detection [Meyer-Vernet, Lecacheux, and Pedersen, 1996]. Since the signal is a variation in spacecraft potential, it produces similar voltages on different (symmetrical) monopole antennas. On the other hand, dipole antennas, which respond to the difference in voltage between two booms, detect spacecraft voltage pulses only via imbalances. This results in a detected voltage much smaller than . This effect was first observed by the wave experiments on the spacecraft Voyager, when the PRA instrument using monopole antennas detected much higher (and better calibrated) voltage pulses produced by dust impacts than the PWS instrument using dipoles [Meyer-Vernet, Lecacheux, and Pedersen, 1996]. Unfortunately for dust detection, most wave experiments in space are using a (symmetrical) dipolar configuration.
The case of STEREO is more complex because the antennas are very asymmetric, very short, and very close to the spacecraft - being fully within its Debye sheath, in contrast to most interplanetary probes carrying wave instruments. Hence the electric field [Oberc, 1996] induced by the plasma cloud on the antennas (and possibly the charge collection by them) is expected to play a major role, strongly dependent on the impact site and geometry. This is further complicated by the various appendages, including the large solar panels which contribute to a conspicuous wake.
The maximum cloud radius (shown to scale on Figure 2) is comparable to the spacecraft size and not much smaller than the antenna length. Therefore, for an impact on the spacecraft at a distance from the antenna closer than about , an appreciable part of the antenna - a fraction of its length, may lie within the plasma cloud. In this case the amplitude of the voltage pulse induced on an antenna boom of length is
| (8) |
with a rise time in the order of magnitude given by (6). On the other hand, if the distance of the impact site , the induced voltage is much smaller.
For the nanoparticles detected by STEREO, we have . Thus the voltage pulse produced on an antenna boom in the expanding plasma cloud is much larger than that produced on the spacecraft. Consequently, this boom will detect a pulse of large amplitude , whereas the other monopoles detect a pulse of much smaller amplitude . Hence, we will use (8) for interpreting the pulses on the X antenna of STEREO A, which are detected by the frequency receiver at the ports of the X-Y dipole.
The signal produced in this way is thus expected to be much greater than that on other spacecraft carrying wave instruments as for example Wind, Ulysses, and Cassini. Their electric antennas are symmetrical, longer, and do not extend close to the spacecraft surface, so that they detect dust grains mainly via the pulses in spacecraft potential (7), which are of much smaller amplitude than (8). Furthermore, these are detected with a much reduced amplitude in dipole mode - the most frequent configuration. This was confirmed by the recent observation of nanoparticles near Jupiter by the Cassini wave experiment [Meyer-Vernet et al., 2009].
Finally, it should be noted that the time for the cloud electrons to travel , i.e. the inverse of the cloud’s plasma frequency, is smaller than for since in general . This raises the possibility of charge oscillation in the cloud producing plasma waves, which may, however, be hampered by the fast temporal decrease of . The fast motion of the charges might also produce acoustic waves. Note, too, that the various appendages may enable ejected debris to reimpact, increasing the pulse amplitude and rise time.
4 Dust speed and released charge
To estimate the charge released upon a grain impact on the spacecraft, we must calculate the grain speed. Interplanetary dust grains are charged under the influence of photoemission, plasma impact, and secondary emission. Since photoemission is in general heavily dominant, the grains acquire a positive electric potential of several times the photoelectron energy. A grain of radius and mass density thus carries a charge and has a charge-to-mass ratio that increases fast as size decreases. For nm ( kg for kg m-3) this yields , where and are respectively the electron charge and proton mass, and the nanoparticle potential at 1 AU is V [Mukai, 1981], which is below the limit for ion field emission and for electrostatic disruption for most materials [Mendis, 2001].
With such a ratio, the Lorentz force is dominant and must be considered when calculating the dust dynamics. In order to be accelerated efficiently, the grains should have large enough that their Larmor frequency be much higher than the frequency of orbital motion. Assuming that the grains are initially released between 0.1 and 1 AU into Keplerian orbits, this can be seen to be true for , so that 10 nm or smaller grains reach a velocity of the order of solar wind velocity.
To be more quantitative, we estimated the expected velocity distributions of these particles at 1 AU from a sample of numerically calculated trajectories of grains. A simple model of the solar wind (constant radial velocity) and of its magnetic field (Parker spiral with the current sheet at constant tilt) was used in the calculations, with a solar dipole pointing south and a plasma sheet inclined by 20∘-30∘ as observed in 2007.
The initial conditions were defined by assuming that the smaller grains are produced by collisions between larger grains in the interplanetary dust cloud within 1 AU. The initial positions were distributed over the region of the circumsolar dust cloud. The charge-to-mass ratio of the nanoparticles was assumed to be constant, with a set of different values of (from to ). The Lorentz force, gravity, and Poynting-Robertson forces were taken into account in the equations of motion. The production rate of nanoparticles, estimated using the collision model and the model of the dust distribution described in Mann and Czechowski (2005), was used to define the probability weight for each trajectory in the sample.
This simulation shows that particles of , i.e. mass kg, move outward and in the prograde direction (that of the solar rotation which winds the magnetic field lines) at about 300 km s-1 near the ecliptic at 1 AU. The speed decreases for larger masses: grains with are still accelerated, but reach a lower asymptotic speed (150-200 km s-1); those with (of Larmor frequency less than the orbital frequency) do not attain high velocity, but their initial orbits are significantly disturbed. The simulations also show that the grains released within some critical distance from the Sun (0.15 AU), where the magnetic field is very close to radial, do not escape to large distances even if their is high.
The high speed of the grains increases dramatically the electric signal produced upon impact. Dust impact ionisation involves complex processes not fully included in laboratory simulations and theory at present, so that the impact generated charge is determined semi-empirically with a large uncertainty (Kissel and Krüger, 1987; Hornung and Kissel, 1994). It varies with the grain’s mass and speed typically as
| (9) |
with in Cb, in kg, in km s-1 [McBride and McDonnell, 1999]. The three coefficients in (9) depend on mass, speed, angle of incidence, as well as grain and target composition, so that may differ from this relationship by one order of magnitude.
An extrapolation of (9) suggests that a nanoparticle impacting at 300 km s-1 is equivalent (in terms of released charge ) to a grain of mass greater by 4 orders of magnitude impacting at 20 km s-1. However, firstly, a speed of 300 km s-1 - corresponding to an energy per atom of more than 10 keV (for atomic mass ) should produce strong effects outside the range of present simulations, and secondly, the grains are much smaller than those considered in the simulations. Therefore, one must verify that this extrapolation satisfies the constraint of energy conservation. Indeed, the released charge, which in that case comes essentially from the target, cannot exceed , where (in eV) is the minimum energy required to create a free ion or electron out of a solid lattice; the equality would correspond to the case when the entire energy of the impact is spent into ionisation energy. With kg, km s-1, and eV, we have Cb/kg. The charge (9) is smaller by a factor of about 40 than this upper limit, and thus amounts to an ionisation efficiency of .
5 Results and discussion
The observed values given in Section 2 then enable us to infer dust properties. We make two assumptions: first we assume that is given by (9) with calculated in Section 4, so that for kg and varies weakly with for larger masses because of the decrease in speed shown by the simulation; second we assume that the cumulative dust flux is of the form
| (10) |
(in SI units) with according to the interplanetary model in this range, so that the differential flux is and the differential impact rate contributing to the voltage power spectrum is
| (11) |
Using the pulse amplitude (8), the expressions (5) for and (6) for , and integrating the impact rate (11) over mass, we deduce
| (12) |
where we have used with m-3, is the expansion speed in km s-1, and is the minimum mass (in units of kg) taken as a lower bound of the integral over mass. The result depends very weakly on this minimum mass because of the small exponent in (12); it is not much affected either by particles of mass kg because the decrease in flux is not compensated by an increase in .
Comparing (12) with the measurement (2), and assuming , we deduce , whence the cumulative flux
| (13) |
where is the mass in units of kg. With eV and km s-1 [Hornung and Kissel, 1994], we find m-2s-1. Note that km s-1 corresponds to a kinetic energy of the expansion which is equivalent to about 2 eV or larger. The upper value of is determined by the constraints of the observed rise time and energy conservation.
The above result does not take into account the uncertainty in expression (9) for , which amounts to a factor of , given the extrapolation made and the diversity of the spacecraft surfaces (ITO-coated silver teflon perforated to the silver backing material, kapton, solar panel mylar, and a few metallic surfaces [Driesman, Hynes, and Cancro, 2008]). Since , this translates into an uncertainty in of a factor . Furthermore, the mass of kg of the detected particles is expected be uncertain by a factor of due to uncertainties in the grain mass density, electric potential, and speed. Finally, since these detections are made during roughly 10% of the STEREO A observing time, the average flux is roughly ten times smaller than the value given in (13).
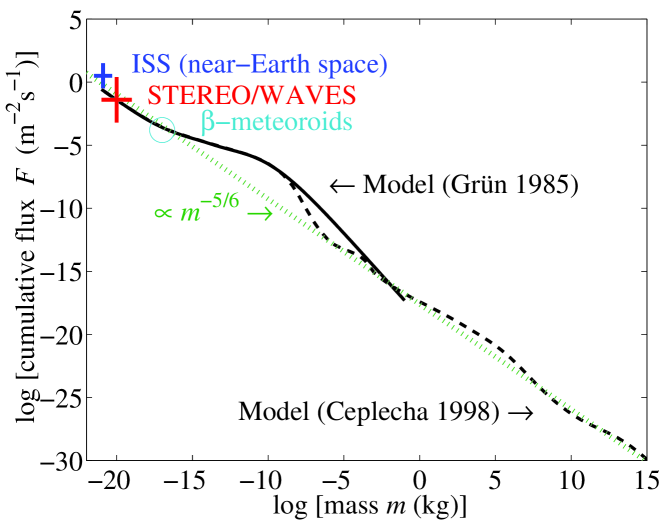
In Figure 5 we have superimposed this result on a composite model of interplanetary dust and small bodies (Grün et al., 1985; Ceplecha et al., 1998). Within the relatively large uncertainties, our result is consistent with the model. These newly found particles are difficult to detect with conventional dust detectors because they are outside their calibration range. However, a similar flux (see Figure 5) has been recently inferred in low Earth orbit on the International Space Station [Carpenter et al., 2007]. Nanoparticles have also been inferred at large distances from comet Halley [Utterback and Kissel, 1990]. Furthermore, streams of fast nanoparticles ejected from the surrounding of Jupiter [Zook et al., 1996] and Saturn [Kempf et al., 2005] have been inferred, using conventional dust detectors below their calibration range.
Following the observations described in the present paper, we have examined in detail the wave data on other spacecraft, even though the nanoparticle signals are expected to be small, as discussed in Section 3. On Cassini we have observed small voltage pulses near Jupiter that are consistent with nanoparticle impacts according to Equation (7), when the RPWS frequency receiver was connected in monopole mode. The signal strength was estimated assuming dust properties inferred from simultaneous observations with conventional dust detectors [Meyer-Vernet et al., 2009]. Similar observations in interplanetary space at various heliocentric distances are now under study.
It is noteworthy that different S/WAVES dust observations were recently reported, which have been analysed during periods when we do not detect nanoparticles. They have been shown to coincide with perturbations of the SECCHI instrument. These voltage pulses, detected with the time domain sampler, have an impact rate far too small to be observed with the frequency receiver, contrary to those reported in the present paper, and correspond to impacts of large grains of radius several microns [St. Cyr et al., 2009].
The present results are limited for several reasons. The charge produced by impacts of fast nanoparticles is only estimated via extrapolations of experimental results valid for larger particles and smaller velocities. It is essential that future laboratory and numerical simulations of dust impact ionisation include fast nanoparticles, and consider the size range intermediate between bulk materials and heavy ions. Furthermore, we cannot expect to have a clear description of the charge produced by impacts without knowing the composition of the nanoparticles. In addition, we should take into account more correctly the behaviour of the impact plasma in the complex environment of the spacecraft, and perform more detailed simulations of the response of the wave instrument to impulses. Two important questions have to be studied: the variation of the signal with time and longitude, and the sites of impacts, which depend on the direction of the impact velocities. This problem is complex because the solar wind state should affect both the dynamics of the particles (via the solar wind velocity and magnetic field along the particle trajectory) and their detection by the electric antennas (via the local solar wind density). In particular, STEREO might also detect fast nanoparticles originating from other sources than the inner solar system.
Finally, it is noteworthy that our result, which is compatible with the model of interplanetary dust at 1 AU (c.f. Figure 5), lies on a curve that spans 35 orders of magnitude in mass (green dotted line on Figure 5). This curve corresponds to a cascade of destruction and production by collisional fragmentation of objects with a cross-sectional area [Dohnanyi, 1969]. This agreement in order of magnitude supports the idea that the particles are indeed generated by collisional fragmentation from larger dust particles. The superimposed deviations to the slope are produced by other sinks and sources of particles, in particular ejection of nanoparticles.
Acknowledgements
We thank the team who conceived, designed, built, and tested the instrument, and are very grateful to P.-L. Astier for simulations of the response to transient pulses. The French part was supported by CNES and CNRS. A.C. was supported by the Polish Ministry of Science grant 4 T12E 002 30. We thank the International Space Science Institute for fostering discussions within the working group ‘Dust-plasma interactions: observations in the interplanetary medium and in the environment of solar system objects’. We are grateful to an anonymous referee for helpful comments.
References
- [Aubier, Meyer-Vernet, and Pedersen, 1983] Aubier, M., Meyer-Vernet, N., Pedersen, B.M.: 1983, Geophys. Res. Lett. 10, 5
- [Bale et al., 2008] Bale, S.D., Ullrich, R., Goetz, K., Alster, N., Cecconi, B., Dekkali, M. et al.: 2008, Space Sci. Rev. 136, 487
- [Bougeret et al., 2008] Bougeret, J.-L., Goetz, K., Kaiser, M.L., Bale, S.D., Kellogg, P.J., Maksimovic, M. et al.: 2008, Space Sci. Rev. 136, 529
- [Carpenter et al., 2007] Carpenter, J.D., Stevenson, T.J., Fraser, G. W., Bridges, J. C., Kearsley, A. T., Chater, R. J. et al.: 2007, J. Geophys. Res. 112, E08008
- [Ceplecha et al., 1998] Ceplecha, Z., Borovicka, J., Elford, W.G., Revelle, D.O., Hawkes, R.L., Porubcan, V. et al.: 1998, Space Sci. Rev. 84, 327
- [Dohnanyi, 1969] Dohnanyi, J.S.: 1969, J. Geophys. Res. 74, 2531
- [Drapatz and Michel, 1974] Drapatz, S., Michel, K.W.: 1974, Z. Naturforsh. 29a, 870
- [Driesman, Hynes, and Cancro, 2008] Driesman, A., Hynes, S., Cancro, G.: 2008, Space Sci. Rev. 136, 17
- [Geiss et al., 1995] Geiss, J., Gloeckler, G., Fisk, L. A., von Steiger, R.: 1995, J. Geophys. Res. 100, 23373
- [Göller and Grün, 1989] Göller, J.R., Grün, E.: 1989, Planet. Space Sci. 37 1197
- [Grün et al., 1985] Grün, E., Zook, H.A., Fechtig, H., Giese, R.H.: 1985, Icarus 62, 244
- [Gurnett et al., 1983] Gurnett, D.A., Grün, E., Gallagher, D., Kurth, W. S., Scarf, F. L.: 1983, Icarus 53, 236
- [Hornung and Kissel, 1994] Hornung, K., Kissel, J.: 1994, A&A 291, 1
- [Kaiser et al., 2007] Kaiser, M.L., Goetz, K., St Cyr, C., Bale, S., Maksimovic, M.: 2007, AGU Fall Meet. 2007, abstract SH52B-01
- [Kempf et al., 2005] Kempf, S., Srama, R., Horányi, M., Burton, M., Helfert, S. Moragas-Klostermeyer, G. et al.: 2005, Nature 433, 289
- [Kissel and Krüger, 1987] Kissel, J., Krüger, F.R.: 1987, Appl. Phys. A 42, 69
- [Luhmann, 2003] Luhmann, J.G.: 2003, ApJ 592, 1241
- [Mann and Czechowski (2005] Mann, I., Czechowski: 2005, ApJ 621, L73
- [Mann, Murad, and Czechowski, 2007] Mann, I., Murad, E., Czechowski, A.: 2007, Planet. Space Sci. 55, 1000
- [McBride and McDonnell, 1999] McBride, N., McDonnell, J.A.M.: 1999, Planet. Space Sci. 47, 1005
- [Mendis, 2001] Mendis, D.A.: 2001, Physica Scripta, T89, 173
- [Meyer-Vernet, 1985] Meyer-Vernet, N.: 1985, Adv. Space Res. 5, 37
- [Meyer-Vernet, 2001] Meyer-Vernet, N.: 2001, in Harris, R. A. (ed.), ESA SP-476, Proc. 7th Spacecraft Charging Technology Conf., Nordwijk: ESTEC, 635
- [Meyer-Vernet, 2007] Meyer-Vernet, N.: 2007, Basics of the Solar Wind, Cambridge University Press, p. 339
- [Meyer-Vernet and Perche, 1989] Meyer-Vernet, N., Perche, C.: 1989, J. Geophys. Res. 94, 2405
- [Meyer-Vernet, Lecacheux, and Pedersen, 1996] Meyer-Vernet, N., Lecacheux, A., Pedersen, B.M.: 1996, Icarus 123, 113
- [Meyer-Vernet et al., 2009] Meyer-Vernet, N., Lecacheux, A., Kaiser, M.L., Gurnett, D.A.: 2009, Geophys. Res. Lett. 36, L03103
- [Möbius et al., 1985] Möbius, E., Hovestadt, D. Klecker, B., Scholer, M., Gloeckler, G.: 1985, Nature 318, 426
- [Mukai, 1981] Mukai, T.: 1981, A&A 99, 1
- [Oberc, 1996] Oberc, P.: 1996, Adv. Space Res. 17, (12)105
- [St. Cyr et al., 2009] St. Cyr, O.C., Kaiser, M.L., Meyer-Vernet, N., Howard, R.A., Harrison, R.A., Bale, S.D. et al.: 2009, Solar Phys., submitted
- [Utterback and Kissel, 1990] Utterback, N. G., Kissel, J.: 1990, AJ 100, 1315
- [Wehry and Mann, 1999] Wehry, A., Mann, I.: 1999, A&A 341, 296
- [Zook et al., 1996] Zook, H. A., Grün, E., Baguhl, M., Hamilton, D. P., Linkert, G., Liou et al.: 1996, Science 274, 1501