The stellar population content of the thick disk and halo of the Milky Way analogue NGC 891
Abstract
We present deep images obtained with the Advanced Camera for Surveys on board the Hubble Space Telescope, covering three fields in the north-east side of the edge-on disk galaxy NGC 891. The observed fields span a wide range of galactocentric distances along the eastern minor axis, extending from the plane of the disk to 12 kpc, and out to kpc along the major axis. The photometry of individual stars reaches magnitudes below the tip of the red giant branch. We use the astrophotometric catalogue to probe the stellar content and metallicity distribution across the thick disk and spheroid of NGC 891.
The colour-magnitude diagrams of thick disk and spheroid population are dominated by old red giant branch stars with a wide range of metallicities, from the sparsely populated metal-poor tail at dex, up to about half-solar metallicity. The peak of the metallicity distribution function of the thick disk is at dex. The inner parts of the thick disk, within kpc along the major axis show no vertical colour/metallicity gradient. In the outer parts, a mild vertical gradient of kpc-1, or less than 0.1 dex kpc-1 is detected, with bluer colours or more metal-poor stars at larger distances from the plane. This gradient is however accounted for by the mixing with the metal poor halo stars. No metallicity gradient along the major axis is present for thick disk stars, but strong variations of about dex around the mean of dex are found. The properties of the asymmetric metallicity distribution functions of the thick disk stars show no significant changes in both the radial and the vertical directions. The stellar populations situated within the solar cylinder-like distances show strikingly different properties from those of the Galaxy populating similar distances. This suggests that the accretion histories of both galaxies have been different.
The spheroid population, composed of the inner spheroid and the halo, shows remarkably uniform stellar population properties. The median metallicity of the halo stellar population shows a shallow gradient from about dex in the inner parts to dex at 24 kpc distance from the centre, corresponding to reff. Similar to the thick disk stars, large variations around the mean relation are present.
keywords:
galaxies: formation – galaxies: halos – galaxies: stellar content –galaxies: individual (NGC 891)1 Introduction
The study of nearby spiral galaxies can provide an “external view” of galaxies similar to the Milky Way (MW), and constrain the formation of spiral galaxy halos. The last decade has witnessed a spectacular increase in the discoveries of stellar streams and accretion events in the MW and Andromeda (e.g. Ibata et al., 1994; Helmi et al., 1999; Ibata et al., 2001; Ferguson et al., 2002; Ibata et al., 2003; Yanny et al., 2003; Martin et al., 2004), showing that at least part of the stellar halos, and perhaps even disks, of these galaxies are assembled from disrupted dwarf galaxies. However, the question whether the stellar halos in galaxies are built entirely through the multiple hierarchical merging processes (a la Searle & Zinn, 1978), or rather have the majority of their mass assembled in an early dissipative collapse (Eggen et al., 1962) is still open (for the MW halo see the recent review by Helmi, 2008). The thick disks in spiral galaxies, while observationally well established in most galaxies (e.g. Gilmore & Reid, 1983; Dalcanton & Bernstein, 2002; Seth et al., 2005b; Mould, 2005), still need to be characterised better. Through the observations of resolved stellar populations, it is possible to determine the average metallicity, metallicity distribution, radial profile and the amount of substructure. These observables provide empirical constraints to the thick disk and halo formation models.
In contrast, the unambiguous detection of stellar halos in galaxies beyond the Local Group is very challenging. The expected low metallicity and the low surface brightness make the surface photometry very challenging (Morrison et al., 1997; de Jong, 2008). Extremely deep observations, and the technique of stacking of huge number of similar edge on galaxies, produced detection of faint red halos in distant galaxies (Zibetti & Ferguson, 2004; Zibetti et al., 2004). However, the study of metallicity distributions of stars in individual galaxy halos is only possible through resolved stellar photometry, which is limited by current telescopes and instruments to about 10-12 Mpc. The emerging picture is that the inner regions of halos are relatively metal-rich with extended tails to lower metallicity (Durrell et al., 2001, 2004; Mouhcine et al., 2005; Mouhcine, 2006; Mouhcine et al., 2007). Selecting stars at very large distances, and ensuring that they show halo-like kinematic signature, the metal-poor population, similar to the dominant component of the MW halo, was detected in M31 (Chapman et al., 2006; Kalirai et al., 2006). The halo of the MW has been shown to comprise two different stellar components that exhibit different chemical compositions, spatial distributions, and kinematics. This comparison between the two massive spirals of the Local Group shows the need for larger samples, and more detailed comparison with other spiral galaxies with similar structure and mass as massive galaxies in the Local Group, before general conclusions can be drawn about the formation and evolution of spiral galaxy halos.
Edge-on galaxies are the ideal targets, as this configuration permits a clear distinction between the halo, disk, and bulge, and allows for efficient search and characterisation of stellar substructures. With its high inclination ( Kregel & van der Kruit, 2005) NGC 891 is the ideal target for the study of vertical structure and stellar populations above the plane of the disk. At a distance of 9.7 Mpc (Mouhcine et al., 2007), it is the closest edge-on spiral galaxy with morphological type, disk structure and mass similar to that of the Milky Way (van der Kruit, 1984; Garcia-Burillo et al., 1992). However, it has been acknowledged in numerous studies, that it has much higher vertical extent of neutral and ionised gas structure (Garcia-Burillo et al., 1992; Scoville et al., 1993; Kamphuis et al., 2007), with a huge neutral HI halo surrounding it (Oosterloo et al., 2007; Sancisi et al., 2008).
Seth et al. (2005a) used ACS on board HST to resolve the stars in a field centred on the thin disk of NGC 891. However, the crowded inner regions observed, and the shallow images did not allow them to study the stellar population properties of the observed field in more detail. The deeper ACS images (one of the three fields presented in this work) allowed Tikhonov & Galazutdinova (2005) to resolve red giant branch (RGB) stars, determine the distance from the luminosity of the RGB tip, and discuss the RGB and asymptotic giant branch (AGB) stellar distribution along the minor axis.
In a series of papers we study in detail the structure, metallicity distribution, and stellar populations of NGC 891 using archival observations of three HST/ACS fields. In the first paper (Mouhcine et al., 2007, Paper I) we investigated the metallicity distribution of the stellar halo of NGC 891. The results of that study revealed a surprisingly high average metallicity, of dex at 9.5 kpc above the galaxy disk. This is dex more metal-rich than the Milky Way halo (e.g. Carollo et al., 2007; Ivezić et al., 2008). Ibata et al. (2009, Paper III) investigated the structure of the halo and the disk of this galaxy. Using starcounts which cover much larger area than in the work of Tikhonov & Galazutdinova (2005), we detected the thick disk with vertical scale height of kpc, and radial scale length of kpc. Moreover, in the stellar spheroid, which is well fitted with a de Vaucouleurs-like profile out to the edge of our survey at kpc, significant small-scale variations in the median colour and density are detected over the halo area. Harris et al. (2009, Paper IV) investigated the globular cluster population in the observed fields.
In this paper we present in detail the complete dataset and data reduction, the photometric catalogue, and completeness simulations. The colour-magnitude diagrams and metallicity distribution of stars are used to investigate the stellar content of the thick disk and halo of NGC 891.
2 Data and photometry
| Field Name | RA | DEC | Date | Filter | Exptime (sec) |
|---|---|---|---|---|---|
| NGC891-HALO1 | 02:22:42.70 | +42:19:42.0 | 2003-02-19 | F606W | |
| NGC891-HALO1-OFF1 | 02:22:42.74 | +42:19:42.0 | 2003-02-20 | F606W | |
| NGC891-HALO1-OFF2 | 02:22:42.74 | +42:19:42.4 | 2003-02-20 | F606W | |
| NGC891-HALO1 | 02:22:42.70 | +42:19:42.0 | 2003-02-18 | F814W | |
| NGC891-HALO1-OFF1 | 02:22:42.74 | +42:19:42.0 | 2003-02-18 | F814W | |
| NGC891-HALO1-OFF2 | 02:22:42.74 | +42:19:42.4 | 2003-02-18 | F814W | |
| NGC891-HALO2 | 02:22:49.70 | +42:22:49.0 | 2003-02-17 | F606W | |
| NGC891-HALO2-OFF1 | 02:22:49.74 | +42:22:49.0 | 2003-02-17 | F606W | |
| NGC891-HALO2-OFF2 | 02:22:49.74 | +42:22:49.6 | 2003-02-17 | F606W | |
| NGC891-HALO2 | 02:22:49.70 | +42:22:49.0 | 2003-02-16 | F814W | |
| NGC891-HALO2-OFF1 | 02:22:49.74 | +42:22:49.0 | 2003-02-16 | F814W | |
| NGC891-HALO2-OFF2 | 02:22:49.74 | +42:19:49.9 | 2003-02-16 | F814W | |
| NGC891-HALO3 | 02:22:56.60 | +42:25:54.7 | 2003-02-17 | F606W | |
| NGC891-HALO3-OFF1 | 02:22:56.64 | +42:22:54.7 | 2003-02-17 | F606W | |
| NGC891-HALO3-OFF2 | 02:22:56.64 | +42:22:55.1 | 2003-02-17 | F606W | |
| NGC891-HALO3 | 02:22:56.60 | +42:22:54.7 | 2003-02-17 | F814W | |
| NGC891-HALO3-OFF1 | 02:22:56.64 | +42:22:54.7 | 2003-02-17 | F814W | |
| NGC891-HALO3-OFF2 | 02:22:56.64 | +42:19:55.1 | 2003-02-17 | F814W |
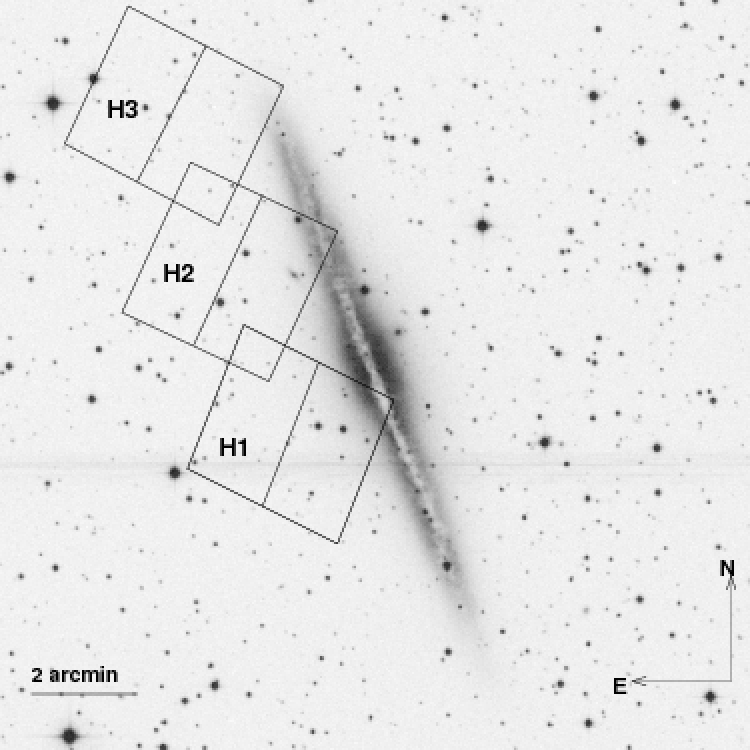
Observations of three fields (H1, H2, and H3) along the eastern edge of NGC 891 disk (Fig. 1) have been taken in February 2003 with the wide field camera (WFC) of ACS as part of programme GO-9414. The field of view of the ACS WFC is 202 square arcsec and the pixel size is 0.05 arcsec. At the distance of NGC 891 (9.7 Mpc) the field of view covers 90 kpc2, and the pixels are 2.4 pc in size.
Each field was observed with 9 exposures and 9 exposures. These HST filters, similar to ground based and bands, are often used in studies of resolved stellar populations in the halos of galaxies, where most of the sources are expected to be red giants, because of the match in the sensitivity of the filter+detector response and the emission of the sources. The observing strategy was such that for each field three sets of three exposures per filter were taken. These three triplets were dithered with sub-pixel shifts between them. Each triplet of images was taken to ensure cosmic ray rejection through the CR-split observing strategy with exposure times tuned to fit the three exposures within one orbit. The summary of the observations, with the coordinates of the centre of the pointings, exposure times, and observing dates are given in Table 1. The total integration time per filter per field is 7710 sec.
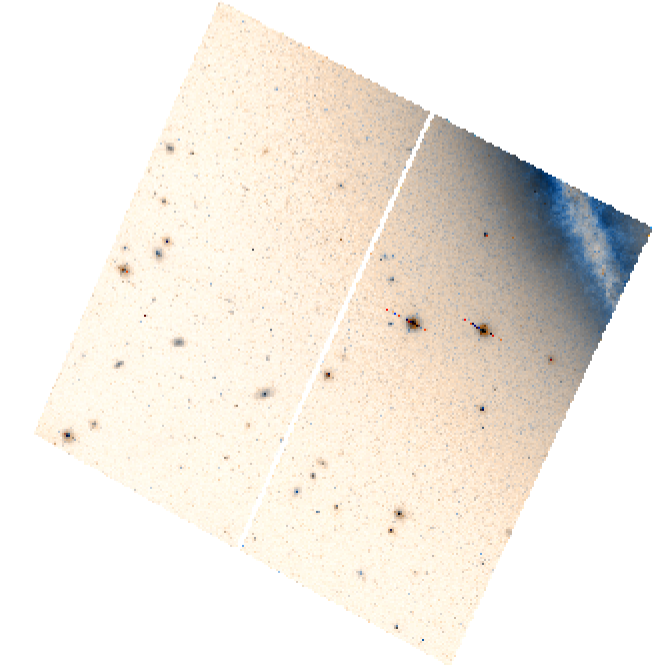
We used the flatfielded (_flt), cosmic-ray rejected (_crj), and drizzled (_drz) images produced by the “on-the-fly” reduction pipeline of the ESO/ST-ECF archive. The drizzled images obtained from the archive had combinations of only 3 CR-split exposures for each dither position. Therefore to make the deepest possible stack for each field, using the full 7710 sec exposures we run the multidrizzle (Koekemoer et al., 2002) task within the stsdas package in pyraf to combine the 9 images taken for each filter, separately for the three fields and two filters. In Fig. 2 we show the combined deep image of the H1 field.
2.1 Photometry
Due to large geometrical distortions of the ACS field of view the pixel size varies across the field resulting in incorrect photometry for point sources in flat-fielded (_flt) images. The drizzle, and multidrizzle packages have been developed to correct these distortions. However, the photometry done on the _drz images is non-optimal because the stars in different parts of the field of view are resampled in a different way by the drizzling process. Moreover, the signal in the adjacent pixels is correlated. Therefore following the recommendations of Anderson (2006) and the DOLPHOT/ACS User’s Guide (Dolphin, 2005) we decided to run the PSF fitting on the images that were not corrected for distortion. To obtain correct flux measurements for point sources these images need to be multiplied by a pixel area map (PAM) prior to PSF fitting. PAM files are available for all the filters from the Space Telescope Science Institute (STScI) web site.
PSF fitting photometry of all the stellar objects in the images was run with the DOLPHOT photometric package, which is an extension of HSTphot (Dolphin, 2000), and contains the specialised ACS module tailored for accurate PSF photometry of ACS images. It contains image preparation and processing routines that should be run prior to the dolphot PSF fitting programme in the following order. The first step is running the acsmask programme in order to mask out all the pixels flagged as bad from the data quality extension of the images, and to multiply the images with PAM files and so obtain geometrically corrected images in units of electrons. The next step of data preparation is sky measurement using the calcsky routine. Finally, the alignment between the reference image and the input images is calculated using acsfitdistort programme. The psf fitting programme dolphot is run with the UseACS flag set to 1 and the parameter file with the recommended values for the PSF radius, aperture size, sky region, and threshold for detections. The psf fitting is run simultaneously on the set of input images, where the coordinates for the fitting objects are derived from the reference image. All the parameters for the fitting, as well as the list of input images are passed through a configuration file.
Given the small overlap between the three fields, we run the photometry separately for each of the three fields. The stars detected in common in the overlap regions were used to verify the accuracy of the photometry (see below).
We have made several runs of DOLPHOT photometry: the first run used as the reference image one of the _crj images provided by the pipeline, which is the combination of only 3 out of 9 exposures for a given field, and as input data all the available _crj images. The second run was done using as the reference again single _crj image, but with _flt images in input, where each _flt image was an average of three CR-split exposures taken at the same offset position and with the same filter. Finally, in the last run we used for the reference the deepest exposure, which we created ourselves using the multidrizzle task within pyraf. It consisted of the combination of all the 9 exposures taken with the filter into a single deep image per field.
| (1) | (2) | (3) | (4) | (5) | (6) | (7) | (8) | (9) | (10) | (11) | (12) | (13) | (14) | (15) | (16) |
|---|---|---|---|---|---|---|---|---|---|---|---|---|---|---|---|
| ID | RA | DEC | V(mag) | I(mag) | S/N | sharp | round | crowd | typ | f | vflag | iflag | |||
| 1 | 35.646270 | 42.308975 | 21.212 | 0.002 | 19.155 | 0.003 | 1.89 | 1385.3 | 0.017 | 0.027 | 0.061 | 1 | 1 | 4 | 2 |
| 2 | 35.671210 | 42.308643 | 21.086 | 0.002 | 19.522 | 0.002 | 1.93 | 1371.3 | 0.045 | 0.007 | 0.025 | 1 | 1 | 4 | 6 |
| 3 | 35.654569 | 42.308503 | 21.011 | 0.002 | 19.595 | 0.002 | 1.28 | 1362.0 | 0.009 | 0.010 | 0.019 | 1 | 1 | 6 | 4 |
| 4 | 35.664751 | 42.336123 | 21.482 | 0.002 | 19.298 | 0.003 | 1.41 | 1404.6 | 0.015 | 0.013 | 0.002 | 1 | 1 | 4 | 4 |
| 5 | 35.675835 | 42.303078 | 20.990 | 0.002 | 19.766 | 0.002 | 1.83 | 1358.2 | 0.050 | 0.041 | 0.001 | 1 | 1 | 4 | 4 |
The difference between the first two photometry runs allows one to evaluate how successful DOLPHOT is in rejecting the numerous cosmic rays when using _flt images in input which are not cosmic-ray cleaned. The last run was then used to obtain the deepest photometry. The photometry from all these runs provides the same results for the bright part of the stellar populations present in the images. We note that the photometry used in our first analysis of the halo metallicity distribution in NGC 891 (Mouhcine et al., 2007) was based on _crj reference images. Here we present the results obtained using the deepest multidrizzled images as reference image.
The output of DOLPHOT contains the instrumental magnitudes as well as transformed, calibrated magnitudes for all the fitted objects. The transformations have been made using calibrations from Sirianni et al. (2005) and include aperture corrections, as well as CTE loss corrections following Riess (2003). For each object the global solution is listed first, and then the photometry results are given for each of the input images. Here we use the global, combined photometry. Together with the magnitudes and the associated errors DOLPHOT provides also a range of quality flags: , signal-to-noise, sharpness, roundness, crowding, ellipticity, and object type. These flags were used to select the bona fide stellar objects. Our selection criteria were the following: (1) object type 1 or 2, corresponding to a stellar (point source) object; (2) ; (3) sharpness between and ; (4) crowding parameter smaller than 0.35; and (5) detection in both and bands with global photometric errors smaller than 0.5 mag.
Applying these selection criteria, the photometric catalogues contain 149076 stars in H1, 138133 stars in H2, and 106647 stars in the H3 field.
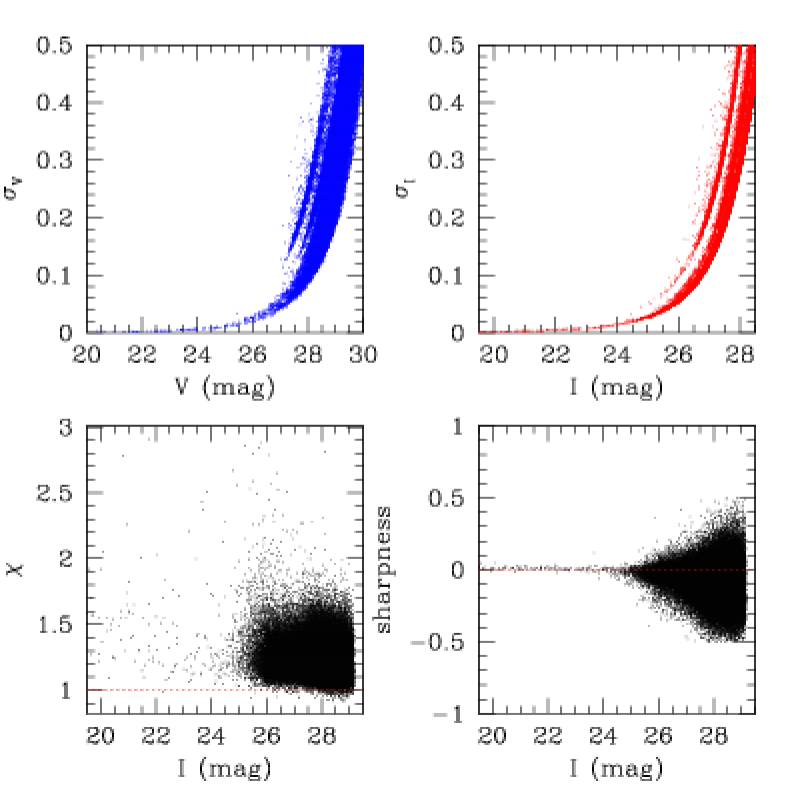
In Fig. 3 the photometric quality parameters for the H3 sources are shown: magnitude error (), sharpness, and of the PSF fit, as a function of magnitude. Magnitude error values () in Fig. 3 are DOLPHOT values multiplied by to account for the fact that the photometry was run combined averages of 3 _flt images, while DOLPHOT computed the photometric errors based on the noise characteristics of the raw ACS images. Although in principle this correction factor should have been , we adopted the value of 1.6 based on the comparison of the photometry in the overlapping regions between fields (see Sect. 2.2 for details). There are several parallel sequences in the magnitude-error plots. The larger errors at a given magnitude are assigned to stars that are not detected in all the _flt images, but only in a subset of them. The sharpness parameter for a perfect star has value of 0, it is negative for sharper, more spiky objects, possibly contaminated by some remaining cosmic rays, or bad pixels, and has positive values for more extended objects. The parameter is a measure of how well the model PSF matches the light distribution of the star. The crowding parameter measures the change in brightness for the star if the neighbours are not subtracted, and is expressed in magnitudes. It is an indicator of how much blending there is due to overlapping PSF wings of neighbouring stars.
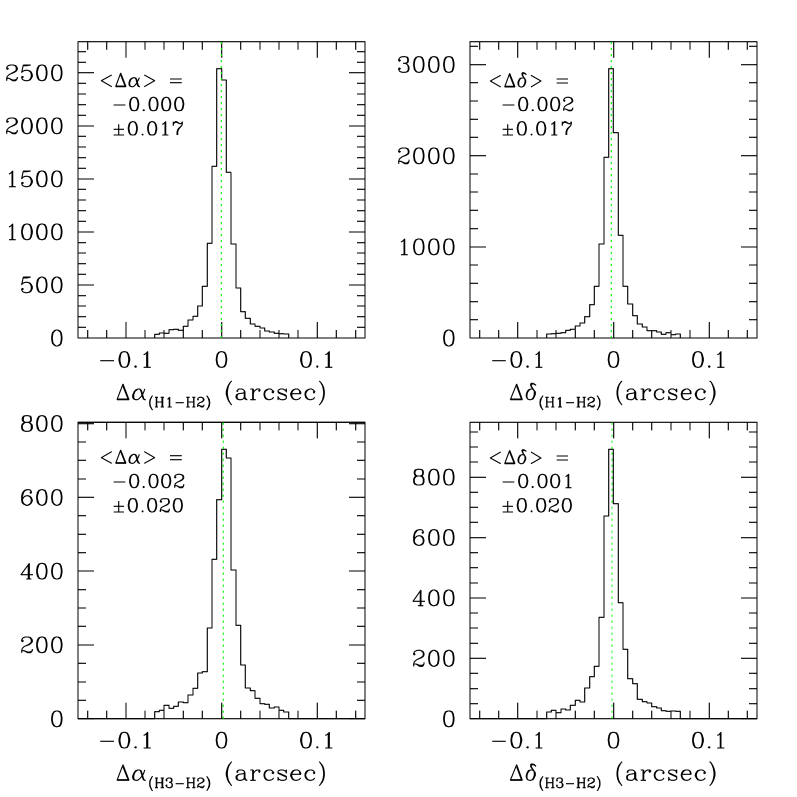
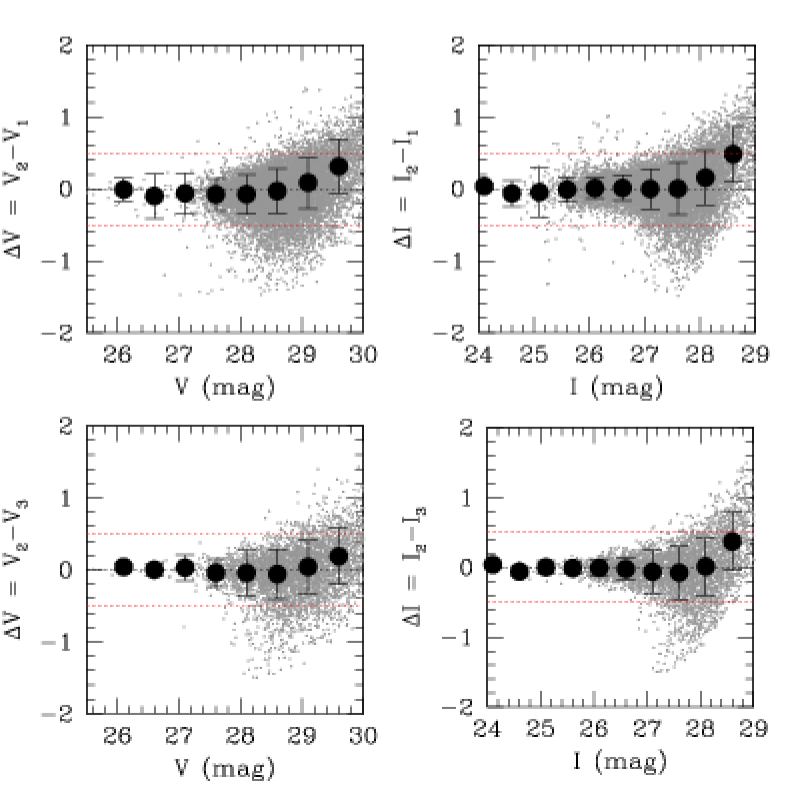
The final photometric catalogue contains all the stars detected in the three fields. The H2 field overlaps with both H1 and H3 in its corners. To make the final catalogue we derived RA and DEC coordinates for all the stars using pyraf task xytosky. The relative accuracy of the astrometry was checked by overplotting the photometric catalogue over the _drz images. Several bright stars were identified in common between the two independent catalogues in overlap regions, and these stars were used to compute the initial shifts between H1 and H3, with respect to H2 field. Based on coordinates and magnitude matches of all the stars these shifts were refined iteratively, and the stars detected independently in two fields in the overlap regions were found. There are 13054 and 4534 detections in H1-H2, and H2-H3 overlap regions, respectively. Fig. 4 shows the distribution of differences in RA and DEC between the stars found in the overlap regions. The differences in magnitudes for these stars are shown in Fig. 5. There is no systematic offset between H2 and H1/H3 detections for stars above the 50% completeness limits. In the final catalogue we use the average magnitude measured independently on two different sets of images for these matched stars.
Our final photometric catalogue contains 377320 stars detected in both and images in the three fields. The first 5 lines of the catalogue are given in Table 2. The full catalogue is available in the electronic version. The columns of the catalogue are: (1) id number; (2) and (3) RA and DEC in degrees; (4)–(7) calibrated V and I-band magnitudes and the associated errors as computed by DOLPHOT, but multiplied by a factor of to correct for the underestimated DOLPHOT errors (see below for details); (8) value of the PSF fit; (9) signal-to-noise; (10) sharpness; (11) roundness; (12) crowding; (13) object type; (14) field (H1, H2, H3 or overlap 12 or 23); (15) and (16) V-band and I-band flags. These last flags give an indication of whether a given star had some bad or saturated pixels within the PSF fitting radius (see the DOLPHOT manual by Dolphin (2005) for details).
We have defined the following coordinate system with respect to the major and minor axis of the galaxy: the centre of NGC 891 was taken to lie at , (J2000.0), and the position angle of the major axis was . In this coordinate system positive is located Northeast of the centre of NGC 891, and negative is to the East. The ACS images cover kpc perpendicular to the disk, and kpc along the major axis.
2.2 Error analysis and completeness
| F606W | F814W | |||||
|---|---|---|---|---|---|---|
| 2.54E-7 | 0.47 | 0.18 | 5.25E-7 | 0.52 | -1.18 | |
| 3.37E-8 | 0.51 | 0.87 | 9.25E-7 | 0.63 | -5.26 | |
| 1.17E-9 | 0.70 | -1.09 | 2.17E-10 | 0.74 | 0.16 | |
| 2.13E-10 | 0.76 | -0.94 | 5.18E-10 | 0.74 | -0.73 | |
| F606W | F814W | |||
|---|---|---|---|---|
| 27.56 | 1.55 | 26.15 | 1.2 | |
| 28.40 | 1.2 | 27.33 | 1.0 | |
| 28.82 | 1.2 | 27.82 | 1.0 | |
| 29.02 | 1.2 | 28.13 | 1.1 | |
| 29.03 | 1.2 | 28.15 | 1.1 | |
| F606W | F814W | |||
| Z (kpc) | ||||
| to | 27.2 | - | 25.8 | - |
| to | 28.4 | 1.0 | 27.27 | 0.7 |
| to | 28.9 | 1.2 | 27.9 | 1.0 |
| to | 29.02 | 1.2 | 28.1 | 1.0 |
| to | 29.1 | 1.1 | 28.22 | 0.9 |
Completeness simulations were run for all three observed fields. Artificial star lists with at least 100,000 stars per field were created using acsfakelist programme within DOLPHOT, and then DOLPHOT was run using the FakeStars parameter in the configuration file equal to the artificial star list. As DOLPHOT adds one fake star to the image at the time and then re-measures its photometry, there is no danger of creating “overcrowded” image by adding too many stars with overlapping PSF wings. In the output file of the completeness photometry run all the stars, including those that were added to the images, but not detected, are listed. Therefore it is easy to compute the completeness ratio: the number of detected divided by the number of added fake stars. The criteria to detect stars were set equal to those for selection of “good” stars in the original photometry runs, by selecting only stars that satisfy all the , sharpness, crowding, and magnitude error cuts.
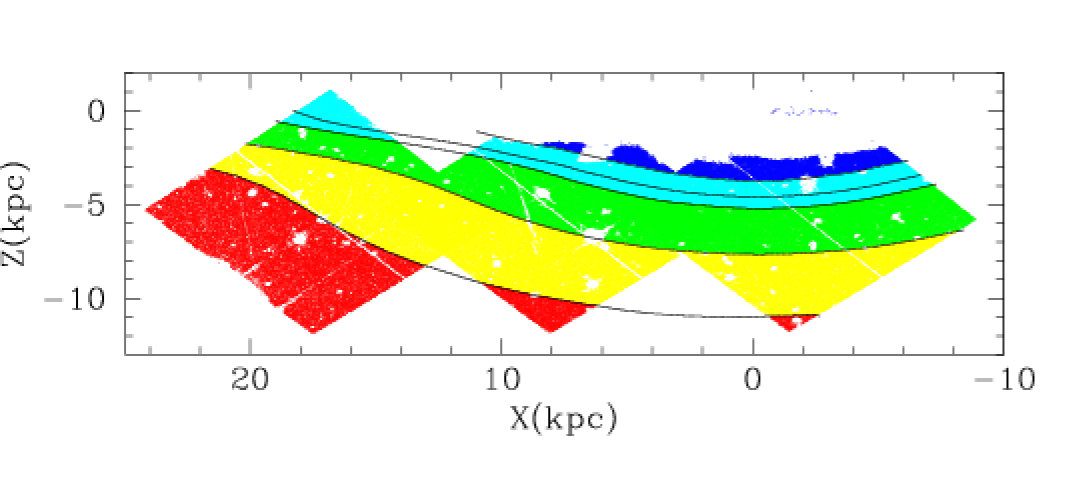
Given the large gradient in stellar density across the observed fields, we investigated the dependence of completeness and magnitude measurement errors as a function of distance from the plane and stellar density. In Figure 6 we show the distribution of all the observed stars colour-coded according to the number density of RGB stars (). We use here the interpolated density profiles derived in Paper III. Solid black lines delimit 5 regions that have the following range of RGB star densities: region 1 (blue) , region 2 (cyan) , region 3 (green) , region 4 (yellow) , region 5 (red) . These same regions, selected based on X, Z galactocentric coordinates were used to derive completeness and magnitude error dependence on magnitude in Figures 7 and 8.
By comparing directly the errors from DOLPHOT and from magnitude differences in the overlap regions it is possible to verify the photometric errors computed by DOLPHOT. The overlap region between the H2 and H3 fields coincides with region 4 (RGB number density between 44 and 140 stars), while the overlap between H2 and H1 has most of its stars within region 3, and some in region 2. The ratio between DOLPHOT errors and the average scatter of the magnitude differences as a function of magnitude is computed using the following expression:
| (1) |
where and are the photometric errors for stars obtained from DOLPHOT in the corresponding field. This ratio indicates that DOLPHOT underestimates the errors by as much as a factor of 1.6. This factor is consistent with the expected factor of , which is due to the fact that the input images are averages of three _flt frames, while DOLPHOT computed the magnitude errors using the noise characteristics of raw images. All the uncertainties in Table 2 incorporate this factor of 1.6, and are adopted in Paper III and in all subsequent analysis in this contribution.
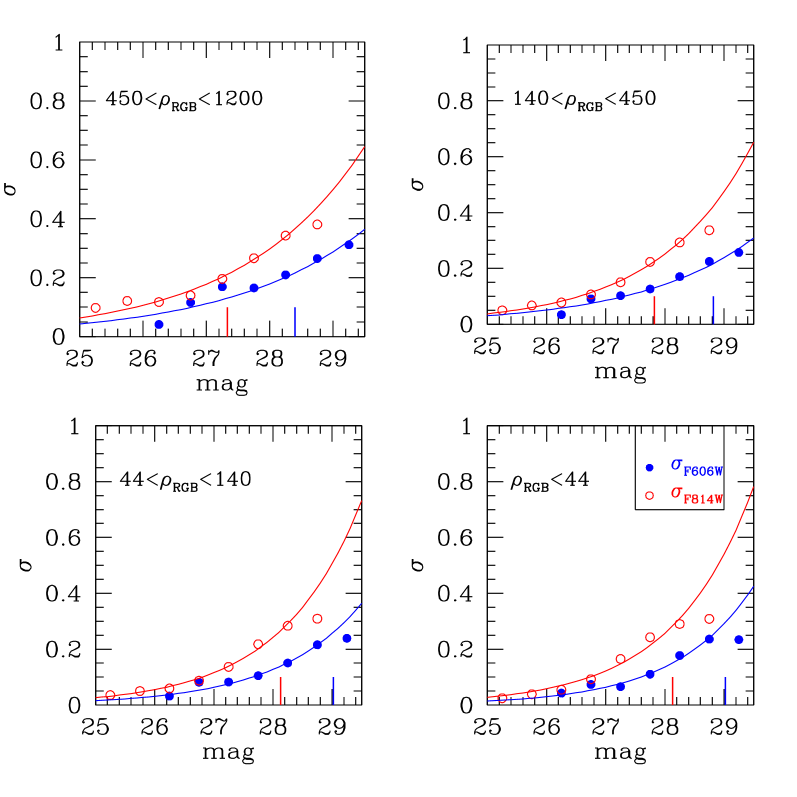
The dependence of the photometric error measurements on magnitude for each region is given in Figure 7. The solid lines are the analytic fits to the data using the following function:
| (2) |
The values of the coefficients of the fits are given in Table 3. The photometric measurements have large errors and show severe blending in region 1. Therefore we will not consider this region further in the stellar populations analysis. Region 2, which corresponds approximately to 2–4 kpc above the plane, and therefore is strongly dominated by thick disk stars (Ibata et al., 2009), has slightly larger errors, than outer regions, but blending does not affect the mag below the RGB tip.
The analytic fits to the photometry errors derived from the completeness simulations for and fit well the errors derived from the overlap regions H1-H2 and H2-H3, respectively, provided that the noise characteristics of the input images are properly taken into account. This is a nice consistency check that the artificial star simulations are providing a reliable estimate of photometric errors.
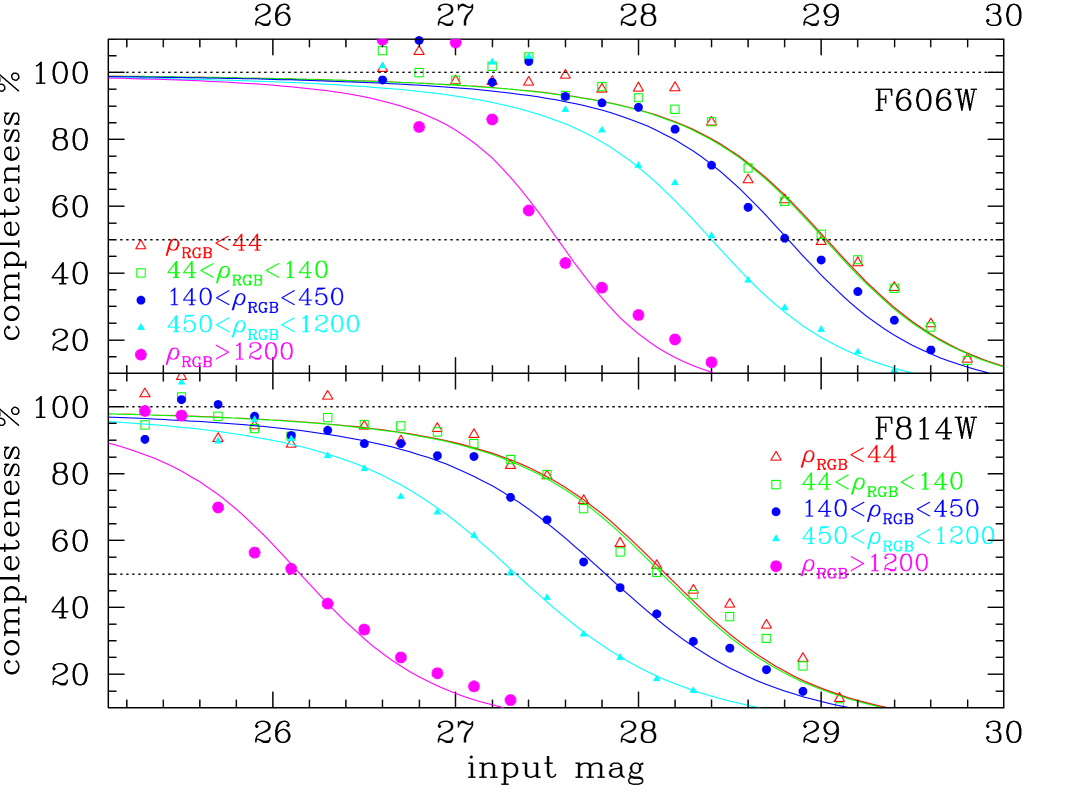
The completeness as a function of magnitude can be fairly well fitted using the following analytical function (Fleming et al., 1995):
| (3) |
The values of the fitted coefficients are given in Table 4. We also derived the completeness relations as function of distance from the galaxy plane, selecting stars only based on Z coordinates. The values of fitted coefficients are given in Table 4 as well. The plot and the tabulated values show that the region within kpc of the galaxy plane is too crowded to yield accurate photometry even at the level of the red giant branch tip. The area between 2 and 4 kpc from the plane has 50% incompleteness at an I-band magnitude of 27.27, while above 4 kpc above the disk the radial dependence of incompleteness and magnitude errors is much weaker.
In spite of the relatively low Galactic latitude of the observed fields (), the contamination from the Milky Way stars is negligible due to the small size of the ACS field. For example according to the Besançon model of the Galaxy (Robin et al., 2003), less than 170 Galactic stars are expected within the 3 ACS fields within the magnitude range . This implies that the contamination from foreground stars is %. Most of the background sources are resolved due to the high resolution of the ACS images.
3 Results
In our analysis we use the distance to NGC 891 of 9.73 Mpc (Mouhcine et al., 2007), corresponding to a distance modulus of mag. The foreground reddening, obtained from Schlegel et al. (1998) maps is . This corresponds to , and mag.
In addition to the foreground extinction, the inner regions of NGC 891 suffer from dust extinction, which is readily visible in optical images covering the plane of the disk. Some amount of extinction is expected to be present also above the disk plane, given the extended distribution of the ionised gas, as well as the detected vertical distribution of molecular and HI gas (Kamphuis et al., 2007; Scoville et al., 1993; Oosterloo et al., 2007). To correct for internal extinction within NGC 891, we proceed in the same way as in Paper III: we compute the extra reddening from the local value of the HI column density using the high resolution deep HI map of Oosterloo et al. (2007) and assuming the conversion between HI column density and derived for the MW by Rachford et al. (2009). Then, half of this additional is added to the foreground MW reddening value. In assigning only half of the extra-extinction derived from the HI map we assume that approximately half of the gas (and dust) is in front, and half behind the observed stars in NGC 891.


The impact of the absorption correction uncertainty is minimised in the following by investigating primarily the areas beyond 2 kpc above the disk plane, where most of the dust and gas is located. The derived metallicity and colour gradients are consistent within the error-bars if the additional extinction contribution is varied by about a factor of two. If less extinction is assumed the gradient is steeper, while it flattens if extinction is higher than assumed. This is primarily due to the change in colour/metallicity in the inner 2.5-3 kpc.
After applying this extinction correction to our photometry, we investigate first the stellar population content at the distance corresponding to the solar circle. After that we discuss the metallicity distributions of the thick disk, the inner spheroid and the halo of NGC 891. To minimise the photometric errors and crowding we limit our analysis to stars located in regions with stellar density lower than 650 .
3.1 Metallicity distribution function
Both stellar evolution models and globular cluster observations show that colours of red giant stars are much more sensitive to metallicity than age, provide thus an excellent way to estimate the metallicity distribution of a stellar population. This approach has been widely used in the literature (e.g. Harris et al., 1999; Saviane et al., 2000; Zoccali et al., 2003; Mouhcine et al., 2005; Rejkuba et al., 2005), and is calibrated using Galactic globular clusters, and stellar evolutionary tracks. Its drawback is that one cannot separate stars belonging to the early-AGB (E-AGB) evolutionary phase, which are located along the RGB, with colours bluer with respect to the first ascent giants of the same age. In a composite stellar population, with a range of metallicities, the E-AGB stars of a metal-rich population may overlap in colour with metal-poor RGB stars. However, the life-time of AGB stars is significantly shorter, and one expects only one E-AGB star for 40 RGB stars in an old population (e.g. Renzini, 1998). Moreover, at the blue edge, E-AGB stars belonging to the metal-poor population are excluded because they are bluer than the most-metal poor evolutionary track. An additional complication is due to a possible mix of ages in our fields. In the interpolation, we assume a single old age for all the stars, which may introduce a bias of up to 0.1 dex, if the age is 4 Gyr younger (Rejkuba et al., 2005). From comparison with simulated CMDs, and from the absence of blue plume stars and a large fraction of thermally-pulsing AGB (TP-AGB) stars, the fractions of stars younger than Gyr are expected to be small in both the thick disk and the halo of NGC 891.
Metallicities for each star were derived by interpolating between the set of -enhanced RGB tracks for stars with M⊙ (VandenBerg et al., 2006). For more details we refer to Mouhcine et al. (2005); Mouhcine et al. (2007). We note here that only stars with colours corresponding to the metallicity range between and , that satisfy our selection criteria, and have -band magnitudes brighter than 26.5 mag (to avoid as much as possible completeness corrections), have been used to construct the metallicity distribution functions (MDFs). From the comparison of the observed CMDs with the stellar evolutionary isochrones it is clear that there are almost no stars with metallicity above Z=0.008 isochrone (see below), which corresponds to . Therefore we expect that this choice of tracks used for interpolation, and the fact that we do not extrapolate beyond the validity of the models, does not affect the metal-rich end of our MDF.
3.2 Solar-cylinder-like populations
Figure 9 shows the MDFs of stars selected at kpc distance along the major axis and at two different heights above the plane of the galaxy: at kpc (left panel) and kpc (right panel). The histograms are normalised, extinction-corrected stellar metallicity distribution functions in the (X,Z) regions indicated in each panel. Both distributions have a prominent relatively metal-rich peak with a median of [Fe/H] dex and a sparsely populated metal-poor tail. The properties of metallicity distributions are quantified using the widely used Kaye’s Mixture Model (KMM) statistical test (Ashman et al., 1994, and references therein). The KMM test uses the maximum likelihood technique to test if a distribution is better modelled as a sum of two Gaussian than as a single Gaussian (the null hypothesis). Ashman et al. (1994) have cautioned that the output likelihood in the case where the two populations have different dispersions is difficult to interpret, so we have assumed that both populations have similar dispersions. The solid line shows the best double Gaussian distribution fit, which is preferred to a single Gaussian distribution based on the KMM statistics. Indicated are the parameters of the best fit models as assigned by the KMM test for the two components, referred to as the metal-poor and the metal-rich component and shown by the dashed lines.


The distribution functions shown in Figure 9 are significantly different from those of the Milky Way stars at similar locations. Ivezić et al. (2008) have shown for stars with , that the metal-rich components, with , dominate only at relatively small vertical distances from the plane, i.e.,. For higher vertical distances, i.e., the fraction of stars belonging to the metal-rich component is vanishingly small, and are completely out-numbered by stars with . NGC 891 stars at similar distances along the minor and the major axes exhibit a different behaviour. The properties of the metal-rich and the metal-poor components of the stellar MDF do not change significantly as a function of the vertical distance from the galactic plane. Metal-rich stars are still present in abundance at a vertical distance beyond 5 kpc, in stark contrast with the stellar content of the Galaxy at similar distances.
The lower panels of Figure 9 show the residuals from the double Gaussian fits of the observed metallicity distributions. No systematic deviations are noticeable. The difference between the observed MDF of the MW stars at the solar cyllinder and the double Gaussian fit shows the presence of an additional population of intermediate metallicity stars, i.e., [Fe/H] dex, a reminiscent of the so-called metal-weak thick disk (Morrison et al., 1990). The metal-rich peak of the MDF of the MW stars within the solar cyllinder is best fitted by a double Gaussian model up to . For NGC 891 however, the metal-rich peak of stars at the solar cyllinder-like locations is satisfactorily modeled as a single component, indicating the absence of a distinct stellar population with intermediate metallicities within kpc.
The observed differences could be due to that thick disk stars, which should be the dominant contributors at kpc, are still present beyond 5 kpc (see Fig. 7b of Paper III). In addition, the stellar halo of NGC 891 has a higher mean metallicity than that of the MW at comparable radial and vertical distances (Paper I and also Sect. 3.4 below). All this points toward the presence of a mix of populations that could be due to more massive accretion events than is typical in the Galaxy at the solar neighbourhood. While this may sound like a far-fetched conclusion, the occurrence of recent accretion events is supported by the detection of significant small scale substructures across the thick disk and spheroid of NGC 891 (Paper III).
3.3 Thick disk stellar population
The structural analysis presented in Paper III has shown that a thick disk component is present in NGC 891, with stellar densities well fitted by exponential profiles both vertically, with a scale height of kpc, and radially, with a scale length of kpc. The presence of an inner stellar spheroid, combined with large stellar densities, causing large photometric uncertainties, incompleteness, and significant blending (density region 1, with stars extends almost up to 4 kpc above the plane along the minor axis), prevent the detection of the thick disk population within the inner kpc. To investigate the properties of the thick disk stellar content, as free as possible from the bulge and halo stars, we select stars with kpc, and kpc (Ibata et al., 2009, in particular see their Fig. 4 and 7). As already mentioned, to minimize the photometric errors and crowding we limit our analysis to stars located in regions with stellar density lower than 650 .


| Z range | X range | N(V-I) | N[Fe/H] | [Fe/H] | [Fe/H] | ||||
| kpc | kpc | mean mag | median mag | mean dex | median dex | ||||
| 311 | 1.59 | 0.30 | 1.57 | 552 | -1.17 | 0.35 | -1.11 | ||
| 356 | 1.61 | 0.31 | 1.59 | 625 | -1.19 | 0.38 | -1.11 | ||
| 478 | 1.67 | 0.33 | 1.66 | 944 | -1.05 | 0.30 | -0.99 | ||
| 320 | 1.66 | 0.32 | 1.62 | 654 | -1.04 | 0.31 | -0.96 | ||
| 138 | 1.71 | 0.30 | 1.67 | 297 | -1.05 | 0.32 | -0.99 | ||
| 38 | 1.58 | 0.27 | 1.58 | 67 | -1.19 | 0.39 | -1.15 | ||
| 0 | 0 | ||||||||
| 65 | 1.55 | 0.32 | 1.53 | 82 | -1.28 | 0.44 | -1.15 | ||
| 175 | 1.68 | 0.31 | 1.68 | 343 | -1.02 | 0.28 | -0.97 | ||
| 96 | 1.70 | 0.34 | 1.69 | 212 | -1.01 | 0.27 | -0.93 | ||
| 55 | 1.73 | 0.29 | 1.72 | 105 | -1.05 | 0.30 | -0.99 | ||
| 6 | 1.51 | 0.20 | 1.61 | 6 | -0.86 | 0.23 | -0.81 | ||
| 120 | 1.61 | 0.30 | 1.59 | 214 | -1.15 | 0.33 | -1.12 | ||
| 187 | 1.62 | 0.32 | 1.60 | 335 | -1.20 | 0.39 | -1.11 | ||
| 75 | 1.71 | 0.31 | 1.71 | 145 | -1.02 | 0.28 | -0.95 | ||
| 53 | 1.65 | 0.28 | 1.60 | 84 | -1.06 | 0.34 | -0.96 | ||
| 24 | 1.71 | 0.25 | 1.69 | 57 | -1.13 | 0.36 | -1.06 | ||
| 14 | 1.58 | 0.38 | 1.58 | 26 | -1.23 | 0.42 | -1.15 | ||
| 191 | 1.58 | 0.30 | 1.55 | 338 | -1.18 | 0.36 | -1.11 | ||
| 104 | 1.62 | 0.29 | 1.60 | 208 | -1.15 | 0.33 | -1.09 | ||
| 47 | 1.69 | 0.40 | 1.65 | 100 | -1.13 | 0.35 | -1.05 | ||
| 24 | 1.53 | 0.34 | 1.49 | 67 | -1.13 | 0.37 | -1.04 | ||
| 22 | 1.52 | 0.21 | 1.55 | 43 | -1.06 | 0.32 | -0.97 | ||
| 18 | 1.60 | 0.20 | 1.61 | 35 | -1.22 | 0.37 | -1.20 |
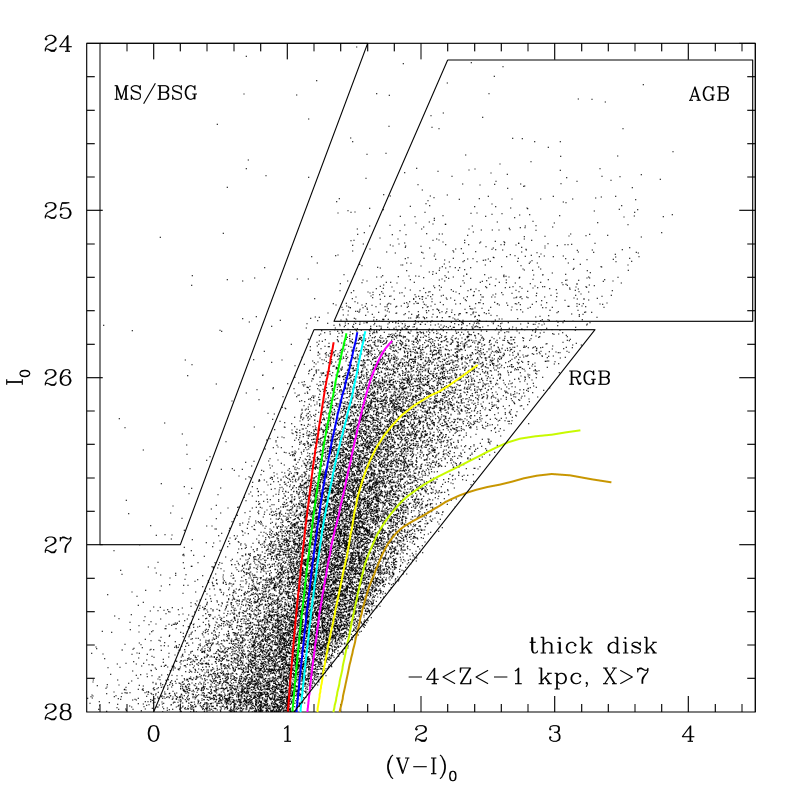
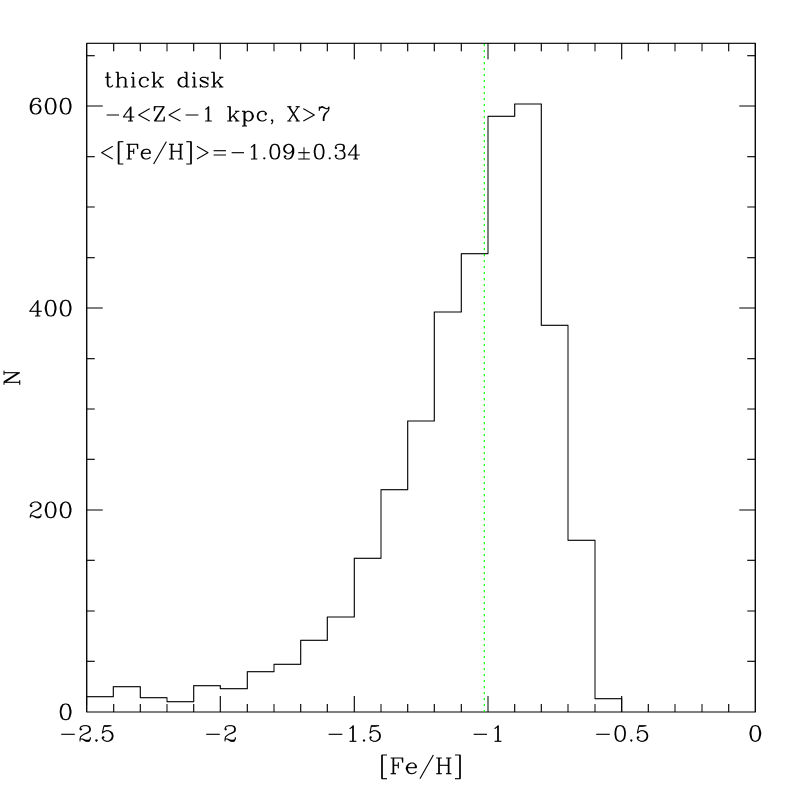
The colour-magnitude diagram of selected thick disk stars is shown in Fig. 10. The most prominent feature is the well-populated red giant branch, with stars covering a wide range of colours. In the area of the diagram where blue plume stars, belonging to the young main sequence, and blue super-giant stars are expected to be located, there are only a handful of stars, which could be either scattered there by the combination of photometric errors and blending, or could be mis-identified background or foreground sources. Overplotted on the CMD are Teramo stellar evolutionary isochrones for a 10 Gyr old stellar population with the range of metallicities . While the incompleteness prevents the detection of stars with metallicities higher than half-solar, only very few, if any, are expected, given that the density of stars decreases strongly between the and isochrones. The right panel of Fig. 10 shows the MDF of all thick disk stars with -band magnitudes brighter than 26.5 mag. The peak of the stellar metallicity distribution of the thick disk stars is around dex, with a mean metallicity of dex and one scatter of dex. The median of the stellar metallicities of the thick disk is dex, slightly lower than that measured for the MW thick disk of dex for stars at comparable vertical distances above the galaxy plane (Gilmore et al., 1995; Ivezić et al., 2008). It worth mentioning that thick disk stars selected here are distributed over a wide range of radial distances, i.e., , while the samples of the Galaxy thick disk stars are restricted generally to the solar neighbourhood.
The spatial variation of the properties of thick disk stars holds important clues on the formation mechanism(s) of this disk component. The size of the sample of thick disk stars selected here is large enough to permit a study of the vertical and radial variation of their properties. The left panel of Fig. 11 shows the variation of the median colour of thick disk stars with mag, i.e., a powerful metallicity indicator for old stellar populations, along the vertical direction. The dashed line shows a linear fit to the data where only solid dots ( kpc) are used in the fit. Despite our efforts to correct for incompleteness due to crowding and large extinction in the inner parts, we have chosen to exclude stars in those regions for the sake of obtaining clear conclusions. The right panel of Fig. 11 shows the variation of the median metallicity along the vertical direction. A strong vertical gradient of the median colour and metallicity of thick disk stars is present. The detected vertical gradient could be genuine, or alternatively, given the wide range of radial distances covered by stars in the thick disk sample, could be due to a mix of different populations with radially varying contributions. The inspection of the vertical stellar density profiles indicates that the contribution of halo stars to the overall populations with , estimated from the extrapolation of the star count profiles stars with , changes as one moves radially away from the minor axis (see Fig. 7 and Fig. 8 of Paper III). To investigate this further, we plot the evolution of both the median colour , and median metallicity of thick disk stars as a function of the vertical distance in three radial bins in Fig. 12: between kpc (upper panel), kpc (central panel) and between kpc (bottom panel). In each panel we indicate the slope and the normalisation of the linear fit to the data, restricted to the solid dots. The results of this exercise are given in a tabular format in Table 5 reporting the mean, median and rms dispersion of the colour and [Fe/H] distributions at a range of distances along the minor axis (Z range) and major axis (X range). The thick disk stars with kpc, where the contamination from halo stars is expected to be small, do not show vertical variations of their median metallicities and colours. This is similar to what is observed for the Galactic thick disk stars at similar radial distances and heights from the galactic plane (Ivezić et al., 2008). For thick disk stars well away from the minor axis, i.e., kpc, marginally significant mild vertical gradients are present however. The outer spheroid stellar populations shift the average colour of stars close to the edge of the thick disk outside 14 kpc towards bluer values, lowering therefore the median metallicities.
Fig. 13 shows the variation of the median colour (left panel) and median metallicity (right panel) of thick disk stars along the radial direction, for those with . The dashed lines show the linear fits to the data. No radial metallicity gradient is detected for thick disk stars. However, the median metallicities/colours are found to vary significantly within the narrow bin of vertical distances. The mean thick disk colour for the vertically selected stars is , with scatter around the mean of mag. The dispersion around the mean metallicity is approximately dex, and does not vary much as one moves along the major axis.
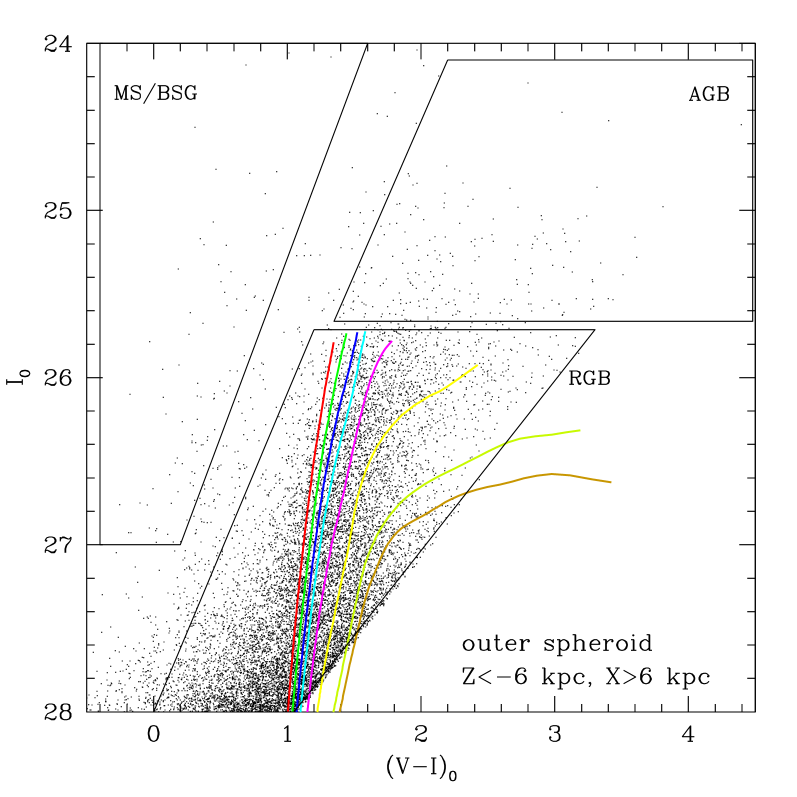
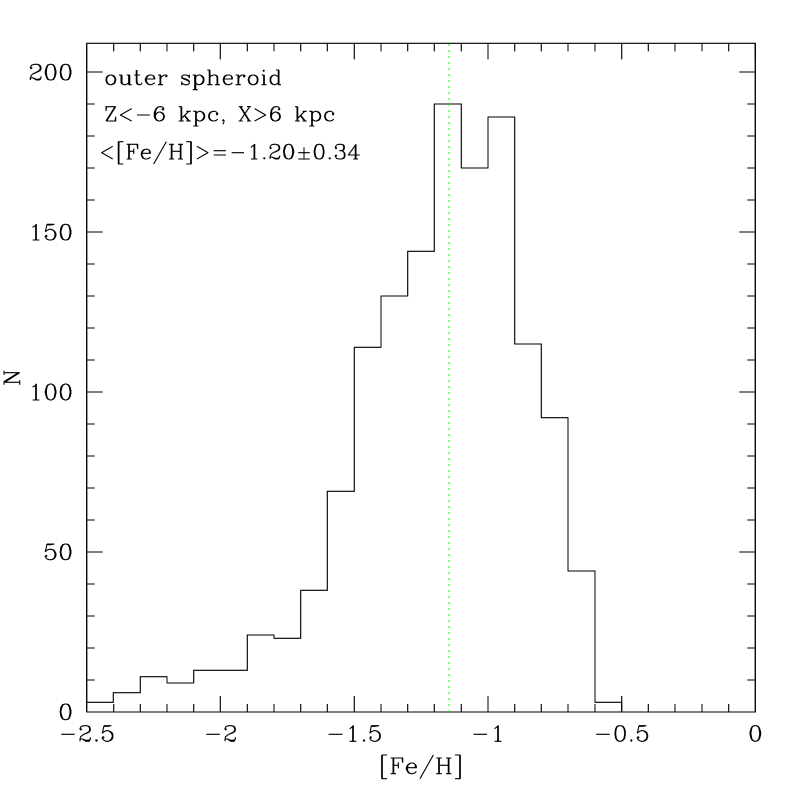


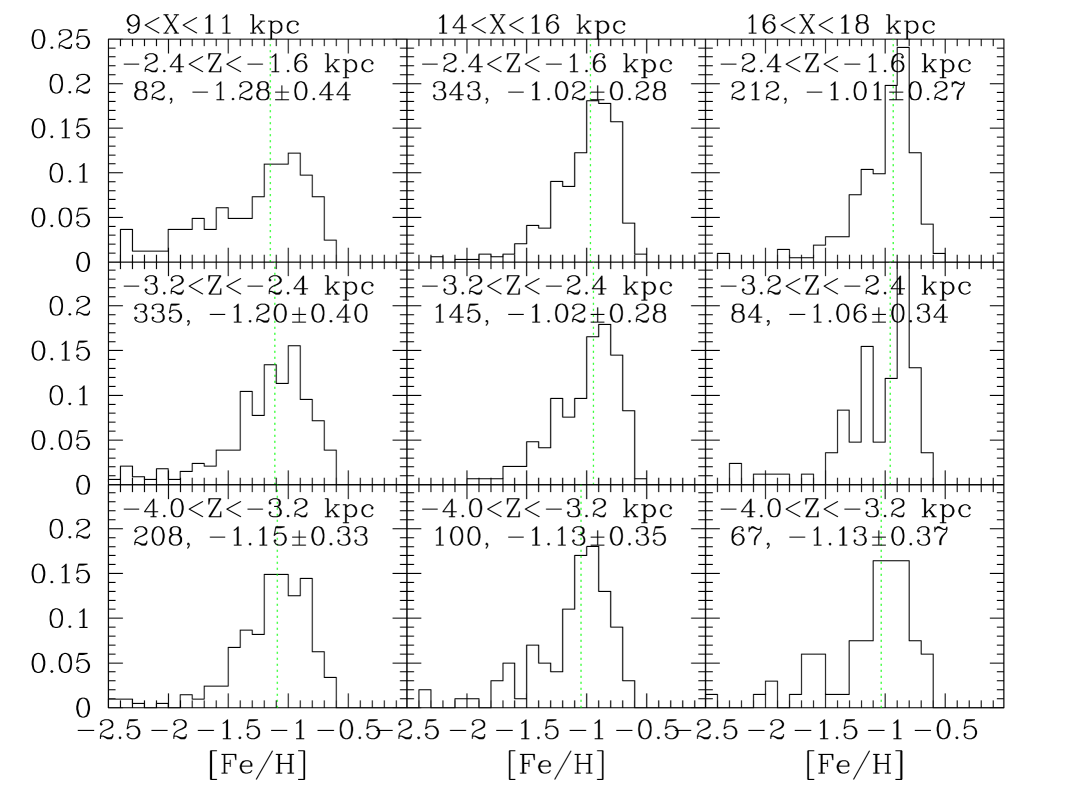
Figure 14 shows the normalised, extinction corrected, MDF histograms for thick disk RGB stars, and selected to lie at radial distances kpc (left column), kpc (central column), and kpc (right column). The thick disk stars at different radial distance bins are split into different vertical heights kpc (top row), kpc (central row), and kpc (bottom row). The figure shows that the properties of the metallicity distribution, i.e., the metallicities of the metal-poor and the metal-rich peaks and their relative contributions, of thick disk stars do not appear to change either radially or vertically.
3.4 The stellar population of the spheroid
The analysis of the star counts around NGC 891 has shown the presence, in addition to the thick disk, of a spheroidal component with a de Vaucouleurs-like profile from kpc to the edge of the survey at kpc. This morphological component consists of an inner spheroid, prominent between kpc and kpc, and the halo (see Fig. 3 of Paper III). The two-dimensional fit of the star number count distribution indicates that the spheroid becomes more flattened with distance, changing from in the inner parts to in the outermost halo region probed. To sample the stellar populations of the inner spheroid, we select stars with kpc, and kpc. To avoid contamination from the inner spheroid and/or the thick disk, halo stars are selected as those with kpc and kpc. As in the case of the thick disk stellar population analysis, we restrict the sample to stellar density regions with less than 650 RGB stars per kpc2.
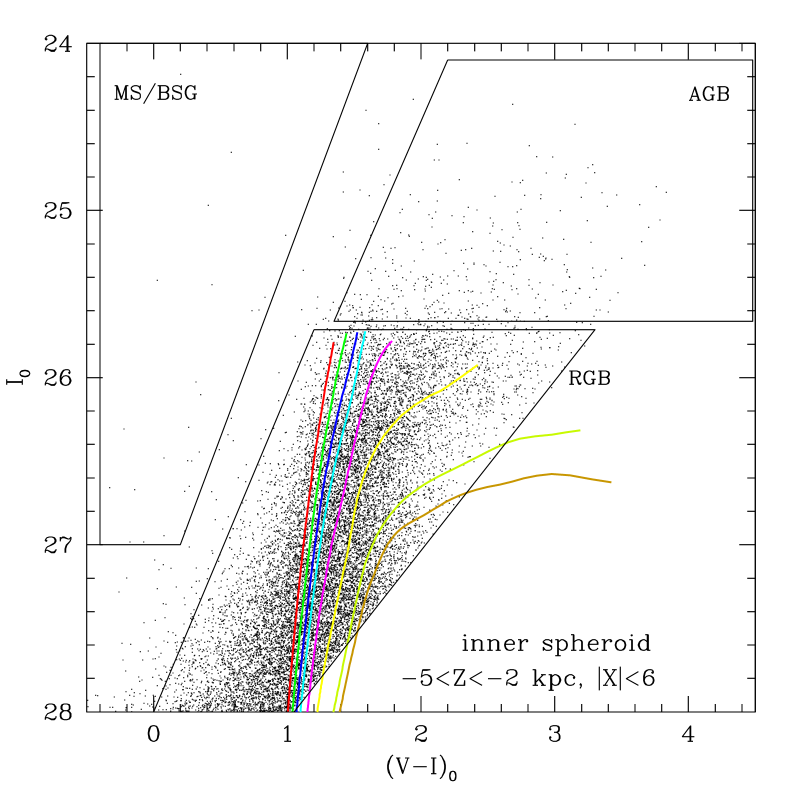
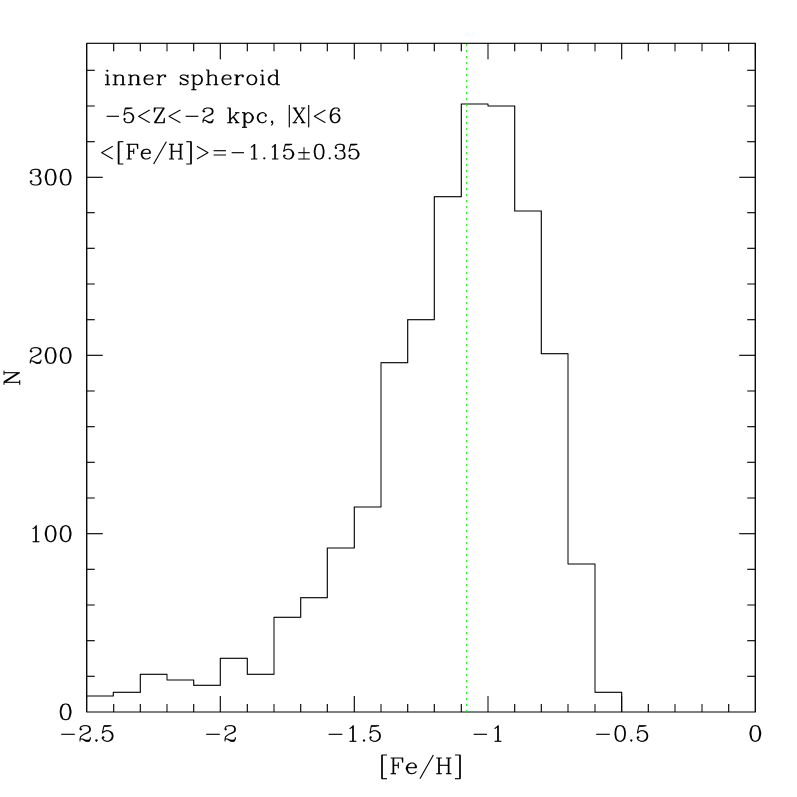
The colour-magnitude diagrams of both inner spheroid and the halo are shown in the left panels of Fig. 15 and Fig. 16, respectively. The CMDs of both components look strikingly similar and, as for the thick disk, dominated by old stars, with RGB stars covering a wide range of colours, indicative of a mixture of low-to-intermediate metallicities. The MDFs of selected stars in each component are shown in the right panels of Fig. 15 and Fig. 16, respectively. The average metallicity of stars of the inner spheroid is dex, with a spread of dex and a median of dex. For the halo, the average [Fe/H] is dex, one sigma spread dex, and the median dex. The stellar populations dominating the two components of the spheroid surrounding the galaxy seem to be almost identical. This was remarked by Ibata et al. (2009), who found that inner spheroid and halo share similar colour and structure properties. Here we repeat their caveat: the inner most parts of the “bulge”, inside the kpc radius are almost impossible to probe with resolved stellar populations, while integrated light suffers from substantial extinction from the dust in the disk.
To investigate the spatial variations of stellar metallicity, we compute the median colour and the median metallicity in elliptical rings, where we use different axis ratios for the inner spheroid and the halo. Fig. 17 shows the the evolution of the median colour and metallicity as a function of minor axis distance. A modest metallicity gradient, i.e., dex/kpc, is present at about level. The scatter around the mean metallicity-distance relation is substantial however. The dispersion around the median metallicity is remarkably constant across the outer spheroid with dex. The presence of small-scale chemical substructures is evident from the large scatter around the mean relation.
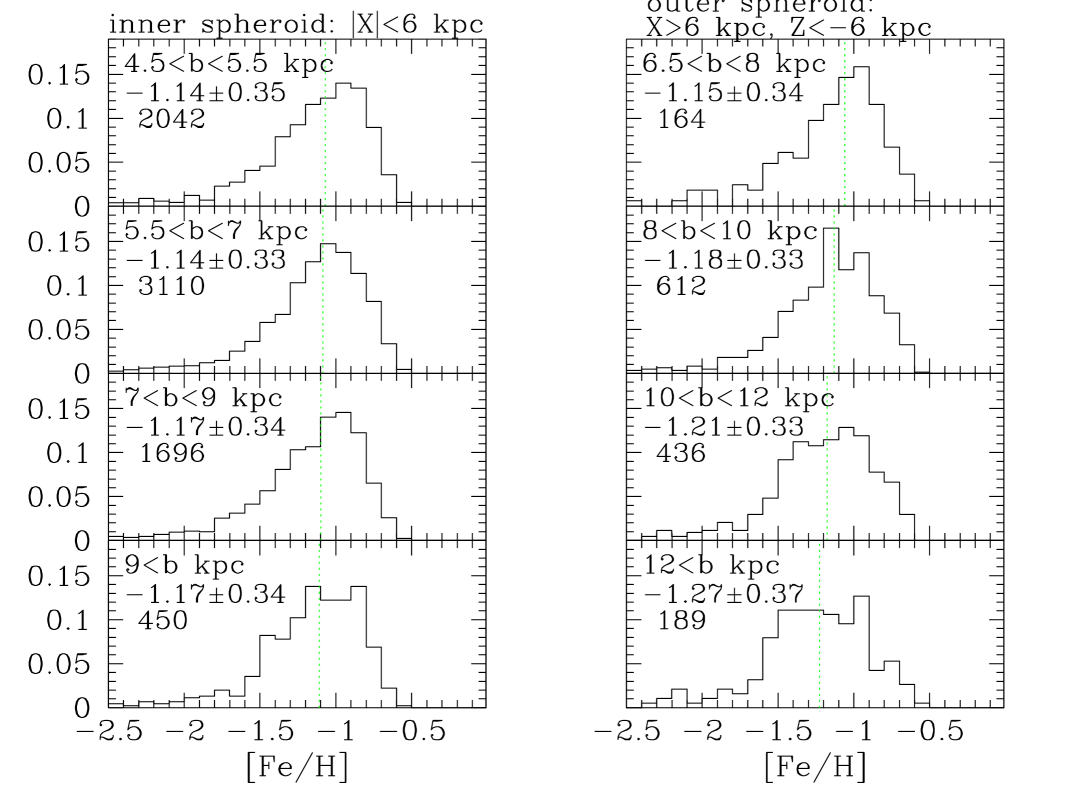
Fig 18 shows the spatial variation of the normalised, extinction-corrected stellar metallicity distributions of the inner spheroid (left) and the halo (right). Stars have been selected in elliptical rings with the minor axis distances (b) indicated in each panel. The properties of the stellar content of the inner spheroid appear to be remarkably invariant over an extended range of distances along the minor axis. Beside the mild metallicity gradient, with average metallicity decreasing from about to dex from the inner most regions to the outskirts (Fig. 17), the properties of the stellar halo metallicity distribution appear to be the same over the surveyed area. No evidence that the contribution of the metal-poor peak of the stellar halo MDF increases at larger distances is present. No second stellar halo component is present in the halo of NGC 891, at least within the range of distance probed by our survey.
4 Discussion
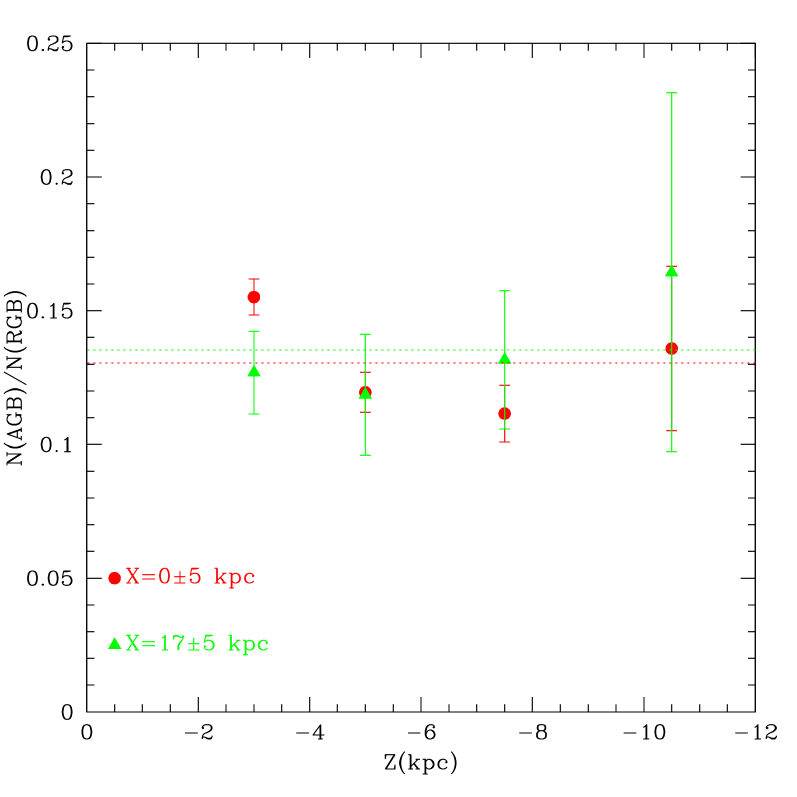
Stars brighter than the RGB tip can either be foreground contaminants, or old and metal-rich ([Fe/H] dex) TP-AGB stars, or intermediate-age TP-AGB, or blends of RGB tip stars. In the most inner fields, i.e., kpc, most of bright stars are expected to be blends. While some blends are expected to be present in the fields with stellar density larger than , the blends of two RGB tip stars that would mimic a bright AGB star is expected to be negligible in the regions with lower densities: at the distance of NGC 891, 1 kpc subtends about 420 pixels, and there is only one bright red giant within 1 magnitude of the RGB tip for every 120 fainter RGB stars in an old stellar population with solar metallicity (Renzini, 1998). Judging by the lack of stars with metallicities above approximately half solar in the probed field, the bulk of stars above the RGB tip are probable intermediate-age AGB stars. To investigate whether an age gradient is present across the thick disk and halo, we plot the ratio between AGB and RGB stars in Figure 19. Filled (red) dots show this ratio along the minor axis, while the (green) triangles are used to plot the ratio at X=17 kpc from the centre. In both cases the number ratio of AGB and RGB stars is computed for the same range of distances above the disk (=10.5, 7.5, 5, and 3 kpc). AGB stars are selected between 0.2 and 1.0 magnitudes brighter than the RGB tip, while the RGB stars are selected between the RGB tip and 0.5 magnitudes fainter. The number ratio is fairly constant with radius and perpendicular to the disk plane. Accounting for the Poissonian errors ( error-bars are plotted) the ratio remains constant at 0.13 across the surveyed thick disk and halo areas. This is strikingly similar to the measured ratios for three small edge-on galaxies and is consistent with an old stellar population (Mould, 2005). No significant bias is expected then when converting RGB photometry into metallicity.
Stars populating the halo and thick disk of NGC 891 are found to be predominantly old, similar to what is well established for the Milky Way halo (e.g. Ryan & Norris, 1991), and the thick disk (e.g. Gilmore & Reid, 1983; Fuhrmann, 2004; Bensby et al., 2003). The vertical variations of the shape of the metallicity distributions of stars located at solar neighbourhood-like distances, where it is well determined in the case of the Milky Way, are significantly different in both galaxies however. This indicates that the mix of stellar populations that have been assembled to form the outskirts of the thick disks of both galaxies is different. Probably more massive or later accretions happened in NGC 891. A metal-poor thick disk and halo might be present but with a more extended component dominating the probed regions, or alternatively a large accretion (unidentified given the restricted extent of the area surveyed here) has polluted the stellar populations within the few kpc above the disk of NGC 891. A survey delivering a panoramic view of the outskirts of NGC 891 is needed. Whatever the exact driver(s) of the observed different vertical structures of the Milky Way and NGC 891, it is safe to conclude that the accretion histories of both galaxies have been substantially different.
The scale-heights of the Milky Way thin and thick disks are pc, and pc respectively (Jurić et al., 2008), and essentially all the stars within the kpc above the plane belong to the thick disk. NGC 891 has a larger thick disk, with a scale height of kpc and the scale length of kpc (Ibata et al., 2009). The thin and the thick disks of NGC 891 have similar radial scale lengths, with kpc, and kpc. The structure of the thick disk appears to be similar at different distances above the plane. What can this similarity tell us about the formation of the thick disk of NGC 891?
The metallicity distributions of the Galactic thin and thick disks overlap (Freeman & Bland-Hawthorn, 2002, and reference therein). It is still debated whether the thick disk metallicity distribution extends up to solar values, or at most to 0.2 dex (Bensby et al., 2007; Fuhrmann, 2008). However, there is a discontinuity in the -element abundances between the thin and thick disk in the MW, which points to a disjoint formation histories for the two disks. The metallicity distribution of the thick disk of NGC 891 does not seem to extend to such high metallicity. However, our conclusion is limited due to possible bias in the inner regions due to blending. Observationally challenging spectroscopy of the low surface brightness regions of the NGC 891 thick disk is therefore needed to measure the -element abundances.
The very high stellar density and the presence of significant amounts of dust in the plane of the galaxy, prevent the analysis of the thin disk population in similar detail as is feasible for the thick disk and halo. The colour composite of our ACS images (Fig 2 in this paper and Fig 3 of Paper III) shows the presence of blue, young stars and HII regions in the thin disk. Clearly the star formation is still on-going in the thin disk. The question is whether the thick disk may have formed from migrated thin disk stars, dispersed to higher orbits by some heating mechanism (Norris, 1987). The similar sizes of the thin and thick disk support the stellar diffusion formation scenario. This scenario is, however, not supported by the observed lack of vertical metallicity/colour gradient of thick disk stars. This is consistent with the finding of Dalcanton & Bernstein (2002); Yoachim & Dalcanton (2005) who have found that the scale lengths of thin and thick disks (derived from fitting of vertical surface brightness profiles) are not correlated.
Alternative scenarios for the thick disk formation include a slow pressure-supported collapse, violent chemical heating of the early thin disk by satellite accretion or violent relaxation of the galactic potential, direct accretion of thick disk material, and the rapid dissipational collapse (e.g Gilmore et al., 1995). In the slow dissipative disk formation scenario disk settling on time-scales longer than chemical enrichment timescale, would give rise to metallicity gradients of about 2 dex/kpc (e.g. Burkert et al., 1992), which are much stronger than we observe in NGC 891. Furthermore, in that scenario the vertical gradient is expected to be present also in the inner regions, in contradiction with the observed properties. Our finding of no vertical gradient in the inner thick disk regions, and no radial colour gradient, combined with the evidences of inhomogeneities seem to point to a combination of possible rapid dissipational collapse, or fast assembly of few gas-rich satellites at high redshift ( Brook et al., 2004, 2005). Although the data point to a merger/accretion origin for the thick disk, it is difficult to disentangle models in which thick disk stars are accreted from those in which the stars form in situ further off the midplane during gas-rich mergers (Brook et al., 2004). Stars that formed in subhalos before being accreted are likely to have different properties than those that formed from accreted gas. Presumably, one could use detailed stellar kinematics, age and abundance information to distinguish between the two scenarios.
The stellar halo of NGC 891 shows a shallow metallicity gradient, i.e., dex/kpc, with stars getting less chemically enriched in the outer regions. This is similar to what is found in the inner halo of M31 (Durrell et al., 2001), and in the outskirts of the giant elliptical NGC 5128 (Rejkuba et al., 2005). However, at distances larger than reff from the centres of M31 and giant elliptical galaxy NGC 3379, the metal-poor halo was detected (Chapman et al., 2006; Kalirai et al., 2006; Harris et al., 2007). For NGC 891, the 12 reff corresponds to about 21.5 kpc. The metal-poor halo, similar to those found in the MW and outer regions of M31, is then either missing, or we do not detect it at 13 reff due to higher flattening of the halo and a more extended and/or less populated metal-poor component. This points again toward the need for a panoramic coverage of the outskirts of this analogue of the Milky Way to map the shape and the properties of its stellar halo.
5 Summary & Conclusions
We have derived an astrophotometric catalogue of 377320 stars detected in both and filters in three HST ACS fields in the north-eastern quadrant of NGC 891. A detailed description of the data reductions, completeness simulations, and photometric error analysis is presented. The final photometry is calibrated onto the ground based Johnson-Cousins system.
The colour-magnitude diagrams are morphologically dominated by red giant branch stars, with no significant number of stars brighter than the classic old tip of the red giant branch. The number ratio of AGB stars to RGB stars is indicative of predominantly old stellar populations, and is roughly constant across the thick disk and the halo.
The metallicity gradient of the thick disk population perpendicular to the plane of the galaxy is mild, amounting to kpc-1, with bluer colours (lower metallicity) at higher distances from the plane. This is however fully dominated by the gradient in the outer regions of the thick disk, at distances larger than about 14 kpc from the centre along the major axis. The inner thick disk metallicity distribution is consistent with no gradient, similar to what is observed for Milky Way thick disk stars (Gilmore et al., 1995), and suspected for other spiral galaxies from their vertical colour gradients. In the radial direction data are consistent with no colour gradient, but with strong variations mag around the mean colour of . The overall metallicity distribution of the thick disk stars peaks around dex, has the mean of dex with a scatter of dex. The metallicity distribution functions of thick disk stars do not show any significant variation in either the vertical direction, or along the major axis.
A difference between the MW and NGC 891 is provided by the significantly different vertical variations of stellar metallicity distributions at solar circle-like locations. In NGC 891 there is a lack of a significant meal-poor component at high distances above the plane, i.e., kpc, that could be compared to the metal-poor MW halo. As concluded in Paper I for regions at kpc, the extra-planar stellar populations at lower heights from the disk of NGC 891 are more chemically enriched than those at similar locations in the MW. The presence of a significant scatter of thick disk stellar metallicities along the vertical and the radial directions might indicate that the observed difference could be due to a large accretion that has affected the properties of stars over the entire surveyed area.
A metallicity gradient is detected for the spheroid changing from dex in the inner regions to dex in the outermost halo regions, with a large scatter around the mean metallicities of dex throughout. The inner spheroid and the halo component up to about reff shows remarkable similarity in structure and stellar populations, with quite high average metallicity for the halo.
Acknowledgments
This work was based on observations with the NASA/ESA Hubble Space Telescope, obtained at the Space Telescope Science Institute, which is operated by the Association of Universities for Research in Astronomy, Inc.,under NASA contract NAS 5-26555. We thank Andy Dolphin for suggestions regarding DOLPHOT data reduction package, and Tom Oosterloo for providing his high resolution deep HI map of the galaxy.
References
- Anderson (2006) Anderson J., 2006, in Koekemoer A. M., Goudfrooij P., Dressel L. L., eds, The 2005 HST Calibration Workshop: Hubble After the Transition to Two-Gyro Mode Empirical PSFs and Distortion in the WFC Camera. pp 11–+
- Ashman et al. (1994) Ashman K. M., Bird C. M., Zepf S. E., 1994, AJ, 108, 2348
- Bensby et al. (2003) Bensby T., Feltzing S., Lundström I., 2003, A&A, 410, 527
- Bensby et al. (2007) Bensby T., Zenn A. R., Oey M. S., Feltzing S., 2007, ApJLett, 663, L13
- Brook et al. (2005) Brook C. B., Gibson B. K., Martel H., Kawata D., 2005, ApJ, 630, 298
- Brook et al. (2004) Brook C. B., Kawata D., Gibson B. K., Freeman K. C., 2004, ApJ, 612, 894
- Burkert et al. (1992) Burkert A., Truran J. W., Hensler G., 1992, ApJ, 391, 651
- Carollo et al. (2007) Carollo D., Beers T. C., Lee Y. S., Chiba M., Norris J. E., Wilhelm R., Sivarani T., Marsteller B., Munn J. A., Bailer-Jones C. A. L., Fiorentin P. R., York D. G., 2007, Nature, 450, 1020
- Chapman et al. (2006) Chapman S. C., Ibata R., Lewis G. F., Ferguson A. M. N., Irwin M., McConnachie A., Tanvir N., 2006, ApJ, 653, 255
- Dalcanton & Bernstein (2002) Dalcanton J. J., Bernstein R. A., 2002, AJ, 124, 1328
- de Jong (2008) de Jong R. S., 2008, MNRAS, 388, 1521
- Dolphin (2000) Dolphin A. E., 2000, PASP, 112, 1383
- Dolphin (2005) Dolphin A. E., 2005, DOLPHOT User’s Guide. .
- Durrell et al. (2001) Durrell P. R., Harris W. E., Pritchet C. J., 2001, AJ, 121, 2557
- Durrell et al. (2004) Durrell P. R., Harris W. E., Pritchet C. J., 2004, AJ, 128, 260
- Eggen et al. (1962) Eggen O. J., Lynden-Bell D., Sandage A. R., 1962, ApJ, 136, 748
- Ferguson et al. (2002) Ferguson A. M. N., Irwin M. J., Ibata R. A., Lewis G. F., Tanvir N. R., 2002, AJ, 124, 1452
- Fleming et al. (1995) Fleming D. E. B., Harris W. E., Pritchet C. J., Hanes D. A., 1995, AJ, 109, 1044
- Freeman & Bland-Hawthorn (2002) Freeman K., Bland-Hawthorn J., 2002, ARA&A, 40, 487
- Fuhrmann (2004) Fuhrmann K., 2004, Astronomische Nachrichten, 325, 3
- Fuhrmann (2008) Fuhrmann K., 2008, MNRAS, 384, 173
- Garcia-Burillo et al. (1992) Garcia-Burillo S., Guelin M., Cernicharo J., Dahlem M., 1992, A&A, 266, 21
- Gilmore & Reid (1983) Gilmore G., Reid N., 1983, MNRAS, 202, 1025
- Gilmore et al. (1995) Gilmore G., Wyse R. F. G., Jones J. B., 1995, AJ, 109, 1095
- Harris et al. (1999) Harris G. L. H., Harris W. E., Poole G. B., 1999, AJ, 117, 855
- Harris et al. (2007) Harris W. E., Harris G. L. H., Layden A. C., Wehner E. M. H., 2007, ApJ, 666, 903
- Harris et al. (2009) Harris W. E., Mouhcine M., Rejkuba M., Ibata R., 2009, MNRAS submitted
- Helmi (2008) Helmi A., 2008, ARA&A, 15, 145
- Helmi et al. (1999) Helmi A., White S. D. M., de Zeeuw P. T., Zhao H., 1999, Nature, 402, 53
- Ibata et al. (2001) Ibata R., Irwin M., Lewis G., Ferguson A. M. N., Tanvir N., 2001, Nature, 412, 49
- Ibata et al. (2009) Ibata R., Mouhcine M., Rejkuba M., 2009, MNRAS submitted
- Ibata et al. (1994) Ibata R. A., Gilmore G., Irwin M. J., 1994, Nature, 370, 194
- Ibata et al. (2003) Ibata R. A., Irwin M. J., Lewis G. F., Ferguson A. M. N., Tanvir N., 2003, MNRAS, 340, L21
- Ivezić et al. (2008) Ivezić Ž., Sesar B., Jurić M., et al. 2008, ApJ, 684, 287
- Jurić et al. (2008) Jurić M., Ivezić Ž., Brooks A., Lupton R. H., Schlegel D., Finkbeiner D., Padmanabhan N., Bond N., Sesar B., et al. 2008, ApJ, 673, 864
- Kalirai et al. (2006) Kalirai J. S., Gilbert K. M., Guhathakurta P., Majewski S. R., Ostheimer J. C., Rich R. M., Cooper M. C., Reitzel D. B., Patterson R. J., 2006, ApJ, 648, 389
- Kamphuis et al. (2007) Kamphuis P., Holwerda B. W., Allen R. J., Peletier R. F., van der Kruit P. C., 2007, A&A, 471, L1
- Koekemoer et al. (2002) Koekemoer A. M., Fruchter A. S., Hook R. N., Hack W., 2002, in Arribas S., Koekemoer A., Whitmore B., eds, The 2002 HST Calibration Workshop : Hubble after the Installation of the ACS and the NICMOS Cooling System MultiDrizzle: An Integrated Pyraf Script for Registering, Cleaning and Combining Images. pp 337–+
- Kregel & van der Kruit (2005) Kregel M., van der Kruit P. C., 2005, MNRAS, 358, 481
- Martin et al. (2004) Martin N. F., Ibata R. A., Bellazzini M., Irwin M. J., Lewis G. F., Dehnen W., 2004, MNRAS, 348, 12
- Morrison et al. (1990) Morrison H. L., Flynn C., Freeman K. C., 1990, AJ, 100, 1191
- Morrison et al. (1997) Morrison H. L., Miller E. D., Harding P., Stinebring D. R., Boroson T. A., 1997, AJ, 113, 2061
- Mouhcine (2006) Mouhcine M., 2006, ApJ, 652, 277
- Mouhcine et al. (2007) Mouhcine M., Rejkuba M., Ibata R., 2007, MNRAS, 381, 873
- Mouhcine et al. (2005) Mouhcine M., Rich R. M., Ferguson H. C., Brown T. M., Smith T. E., 2005, ApJ, 633, 828
- Mould (2005) Mould J., 2005, AJ, 129, 698
- Norris (1987) Norris J., 1987, ApJLett, 314, L39
- Oosterloo et al. (2007) Oosterloo T., Fraternali F., Sancisi R., 2007, AJ, 134, 1019
- Pietrinferni et al. (2004) Pietrinferni A., Cassisi S., Salaris M., Castelli F., 2004, ApJ, 612, 168
- Rachford et al. (2009) Rachford B. L., Snow T. P., Destree J. D., Ross T. L., Ferlet R., Friedman S. D., Gry C., Jenkins E. B., Morton D. C., Savage B. D., Shull J. M., Sonnentrucker P., Tumlinson J., Vidal-Madjar A., Welty D. E., York D. G., 2009, ApJS, 180, 125
- Rejkuba et al. (2005) Rejkuba M., Greggio L., Harris W. E., Harris G. L. H., Peng E. W., 2005, ApJ, 631, 262
- Renzini (1998) Renzini A., 1998, AJ, 115, 2459
- Riess (2003) Riess A., 2003, ACS ISR 2003-09
- Robin et al. (2003) Robin A. C., Reylé C., Derrière S., Picaud S., 2003, A&A, 409, 523
- Ryan & Norris (1991) Ryan S. G., Norris J. E., 1991, AJ, 101, 1835
- Sancisi et al. (2008) Sancisi R., Fraternali F., Oosterloo T., van der Hulst T., 2008, ARA&A, 15, 189
- Saviane et al. (2000) Saviane I., Rosenberg A., Piotto G., Aparicio A., 2000, A&A, 355, 966
- Schlegel et al. (1998) Schlegel D. J., Finkbeiner D. P., Davis M., 1998, ApJ, 500, 525
- Scoville et al. (1993) Scoville N. Z., Thakkar D., Carlstrom J. E., Sargent A. I., 1993, ApJLett, 404, L59
- Searle & Zinn (1978) Searle L., Zinn R., 1978, ApJ, 225, 357
- Seth et al. (2005a) Seth A. C., Dalcanton J. J., de Jong R. S., 2005a, AJ, 129, 1331
- Seth et al. (2005b) Seth A. C., Dalcanton J. J., de Jong R. S., 2005b, AJ, 130, 1574
- Sirianni et al. (2005) Sirianni M., Jee M. J., Benítez N., Blakeslee J. P., Martel A. R., Meurer G., Clampin M., De Marchi G., Ford H. C., Gilliland R., Hartig G. F., Illingworth G. D., Mack J., McCann W. J., 2005, PASP, 117, 1049
- Tikhonov & Galazutdinova (2005) Tikhonov N. A., Galazutdinova O. A., 2005, Astrophysics, 48, 221
- van der Kruit (1984) van der Kruit P. C., 1984, A&A, 140, 470
- VandenBerg et al. (2006) VandenBerg D. A., Bergbusch P. A., Dowler P. D., 2006, ApJS, 162, 375
- Yanny et al. (2003) Yanny B., Newberg H. J., Grebel E. K., Kent S., Odenkirchen M., Rockosi C. M., Schlegel D., Subbarao M., Brinkmann J., Fukugita M., Ivezić Ž., Lamb D. Q., Schneider D. P., York D. G., 2003, ApJ, 588, 824
- Yoachim & Dalcanton (2005) Yoachim P., Dalcanton J. J., 2005, ApJ, 624, 701
- Zibetti & Ferguson (2004) Zibetti S., Ferguson A. M. N., 2004, MNRAS, 352, L6
- Zibetti et al. (2004) Zibetti S., White S. D. M., Brinkmann J., 2004, MNRAS, 347, 556
- Zoccali et al. (2003) Zoccali M., Renzini A., Ortolani S., Greggio L., Saviane I., Cassisi S., Rejkuba M., Barbuy B., Rich R. M., Bica E., 2003, A&A, 399, 931