Evidence for the disky origin of luminous Virgo dwarf ellipticals from the kinematics of their globular cluster systems11affiliation: Some of the data presented herein were obtained at the W.M. Keck Observatory, which is operated as a scientific partnership among the California Institute of Technology, the University of California and the National Aeronautics and Space Administration. The Observatory was made possible by the generous financial support of the W.M. Keck Foundation.
Abstract
We report evidence for dynamically significant rotation in the globular cluster systems of two luminous Virgo dwarf ellipticals, VCC1261 and VCC1528. Including previous results for VCC1087, the globular cluster systems of all three Virgo dwarf ellipticals studied in detail to date exhibit . Taking the rotation seen in the globular clusters as a maximal disk rotation, and accounting for the possible fading of any hypothetical progenitor galaxy, we find all three dEs lie on the -band Tully-Fisher relation. We argue that these data support the hypothesis that luminous dEs are the remnants of transformed disk galaxies. We also obtained deep, longslit data for the stars in VCC1261 and VCC1528. Both these galaxies show rapid rotation in their inner regions, with spatial scales of kpc. These rotation velocities are surprisingly similar to those seen in the GC systems. Since our longslit data for Virgo dEs extend out to 1–2 effective radii (typical of deep observations), whereas the globular clusters extend out to 4–7 effective radii, we conclude that non-detections of rotation in many luminous dEs may simply be due to a lack of radial coverage in the stellar data, and that globular clusters represent singularly sensitive probes of the dynamics of dEs. Based on these data, we suggest that gas disks are significant sites of globular cluster formation in the early universe.
1 Introduction
Growing observational evidence suggests that a significant fraction of dwarf elliptical galaxies (dEs) are the remnants of transformed late-type disk galaxies (Kormendy 1985). Some of the most striking evidence for this are features such as vestigal disk and bar structures observed in many present-day dEs (e.g., Jerjen et al. 2000; Barazza et al. 2002). In a comprehensive analysis, Lisker et al. (2006) analyzed multi-band SDSS imaging of 476 Virgo cluster dEs. These authors found that more than 50% of luminous Virgo dEs (M) show evidence for disk features. These disky dEs (“dEdis” to use the term of Lisker et al. 2006) also exhibit different clustering properties to “normal” dEs; Virgo dEdis appear relatively unclustered and follow the spatial distributions of irregulars and spiral galaxies, whereas dEs are highly clustered like E/S0 galaxies. Moreover, the luminosity functions of dEdis and dEs seem to differ, with the number fraction of dEdis relative to dEs declining sharply with decreasing luminosity.
Perhaps less conspicuous than overt spiral structure, but equally compelling evidence for a disky origin for some dEs has come from dE kinematics. Integrated light studies suggest that a number of dEs are rotationally supported (Pedraz et al. 2002; Simien & Prugniel 2002; Geha et al. 2003; van Zee et al. 2004)111The exact definition of rotational support varies among authors. Here, we consider as “disky”. . For example, van Zee et al. (2004) found that 7/16 dEs in their sample showed dynamically significant rotation. These authors used these data and other observables to argue for multiple channels of dEs formation; ram-pressure stripping of dwarf irregulars (dIs) in the galaxy cluster potential, tidal perturbation of dIs, and also for the infall of essentially pre-formed dEs.
However, a key problem in the kinematic analyses of dEs has been their limited spatial extent. Deep integrated light observations generally do not reach beyond one galaxy effective radius (Re). For a disk galaxy with a luminosity typical of luminous dEs, this roughly corresponds to one disk scalelength. By contrast, HI rotation curves for spirals/dIs may typically extend to beyond 5 disk scalelengths. If dEs were to lose mass and their stellar populations fade during their transformation in the cluster environment (e.g., Mastropietro et al. 2005) then the problem becomes more acute; the more the progenitor galaxy has faded, the smaller fraction of the progenitor disk scalelength can be measured in the remnant galaxy.
In this context, a powerful alternative to studying the integrated stars of the galaxy itself is to study its globular clusters (GCs). The GC systems of both giant and dwarf galaxies are more spatially extended than the host galaxy light, reaching beyond 10 galaxy Re in some cases, and with the appropriate instrumentation are amenable to spectroscopy (see Brodie & Strader 2006 for a review). In a pilot study, Beasley et al. (2006) obtained Keck/LRIS spectroscopy for 12 GCs in the luminous Virgo dE VCC1087 extending out to galaxy Re. The kinematics of the GCs in this galaxy show , i.e. dynamically important rotation. The existing integrated light data for this galaxy shows no rotation out to Re (Geha et al. 2003).
Clearly, it is hard to draw firm conclusions from one object. Here we present GC kinematics for two more luminous Virgo dEs, VCC1261 and VCC1528, which show no morphological evidence of disk features (Lisker et al. 2006). In Section 2 we discuss the observations and data reduction. In Section 3 we present an analysis of the GC data, and also that of our integrated light measurements. In Section 4 we discuss our findings. In the following, we have assumed distance moduli to VCC1261 and VCC1528 of (m-M)=31.29 and 31.06 respectively, taken from the surface brightness distances of Mei et al. (2007). We also adopt -band effective radii (Re) of 20.95 and 9.90 arcsec for the two dEs respectively (Ferrarese et al. 2006).
2 Observations
Spectroscopic masks for VCC1261 and VCC1528 were created based on (F475W) and (F850LP) images taken with the Advanced Camera for Surveys (ACS) as part of the ACS Virgo Cluster Survey (Côté et al. 2004). A detailed discussion of our photometric reductions, photometry and candidate GC selection is given in Beasley et al. (2006) and Strader et al. (2006).
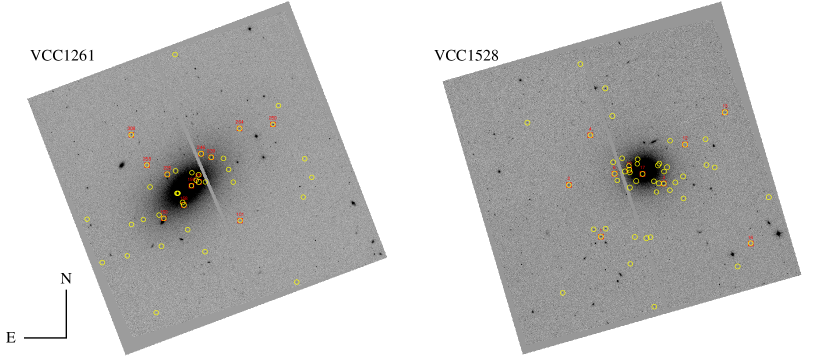
Optical spectra were obtained for 13 GC candidates in VCC1261 and 12 candidates in VCC1528 using the Low Resolution Imaging Spectrograph (LRIS) (Oke et al. 1995) on the Keck I telescope during the nights 22-23 April 2007. Both dEs were observed through a 1.0 arcsec slitmask with integrations of s for VCC1261 and s for VCC1528. The locations of the GCs in the two galaxies are shown in Fig. 1. We obtained simultaneous blue and red spectra through the use of a dichroic which split the beam at 5600Å. On the blue side, a 600 lines/mm grism blazed at 4000Å was used to yield an effective wavelength range of 3300–5600Å and a resolution of 4Å (FWHM). On the red side a 600 lines/mm grating blazed at 5000Å yielded an effective wavelength range of 5700–8200Å and a resolution of 6Å (FWHM). Longslit spectra of both dEs (s VCC1261; s VCC1528) were also obtained along the major axes of these galaxies (P.A. 133 degrees and 97 degrees E through N for VCC1261 and VCC1528 respectively; Ferrarese et al. 2006). For the longslit observations, the blue-side setup was identical to that of the slitmasks, however on the red side, a 831 lines/mm grating was used (with a dichroic splitting the beam at 6800Å) blazed at 8200Å to cover the Ca II triplet region. These Ca II data will be discussed elsewhere. Seeing ranged between 0.8–1.0 arcsec during observations of the VCC1261 mask on the first night, degrading somewhat to 1.1–1.3 arcsec for the VCC1528 mask on the second night.
The reduction of these data was performed with IRAF222IRAF is distributed by the National Optical Astronomy Observatory, which is operated by the Association of Universities for Research in Astronomy, Inc., under cooperative agreement with the National Science Foundation. using standard techniques. All science images were bias-subtracted and then flat-fielded with twilight sky flats which were co-added and normalized. Spectra were optimally extracted and wavelength calibrated with solutions obtained from the arc exposures. Wavelength residuals of 0.1 Å were typical. The zeropoints of the wavelength calibration were checked against skylines in the background spectra, and were in some cases adjusted by up to an Angstrom. The spectra were then combined with cosmic-ray rejection, and flux calibrated using the response function derived from our flux standard. The velocities of the GC candidates were measured by cross-correlation against stellar templates using FXCOR in IRAF. The zeropoints of the velocity scale were checked against MILES model spectra (Vazdekis et al. 2008). These velocities, along with other relevant observables, are listed in Table 1.
3 Analysis
We find robust mean velocities (i.e., the biweight location; Beers et al. 1990) for the VCC1261 and VCC1528 GC systems of km s-1 and km s-1 respectively. These are in agreement with the NED values for the systemic velocities of the two galaxies ( km s-1 and km s-1 ). Using the biweight scale as a robust measure of the line-of-sight velocity dispersions of the GC systems, we obtain km s-1 and km s-1 for VCC1261 and VCC1528 respectively. These quantities are listed in Table 2. For completeness, we also tabulate the corresponding quantities for VCC1087, either listed in, or derived from Beasley et al. (2006).
We looked for rotation in the GC systems using two approaches. We first performed linear unweighted fits to the velocities of the GCs in the two galaxies as a function of projected distance along the galaxy major axes. This assumes that any rotation that might be present in the system is solid body rotation, and that it has its axis is aligned with the galaxy minor axis. Because of our relatively small sample size and wide range in velocity uncertainties, we avoided using weights since the fits might be driven by a few bright GCs (although in practice we found little difference between weighted and unweighted fits). The results of this exercise are shown in the top panels of Fig. 2, and are listed in Table 2. Both GC systems exhibit velocity gradients as a function of project radius along the galaxy major axis, suggestive of net rotation. A “maximum velocity” () was calculated in both cases by multiplying the velocity gradient with the projected radius of the outermost GC. We calculated two values for VCC1261, with and without GC 250 which appears to be an outlier (or is no longer on the rising part of the rotation curve if we are actually looking at a disk system)333Also, two values are given for VCC1087 including and excluding GC 2, which due to its large galactocentric radius, has a strong influence on the fit to these velocities (see Beasley et al. 2006)..
We estimated the significance of this rotation through Monte Carlo simulation. We randomly selected velocities from a Gaussian probability distribution of width equal to the galaxies’ velocity dispersions (where corresponds to our GC sample size). We then performed linear fits to these velocities as a function of radius, which were drawn randomly from the observed radial extent of the GC systems, and asked how many times these simulated gradients were found to be equal to or larger than the observed ones. For VCC1261 we obtained significances of 85% (97%) including (excluding) GC250. In the case of VCC1528, the observed rotation is significant at the 96% level.
The above considerations assume that the line of nodes of any rotation in the GC systems is aligned with the galaxy major axes. To test this assumption we performed non-linear fits to the GC velocities as a function of their position angle with respect to the galaxy. Specifically, we fit sinusoids (see in discussion Côté et al. 2001) to the position angle data in the form:
| (1) |
leaving , , and (the systemic velocity, rotation amplitude and phase – the position angle of the line of nodes – respectively) as free parameters. The results of these fits are listed in Table 2, and are shown as dotted sinusoids in the bottom panels of Fig. 2. As shown in the table, the amplitude of the rotation in the GC systems is consistent with the values derived from the linear fits. The solid sinusoids in Fig. 2 show the best fits for the amplitude and systemic velocities when the phase is fixed to coincide with the position angles of the galaxy major axes. In the case of VCC1261, the two curves coincide suggesting that the axis of rotation is indeed close to the minor axis of the galaxy. For VCC1528 the situation is less clear; the rotation could be misaligned with the galaxy isophotes, but the large uncertainty in our phase estimate prevents any firm conclusions from being drawn.
A common measure of the significance of rotation in a system is the ratio of rotational velocity to velocity dispersion (). Here we take to be , derived from our earlier linear fits to the GC velocities as a function of projected major axis radius. We then subtract a rotation curve of amplitude from the observed velocity dispersions of the GC systems in order to measure . These quantities are listed in Table 2. The GC systems of both dEs show , which suggests dynamically significant rotation.
3.1 Galaxy kinematics
In Fig. 3 we show the major-axis kinematics of the two galaxies from our longslit data444At the time of writing, we do not have deep longslit data for VCC1087.. We reach approximately 1 Re in VCC1261 and 2 Re in VCC1528. Both galaxies show fairly complex kinematical structure. Both show significant velocity gradients at small radii, which seem to become flatter towards the outer parts of the galaxies. Similarly, the galaxy velocity dispersions are lower at radii corresponding to the velocity gradients, increasing at larger radii. To give a sense of scale, 1 Re in VCC1261 and VCC1528 corresponds to approximately 1 and 2 kpc respectively at our adopted distances. Thus, these inner structures have spatial scales of kpc. Such kinematical structures have been noted before in dEs (De Rijcke et al. 2004; Geha et al. 2006) and have been coined kinematically distinct cores (KDCs) in deference to the similar structures seen in giant ellipticals.
The dotted lines in Fig. 3 show the velocity gradients derived for the GCs. The GC and galaxy inner gradients are similar in both magnitude and sign; this is most apparent in the zoomed-in center panels of Fig. 3. Quantifying this, by eye we isolated the galaxy inner regions and performed linear fits. For VCC1261 we obtain a gradient of –52.9 km s-1 arcmin-1 ( Re ). For VCC1528 we obtain 62.9 km s-1 arcmin-1 ( Re ). Linear fits to the velocity data at all radii yields 2.6 km s-1 arcmin-1 and –6.3 km s-1 arcmin-1 for VCC1261 and VCC1528 respectively.
However, in general, for systems where the velocity dispersion is of order the rotation velocity, the observed rotation velocity will not reflect the true circular velocity of the system since the velocity dispersion provides additional dynamical support against gravity. We make such “asymmetric drift” corrections to the observed galaxy rotation curves using the following (e.g., Kormendy 1984):
| (2) |
where is the corrected rotation curve at radius , the observed rotation, and the radial component of the galaxy velocity dispersion. This latter quantity is not measured by us, and we make the assumption that , with being the measured galaxy velocity dispersion (e.g., see Erwin et al. 2003). is the inverse of the disk scalelength, which we set to be the galaxy effective radius.
The observed and corrected rotation curves for the dEs are compared in Fig. 4. As can be seen the “asymmetric drift” corrections are substantial555The asymmetric drift corrections are computed assuming a pure thin disk. Since the velocity dispersions in the galaxy are significant, it may be more appropriate to assume a thick disk, or a thin disk plus “hot” component. In these two cases the corrections would be substantially reduced. However, since we cannot distinguish between these posibilities with the present data, we leave these corrections “as is”..
Weak or no rotation in the observed curves becomes significant rotation in the corrected curves when the dynamical role of velocity dispersion is accounted for. Therefore, both dEs show strong global rotation in the opposite sense to the rotation seen in the GC systems.
3.2 Mass to light ratios
We have estimated the dynamical masses of the dEs by considering that the total mass of the system () as traced by the GCs is given by:
| (3) |
where and are the masses inferred from the velocity dispersion (after subtracting the corresponding rotation curve) and rotation of the GCs respectively. can be estimated using the tracer mass estimator (TME; Evans et al. 2003):
| (4) |
where is the number of test particles (in this case GCs), is the line-of-sight velocity of the th GC and is the projected distance of the th GC from the center of the galaxy. Assuming an isothermal-like potential, is given by (Evans et al. 2003):
| (5) |
here, and are the inner and outer radii at which the volume density of the population goes as . We measured the surface densities of the GC systems from the ACS photometry, fitting the radially binned data with the functional form . These were then deprojected to yield (i.e., ).
The rotational mass, , was calculated assuming solid-body rotation using:
| (6) |
We list our measurements of , the dynamical masses and the B-band mass-to-light ratios () in Table 2. The B-band absolute magnitudes for VCC1261 and VCC1528 were derived from the apparent magnitudes in Binggeli et al. (1985), the distance moduli from Mei et al. (2006) and foreground extinction values from Schlegel et al. (1998).
In Fig 5. we plot the derived for VCC1261, VCC1528 and VCC1087 compared to determinations from integrated light kinematics for Elliptical and S0 galaxies ( in Cappellari et al. 2006) and Virgo dEs (Geha et al. 2002). Unlike the case for our dE sample, the above studies obtain dynamical masses for the galaxies inside an Re. We have not included predictions from stellar population models, since these are highly dependent upon the choice of initial mass function, and the adopted lower stellar mass cut-off. Using GCs to increase the radius at which mass can be traced, we see that the three dEs in our sample lie above the measurements from Cappellari et al. (2006) and Geha et al. (2002) for a given B-band magnitude. However, as can be seen from our estimates of and listed in Table 2, dominates the mass budget at large radii. In the cases of VCC1261 and VCC1528, large values are driven by single GCs. Excluding these objects brings and reduces somewhat.
In our estimates of the rotation of the GCs, we do not take into account the inclination of the GC systems due to the unknown the geometry of the systems. However, in the extreme case that we are viewing what are essentially thin disks at some unknown inclination , and that the GC systems are inclined similarly to the host dE isophotes, we may estimate the inclinations of the systems (i.e., sin =1–). In this case, the GC systems of VCC1261 and VCC1528 may be inclined (from edge-on, ) by and respectively. This being the case, our values for for the GC systems of VCC1261 and VCC1528 would be underestimated by 70% and 83% respectively, and the mass to light ratios we have determined would be underestimated by a factor of 2.5 for both systems.
4 Discussion and Summary
The kinematics of the three GC systems of luminous Virgo dwarf elliptical galaxies studied in detail to date, VCC1261, VCC1528 and VCC1087 (Beasley et al. 2006), all show evidence for significant rotation, i.e. . For these GC systems to exhibit such strong rotation, they must have either acquired their angular momentum within the cluster environment (i.e. they were “spun-up”), and/or their progenitors were already rapidly rotating systems.
De Rijcke et al. (2004) discuss the former possibility within the context of explaining the presence of kinematically decoupled cores in the centers of some dEs. These authors used the impulse approximation to estimate the amount of orbital angular momentum which may be transferred to a dE halo from fly-by encounters with massive galaxies. These authors conclude that such encounters can spin-up slowly rotating systems by tens of km s-1 for small impact parameters ( 20 kpc). However, -body simulations by González-García et al. (2005) suggest that this process is much less efficient than the impulse approximation suggests. They found that essentially head-on collisions are required to achieve significant velocity reversals (in already rotating systems). The process becomes even less efficient if the dE possesses a dark matter halo, since the halo absorbs much of the orbital angular momentum of the encounter. Numerical simulations of fly-by encounters between a massive galaxy and dEs+GCs in the cluster environment are required to investigate this possibility further.
Another interpretation is that the dEs were formerly late-type galaxies, and their GCs formed part of what was a disk component. Indeed, many dEs show embedded disks (Barrazza et al. 2002; De Rijcke et al. 2003; Lisker et al. 2006; Chilingarian et al. 2007), or rotational flattening of the spheroid stars (Pedraz et al. 2002; Geha et al. 2003; van Zee et al. 2004). -body simulations suggest that galaxy cluster tidal forces can strip stars, gas and dark matter from a late-type disk galaxy that falls into the cluster potential (Moore et al. 1996). Mastropietro et al. (2005) showed that subsequent internal dynamical processes can transform the stripped disk into a hot spheroidal system on Gy timescales, leading to a remnant that looks like a dE galaxy. Importantly, the majority of simulated dEs formed in this manner exhibit some memory of their previous condition, morphologically (residual disk structure) and/or kinematically (rotation).
The idea that old GCs in late-type galaxies may belong to disk rather than halo populations finds support in the work of Olsen et al. (2004). These authors found that the GC systems of Sculptor spirals show rotation broadly consistent with their HI gas. A similar situation may also be true of the GCs in the Large Magellanic Cloud (Schommer et al. 1992) and in M31 (Perrett et al. 2002; Morrison et al. 2005) (although in the latter case sample contamination confuses the issue; Beasley et al. 2004; Cohen et al. 2005). Interestingly, the GC systems of several S0 galaxies also show disk-like kinematics (Kuntschner et al. 2002; Chomiuk et al. 2008).
One expectation of the above interpretation is that the progenitor disk should have obeyed the Tully-Fisher (TF) relation (Tully & Fisher 1977). In Fig. 6 we show the -band TF relation for isolated galaxies from Blanton et al. (2007). On this we have placed the three VCC galaxies, using SDSS -band luminosities and the SBF distances of Mei et al. (2007). The rotation velocities () are our measurements of the GC systems and from Beasley et al. (2006). The positions of all three dwarfs are consistent with our fit to the three brightest TF bins (–5 log; ).
If we are looking at a remnant population, one might expect that the progenitor disks were more luminous than the remnants due to mass-loss during “harassment”, and due to the subsequent ageing of the stellar populations. The arrows in Fig. 6 show the maximum brightening allowed for the dEs to remain consistent with the fit to the relation. These correspond to 1–2 mag depending upon the galaxy. An extra 0.5 mag is permitted if the scatter in the TF relation is also taken into account. In terms of stellar mass-loss, this corresponds to 70–95% stellar mass loss for a given mass to light ratio, which is consistent with the levels of mass-loss seen in the simulations of Mastropietro et al. (2005) for dwarfs near the cluster center. We have not included age-fading which will reduce the amount of allowable mass-loss somewhat. The point here is that any progenitor disks could have been up to 2 mag brighter than the remnant dEs and still lie on the TF relation. In contrast, in the previously discussed scenario whereby the dEs are spun-up by fly-by encounters, one would not expect these galaxies to lie on the TF relation. Clearly, decreasing the uncertainties in our rotation estimates through increasing the sample sizes and/or reducing the individual velocity uncertainties would help constrain these ideas.
In terms of the galaxy kinematics, VCC1261 and VCC1528 show corotation similar to the GCs within Re, with weak or no (counter)rotation beyond this radius. The situation for VCC1087 is unclear since we do not possess deep longslit data for this galaxy. The similarity between the inner galaxy kinematics and the GCs may be coincidental; the GC rotation is measured out to Re whereas the “inner disks” do not extend beyond Re. However, the fact that this behaviour is seen in both dEs seems to suggest a real connection between the two.
Irrespective of whether the galaxy inner regions and the GCs are kinematically connected, more puzzling is why the galaxy kinematics beyond Re show no rotation. It is possible that the GCs and the galaxy stars represent distinct kinematical components. Since any external dynamical process (such as fly-by encounters) will presumably affect the stars and GCs similarly at a given radius, a kinematical decoupling argues for some level of dissipation. For example, we may speculate that a dE with gas and a pre-formed GC disk system could have fallen into the cluster. This gas may then have been shocked and formed stars, resulting in a system with an old disk and a younger pressure-supported system.
Although the possibility of such decoupling between stars and GCs cannot presently be ruled out, a more prosaic explanation may be that the dE stars are rotating, but we cannot see it due to the limited radial extent of these galaxy data. Our longslit data for VCC1261 and VCC1528 reaches and Re respectively (1.6 kpc and 0.8 kpc respectively, typical of deep, longslit observations). If these galaxies were dwarf irregulars with the luminosities of the present-day dEs, these data would correspondingly reach to 1–2 disk scalelengths. By way of comparison, typical HI rotation curves extend to disk scalelengths (see van Zee et al. 2004).
Since disk galaxies obey a well-defined luminosity-size relation, this lack of radial coverage in the longslit data of dEs becomes more acute if we consider that the hypothetical progenitor disks may have been more luminous than their remnants. If, for example, we consider a disk galaxy 1 magnitude more luminous than VCC1261, which may have had a disk scalelength of kpc, we find that our longslit data might be probing a mere disk scalelengths of this galaxy. A similar argument for VCC1528 suggest we might probe disk scalelengths. In contrast, the outermost GCs in our two samples lie at and Re (6.4 kpc and 5.6 kpc) for VCC1261 and VCC1528 respectively, corresponding to 1.3 and 3.5 disk scalelengths. Therefore, it seems quite possible that the kinematical data in these galaxies simply does not go out sufficiently far in radius to be sensitive any rotation present.
Clearly detailed numerical simulations are required to address some of the above ideas. However, based on these data we argue that the GC systems of luminous dEs may represent vestigal disk systems of late type galaxies. The identification of disk GC systems in both the Virgo cluster and in the Sculptor group (Olsen et al. 2004) suggests that gas disks may have been significant sites of GC formation at early times.
5 Acknowledgments
MB and AJC thank Inma Martínez Valpuesta for very insightful discussions about disks. The authors also thank the anonymous referee for useful suggestions on improving the manuscript. Funding for the SDSS and SDSS-II has been provided by the Alfred P. Sloan Foundation, the Participating Institutions, the National Science Foundation, the U.S. Department of Energy, the National Aeronautics and Space Administration, the Japanese Monbukagakusho, the Max Planck Society, and the Higher Education Funding Council for England. The SDSS Web Site is http://www.sdss.org/. The SDSS is managed by the Astrophysical Research Consortium for the Participating Institutions. The Participating Institutions are the American Museum of Natural History, Astrophysical Institute Potsdam, University of Basel, University of Cambridge, Case Western Reserve University, University of Chicago, Drexel University, Fermilab, the Institute for Advanced Study, the Japan Participation Group, Johns Hopkins University, the Joint Institute for Nuclear Astrophysics, the Kavli Institute for Particle Astrophysics and Cosmology, the Korean Scientist Group, the Chinese Academy of Sciences (LAMOST), Los Alamos National Laboratory, the Max-Planck-Institute for Astronomy (MPIA), the Max-Planck-Institute for Astrophysics (MPA), New Mexico State University, Ohio State University, University of Pittsburgh, University of Portsmouth, Princeton University, the United States Naval Observatory, and the University of Washington.
This research has made use of the NASA/IPAC Extragalactic Database (NED) which is operated by the Jet Propulsion Laboratory, California Institute of Technology, under contract with the National Aeronautics and Space Administration.
Funding support comes from NSF grant AST-0507729. J.S. was supported by NASA through a Hubble Fellowship grant, awarded by the Space Telescope Science Institute, which is operated by the Association of Universities for Research in Astronomy, Inc., under NASA contract NAS 5-26555. The authors wish to recognize and acknowledge the very significant cultural role and reverence that the summit of Mauna Kea has always had within the indigenous Hawaiian community. We are most fortunate to have the opportunity to conduct observations from this mountain.
References
- Barazza et al. (2002) Barazza, F. D., Binggeli, B., & Jerjen, H. 2002, A&A, 391, 823
- (2) Beasley, M. A., Strader, J., Brodie, J. P., Cenarro, A. J., & Geha, M. 2006, AJ, 131, 814
- Beasley et al. (2004) Beasley, M. A., Brodie, J. P., Strader, J., Forbes, D. A., Proctor, R. N., Barmby, P., & Huchra, J. P. 2004, AJ, 128, 1623
- Beers et al. (1990) Beers, T. C., Flynn, K., & Gebhardt, K. 1990, AJ, 100, 32
- Binggeli et al. (1985) Binggeli, B., Sandage, A., & Tammann, G. A. 1985, AJ, 90, 1681
- Blanton et al. (2007) Blanton, M. R., Geha, M., & West, A. A. 2007, ArXiv e-prints, 707, arXiv:0707.3813
- Cappellari et al. (2006) Cappellari, M., et al. 2006, MNRAS, 366, 1126
- (8) Cenarro, A. J., Beasley, M. A., Strader, J., Brodie, J. P., & Forbes, D. A. 2007, AJ, 134, 391
- Chilingarian et al. (2007) Chilingarian, I. V., Prugniel, P., Sil’Chenko, O. K., & Afanasiev, V. L. 2007, MNRAS, 376, 1033
- Chomiuk et al. (2008) Chomiuk, L., Strader, J., & Brodie, J. P. 2008, AJ, 136, 234
- Côté et al. (2004) Côté, P., et al. 2004, ApJS, 153, 223
- Côté et al. (2001) Côté, P., et al. 2001, ApJ, 559, 828
- Cohen et al. (2005) Cohen, J. G., Matthews, K., & Cameron, P. B. 2005, ApJ, 634, L45
- De Rijcke et al. (2003) De Rijcke, S., Dejonghe, H., Zeilinger, W. W., & Hau, G. K. T. 2003, A&A, 400, 119
- Erwin et al. (2003) Erwin, P., Beltrán, J. C. V., Graham, A. W., & Beckman, J. E. 2003, ApJ, 597, 929
- Evans et al. (2003) Evans, N. W., Wilkinson, M. I., Perrett, K. M., & Bridges, T. J. 2003, ApJ, 583, 752
- Ferrarese et al. (2006) Ferrarese, L., et al. 2006, ApJS, 164, 334
- Geha et al. (2006) Geha, M., Blanton, M. R., Masjedi, M., & West, A. A. 2006, ApJ, 653, 240
- Geha et al. (2005) Geha, M., Guhathakurta, P., & van der Marel, R. P. 2005, AJ, 129, 2617
- Geha et al. (2003) Geha, M., Guhathakurta, P., & van der Marel, R. P. 2003, AJ, 126, 1794
- Geha et al. (2002) Geha, M., Guhathakurta, P., & van der Marel, R. P. 2002, AJ, 124, 3073
- González-García et al. (2005) González-García, A. C., Aguerri, J. A. L., & Balcells, M. 2005, A&A, 444, 803
- Jerjen et al. (2000) Jerjen, H., Kalnajs, A., & Binggeli, B. 2000, A&A, 358, 845
- Kormendy (1984) Kormendy, J. 1984, ApJ, 286, 116
- Kormendy (1985) Kormendy, J. 1985, ApJ, 295, 73
- Kuntschner et al. (2002) Kuntschner, H., Ziegler, B. L., Sharples, R. M., Worthey, G., & Fricke, K. J. 2002, A&A, 395, 761
- Lisker et al. (2006) Lisker, T., Grebel, E. K., & Binggeli, B. 2006, AJ, 132, 497
- Mastropietro et al. (2005) Mastropietro, C., Moore, B., Mayer, L., Debattista, V. P., Piffaretti, R., & Stadel, J. 2005, MNRAS, 364, 607
- Mei et al. (2007) Mei, S., et al. 2007, ApJ, 655, 144
- Moore et al. (1996) Moore, B., Katz, N., Lake, G., Dressler, A., & Oemler, A. 1996, Nature, 379, 613
- Morrison et al. (2004) Morrison, H. L., Harding, P., Perrett, K., & Hurley-Keller, D. 2004, ApJ, 603, 87
- Oke et al. (1995) Oke, J. B., et al. 1995, PASP, 107, 375
- Olsen et al. (2004) Olsen, K. A. G., Miller, B. W., Suntzeff, N. B., Schommer, R. A., & Bright, J. 2004, AJ, 127, 2674
- Pedraz et al. (2002) Pedraz, S., Gorgas, J., Cardiel, N., Sánchez-Blázquez, P., & Guzmán, R. 2002, MNRAS, 332, L59
- Perrett et al. (2002) Perrett, K. M., Bridges, T. J., Hanes, D. A., Irwin, M. J., Brodie, J. P., Carter, D., Huchra, J. P., & Watson, F. G. 2002, AJ, 123, 2490
- Pizagno (2006) Pizagno, J. L. I. 2006, Ph.D. Thesis, Ohio State University, 2006.
- Schlegel et al. (1998) Schlegel, D. J., Finkbeiner, D. P., & Davis, M. 1998, ApJ, 500, 525
- Schommer et al. (1992) Schommer, R. A., Suntzeff, N. B., Olszewski, E. W., & Harris, H. C. 1992, AJ, 103, 447
- Simien & Prugniel (2002) Simien, F., & Prugniel, P. 2002, A&A, 384, 371
- Springob et al. (2005) Springob, C. M., Haynes, M. P., Giovanelli, R., & Kent, B. R. 2005, ApJS, 160, 149
- Strader et al. (2006) Strader, J., Brodie, J. P., Spitler, L., & Beasley, M. A. 2006, AJ, 132, 2333
- Tully & Fisher (1977) Tully, R. B., & Fisher, J. R. 1977, A&A, 54, 661
- van Zee et al. (2004) van Zee, L., Skillman, E. D., & Haynes, M. P. 2004, AJ, 128, 121
- (44) Vazdekis et al. 2008, in preparation.


| Target | RA(J2000) | DEC(J2000) | RV | Class. | ||
|---|---|---|---|---|---|---|
| (AB mag) | (km s-1 ) | |||||
| VCC1261 | ||||||
| GC250 | 12:30:05.98 | 10:47:34.76 | 22.350.01 | 1.030.01 | 187721 | GC |
| GC101 | 12:30:07.59 | 10:46:20.50 | 23.550.02 | 0.770.03 | 175750 | GC |
| GC264 | 12:30:07.69 | 10:47:31.26 | 23.740.02 | 1.140.03 | 180236 | GC |
| GC239 | 12:30:09.13 | 10:47:08.76 | 21.650.01 | 1.170.01 | 18149 | GC |
| GC246 | 12:30:09.65 | 10:47:11.39 | 21.880.01 | 1.200.01 | 179711 | GC |
| GC201 | 12:30:09.74 | 10:46:49.73 | 22.540.02 | 1.070.03 | 190228 | GC |
| GC198 | 12:30:10.12 | 10:46:46.72 | 23.290.13 | 1.070.20 | 18268 | GC |
| GC158 | 12:30:10.50 | 10:46:31.86 | 21.840.01 | 0.960.01 | 188412 | GC |
| GC235 | 12:30:11.37 | 10:46:55.13 | 23.510.02 | 0.960.03 | 198926 | GC |
| GC150 | 12:30:11.52 | 10:46:21.37 | 23.370.03 | 0.970.04 | 191327 | GC |
| GC258 | 12:30:12.42 | 10:47:02.05 | 22.640.01 | 0.890.01 | 188914 | GC |
| GC308 | 12:30:13.25 | 10:47:25.12 | 22.520.01 | 1.030.02 | 191228 | GC |
| GC113 | 12:30:13.37 | 10:45:52.11 | 23.770.02 | 0.760.03 | 5029 | star |
| VCC1528 | ||||||
| GC16 | 12:33:46.35 | 13:18:25.6 | 23.600.02 | 0.750.04 | 178073 | GC |
| GC13a | 12:33:47.53 | 13:20:02.5 | 22.900.20 | 1.600.40 | 172149 | GC |
| GC8 | 12:33:48.73 | 13:21:06.9 | 23.070.01 | 0.850.02 | 8529 | star |
| GC12 | 12:33:49.54 | 13:19:39.2 | 23.020.01 | 0.770.02 | 168639 | GC |
| GC3 | 12:33:50.64 | 13:19:10.8 | 22.080.01 | 0.820.01 | 173815 | GC |
| GC17 | 12:33:51.69 | 13:19:18.1 | 22.910.06 | 1.080.10 | 17099 | GC |
| GC10 | 12:33:52.35 | 13:19:21.4 | 23.050.03 | 0.900.05 | 164015 | GC |
| GC6 | 12:33:53.09 | 13:19:18.7 | 22.710.01 | 0.920.02 | 166638 | GC |
| GC1 | 12:33:53.83 | 13:18:32.5 | 21.720.01 | 0.800.01 | 169311 | GC |
| GC4 | 12:33:54.26 | 13:19:47.4 | 22.390.01 | 0.940.01 | 165935 | GC |
| GC2 | 12:33:55.38 | 13:19:11.0 | 22.070.01 | 0.960.01 | 161413 | GC |
| GC11 | 12:33:57.81 | 13:18:21.4 | 23.000.01 | 1.100.02 | 23924 | star |
| Quantity | VCC1261 | VCC1528 | VCC1087 | |
|---|---|---|---|---|
| MB | –17.85 | –16.72 | –16.87 | |
| (km s-1 arcmin-1) | –5146 (–10142) | 5217 | 8729 (7431) | |
| (km s-1 ) | 7164 (10544) | 6321 | 10435 (4921) | |
| (km s-1 ) | 4731 | 6840 | ||
| (degrees) | 15227 | 43136 | 12950 | |
| (km s-1 ) | 186519 | 168121 | 68119 | |
| (km s-1 ) | 6725 | 5021 | 15 | |
| (km s-1 ) | 5513 | 239 | 3516a | |
| 1.30.7 (1.80.5) | 2.70.5 | 3.00.6b (1.60.6) | ||
| 1.90.4 | 2.00.3 | 2.10.4 | ||
| Mpres | () | 0.520.17 (0.530.16) | 0.200.09 | 0.350.15 (0.490.23) |
| Mrot | () | 0.560.50 (1.670.7) | 0.520.17 | 2.210.64 (0.340.15) |
| 5.02.5 (10.23.3) | 9.52.5 | 29.38.7 (6.82.2) |
Note. — Rows denote (1): absolute B-band magnitude, (2) velocity gradient from linear fits, (3) maximal rotation from linear fits, (4) rotation from nonlinear fits, (5) position angle of line of nodes from nonlinear fits, (6) systemic velocity from nonlinear fits, (7) observed velocity dispersion, (8) velocity dispersion corrected for rotation, (9) ratio of rotation velocity to velocity dispersion for the GCs, (10) power-law exponent of GC volume density profile, (11) mass from TME, (12) mass from rotation, (13) B-band mass to light ratio. Values in parentheses give values calculated removing GC250 in VCC1261 and GC2 in VCC1087.