Disorder and temperature renormalization of interaction contribution to the conductivity in two-dimensional InxGa1-xAs electron systems
Abstract
We study the electron-electron interaction contribution to the conductivity of two-dimensional In0.2Ga0.8As electron systems in the diffusion regime over the wide conductivity range, , where . We show that the data are well described within the framework of the one-loop approximation of the renormalization group (RG) theory when the conductivity is relatively high, . At lower conductivity, the experimental results are found to be in drastic disagreement with the predictions of this theory. The theory predicts much stronger renormalization of the Landau’s Fermi liquid amplitude, which controls the interaction in the triplet channel, than that observed experimentally. A further contradiction is that the experimental value of the interaction contribution does not practically depend on the magnetic field, whereas the RG theory forecasts its strong decrease due to decreasing diagonal component of the conductivity tensor in the growing magnetic field.
pacs:
73.20.Fz, 73.61.EyI Introduction
A contribution of electron-electron (e-e) interaction to the conductivity is studied since 1980.Altshuler ; Fin At high value of the Drude conductivity, , where is Fermi quasimomentum, is the mean free path, and , and in the diffusion regime, , where is transport relaxation time, this contribution is:
| (1) |
where stands for the Landau’s Fermi liquid amplitude. The coefficient has two terms coming from singlet and triplet channels [the first and second terms in Eq. (1), respectively]. They are opposite in sign favoring localization and antilocalization, respectively. In conventional conductors the value is small, and the net effect is in favor of localization. Together with the weak localization (WL) it leads to dielectric behavior of the conductivity, : . However, the analysis of the e-e interaction contribution performed in the framework of the theory of the renormalization group (RG)Cast1 ; Cast2 ; Cast3 ; FinRev ; Fin1 ; Fin2 shows that the reduction of the temperature and/or conductivity should lead to renormalization of the Fermi liquid amplitude . At or in dilute systems this amplitude may be significantly enhanced due to e-e correlations that can result in a metallic-like dependence of the conductivity: . The theoretical study within the one-loop approximation for arbitrary valley degeneracy was carried out in Refs. Fin1, and Fin2, . The role of two-loop diagrams was studied for two cases only. The first case relates to multivalley systems () with .Fin2 The second one is single valley system () with large value.Kirkpatr90 The RG theory has been used with advantage for understanding of the temperature dependence of the conductivity and metal-insulator transition in Si-MOSFETs.Fin1 ; Knyaz06 ; Anis07 ; Knyaz08 As far as we know there are no data confirming the region of validity of this theory for the simplest 2D systems with the single valley isotropic spectrum in the deeply diffusion regime for which the RG equations were derived.
Besides, the analysis of the temperature dependence of the conductivity at alone is not reliable way to understand the role of the renormalization of e-e interaction and range of validity of the one-loop approximation. It is because there are lot of effects, such as the weak localization and antilocalization, the ballistic contribution of the e-e interaction, the temperature dependent screening, the temperature dependent disorder and so on, which govern the temperature dependence of the conductivity along with the e-e interaction. Certain of these effects are poorly controlled. Experimentally, it manifests itself as that the values of the interaction contribution to the conductivity found from the temperature dependence of conductivity at and at are significantly different even in the case of high conductivity.Yasin05
From our point of view the reliable results can be obtained only from simultaneous analysis of the data obtained at and at low and high magnetic fields. The unique property of the e-e interaction in the diffusion regime is the fact that it contributes to the diagonal component of the conductivity tensor, , only. Just this feature gives a possibility to obtain experimentally the e-e interaction contribution to the conductivity even for the low conductivity when the interference contribution dominates.Minkov03 ; Minkov07 Following this line of attack and analyzing the experimental results obtained for the 2D electron gas in the GaAs/In0.2Ga0.8As/GaAs single quantum well the authors of Ref. Minkov03, come to the conclusion that the temperature dependence of the e-e interaction contribution remains logarithmical over the wide conductivity range, : . However, the coefficient is found dependent on the disorder strength. Its value drastically decreases when decreases, starting from . Although this effect is prominent, it was not since discussed and its origin remained unclear.
In this paper we report the results of the detailed study of the conductivity of 2D electron gas in In0.2Ga0.8As and GaAs single quantum well at and over the wide conductivity range. We begin by considering the predictions of the RG theory. Then, after description of experimental details, we will outline the procedure used for extracting the diffusion part of the interaction correction. Finally, analyzing the temperature dependences of the interaction contribution and the conductivity we will show that the one-loop approximation adequately describes the data while and strongly disagrees with that at lower conductivity. The conflict between the experiment and RG theory arising in the presence of the magnetic field will be discussed as well.
II Predictions of the RG theory
Before to consider and discuss the experimental results let us demonstrate the role of the renormalization.
The temperature dependence of the conductivity and the Fermi liquid amplitude is described in the framework of one-loop approximation of RG theory by the following system of the differential equations:Fin2 ; FinRev ; Cast1 ; Cast2 ; Cast3 ; Fin1
| (2) | |||||
| (3) |
where , and is measured in units of . The quantity is expressed through the Fermi liquid constant : . For the high conductivity, the value of depends on the gas parameters , where is the effective Bohr radius, and for small values isAleiner1
| (4) |
The term in braces in Eq. (2) is responsible for the weak localization and the interaction in singlet channel, which in the case of Coulomb interaction give equal contributions. Eq. (3) describes the renormalization of the Landau’s Fermi liquid amplitude with the temperature and conductivity. One can see from Eq. (3) that the renormalization can be neglected at high conductivity. In this case the integration of Eq. (2) gives
| (5) |
with given by Eq. (1). This expression accords well with the known expression
| (6) |
where is the phase relaxation time controlled in 2D systems by the inelasticity of the e-e interaction. However, Eqs. (2) and (3) predict that the change of the amplitude and, hence, the deviation of the temperature dependence of the conductivity from the logarithmic one is appreciable already at moderate conductivity value. The written is illustrated by Fig. 1, in which the results of numerical solution of Eqs. (2) and (3) are presented. We used the parameters, which are typical for the moderately disordered GaAs/In0.2Ga0.8As/GaAs heterostructures investigated in this paper. The minimal value corresponds to K for all the cases. The following initial conditions have been used. We suppose that the high-temperature conductivity is equal to the Drude conductivity: . This condition seems to be natural. It corresponds to that the diffusion part of interaction correction is equal to zero and the WL correction is much less than the Drude conductivity at . The second condition is , where is determined by Eq. (4).
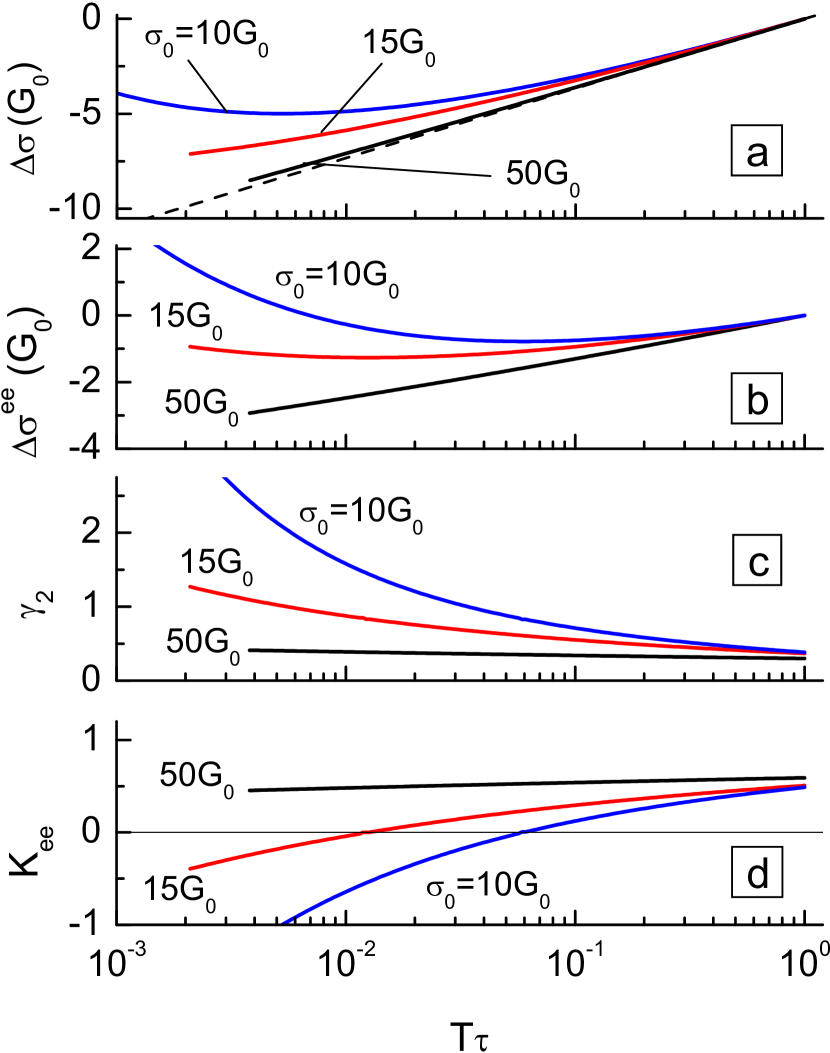
One can see from Fig. 1(c) that the renormalization of for the high Drude conductivity, , is rather small so that the temperature dependence of the conductivity is close to the logarithmic one with the slope determined by the initial value of : [Fig. 1(a)]. Nevertheless, the noticeable decrease of the value with the lowering temperature is evident even for so high conductivity [see Fig. 1(d)]. The value at is approximately equal to , while at is close to .
For the lower Drude conductivity, , the renormalization of with the temperature decrease becomes significant [Fig. 1(c)]. The sign of is changed at from positive at high temperature to negative at lower one [Fig. 1(b)]. However, the temperature dependence of the overall conductivity remains insulating () due to dominating WL contribution. Finally, for , the renormalization of is so huge [Fig. 1(c)] that the metallic behavior of the interaction correction [Fig. 1(b)] wins the insulating behavior of the WL correction at low temperature, and, as consequence, the total conductivity behaves itself metallically at [Fig. 1(a)]. To the best of our knowledge such the behavior was never experimentally observed in the moderately disordered 2D systems of weakly interacting electrons with the simple single-valley energy spectrum, characterizing by and . The goal of this paper is to examine how the one-loop approximation describes the experimental data for such the systems and, thus, establish the region of validity of this theory.
III Experiment
The results of experimental study of the evolution of the diffusion part of the interaction correction to the conductivity in a -type 2D system with decreasing Drude conductivity within the range from to at the temperatures when are reported. The ballistic contribution of the e-e interaction is small under these conditions. The data for two structures, 3510 and 4261, are analyzed. The structure 3510 with moderate disorder has two doping layers disposed in the barriers on each side of the quantum well on the distance of about nm. The structure 4261 with higher disorder has the layer in the center of the quantum well. In more detail the structures design is described in Refs. our5, and Minkov07-1, . The electron density and mobility in the structures are as follows: , cm2/V s for structure 3510, and cm -2 and cm2/V s for structure 4261. The samples were mesa etched into standard Hall bars and then an Al gate was deposited by thermal evaporation onto the cap through a mask. Varying the gate voltage, we changed the electron density in the quantum well and changed the conductivity from its maximal value down to .
Firstly, let us demonstrate that the structures investigated are “normal”, i.e., the transport in zero, low and high magnetic field at the high conductivity, when the renormalization of the e-e interaction should be negligible, is consistent with the following simple model. The temperature dependence of the conductivity in the absence of magnetic field can be described by Eq. (6), whereas in the presence of the magnetic field the conductivity tensor components are
| (7) | |||||
| (8) |
Because the WL correction is actually reduced to the renormalization of the transport relaxation time,Dmitriev97 it is incorporated here into the mobility in such a way that
| (9) |
where
| (10) |
and is described by the expressionHikami80 ; Wittman87
| (11) |
Here, is the transport magnetic field, is a digamma function, and is the prefactor, which value depends on the conductivity if one takes into account two-loop localization correction and the interplay of the weak localization and interaction: .Aleiner99 ; Minkov04
For structure 3510, the low-field magnetoconductivity , which results from the suppression of the interference quantum correction, measured at high conductivity for different temperatures is presented in inset in Fig. 2(a). One can see that the data are well described by Eq. (11). The temperature dependence of within the experimental accuracy is close to [Fig. 2(a)]. This shows that the main mechanism of the phase relaxation is, as expected, inelasticity of the e-e scattering. The prefactor value is close to unity.
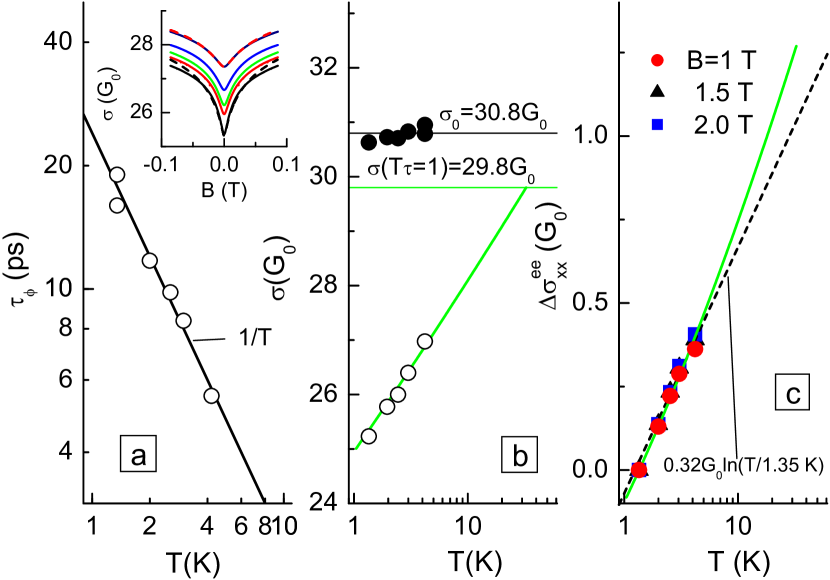
To find the diffusion part of the interaction correction we take approach which has been detailed in our previous paper, Ref. our5, . It uses the unique property of the diffusion correction to contribute to and do not to , see Eqs. (7) and (8). Thus, in order to obtain the correction experimentally one should find such the contribution to the conductivity which exists in but is absent in . The temperature dependences of found in such the way for the different magnetic fields are shown in Fig. 2(c). One can see that these dependences are logarithmic within the experimental accuracy, , and does not depend on the magnetic field. The temperature dependence of the conductivity at is shown in Fig. 2(b). As seen it is also logarithmic, and, what is more important, the slope of the vs dependence is close to the value predicted theoretically for the case when only the WL and interaction correction are responsible for the temperature dependence of [see Eq. (5)]. This fact justifies that there are no additional mechanisms of the -dependence of the conductivity in the samples investigated. It is wholly determined by the temperature dependence of the WL and interaction quantum corrections. Now, knowing the experimental and values one can easily estimate the value of the Drude conductivity with the use of Eq. (6). As seen from Fig. 2(b) the values of found at different temperatures are very close to each other. This attests that the model is adequate and the value of found in this way is a good estimate for the Drude conductivity. Thus, for this case.
Let us compare the experimental temperature dependences of conductivity with that predicted by the RG theory. Solid line in Fig. 2(b) is the result of the numerical solution of Eqs. (2) and (3) with the initial parameters which give the best fit of the data: and . The variation of the e-e interaction contribution shown in Fig. 2(c) has been obtained by subtraction of the WL contribution from the calculated vs curve as follows: . Excellent agreement between the data and solution of the RG equations is evident both for and for .
It is worth noting that the values of and found from the fit are reasonable. The initial value of , , is close to that calculated from Eq. (4), . The value of at is less than the Drude conductivity estimated experimentally by the value of about . The reason is that not all the interference quantum correction is suppressed at . Really, extrapolating the experimental vs dependence to K we obtain for the rest of at : . Thus, the Drude conductivity estimated as is . This value practically coincides with that obtained above, .
It would be fine to trace experimentally the change over the whole temperature range starting from . However, the ballistic contribution of the interaction correction, the partial lifting of the degeneracy of the electron gas, finally, the phonon scattering control the temperature dependence of the conductivity at high temperature. All this makes it impossible to determine the e-e interaction contribution accurately already at . On the other hand, Fig. 1 shows that the renormalization of strongly depends on the value of the Drude conductivity, it should be more pronounced at lower Drude conductivity.
The analysis described above has been carried out over the wide range of the gate voltage which controls the electron density, the mobility and, thus, the Drude conductivity. All the dependences, namely at , , and are similar to that shown in Fig. 2. However, agreement of the data with the solution of Eqs. (2) and (3) is the worse, the lower the conductivity.
Disagreement becomes noticeable already at . It is more visible in vs dependence (see Fig. 3). The experimental dependence remains close to the logarithmic one, while the curve calculated with the initial value shows upturn at K. The value found from the slope of the experimental dependence is approximately equal to , whereas the calculated value of changes from at K to at K. Variation of the initial conditions within the reasonable range does not improve agreement. The dependence calculated remains nonlogarithmic.
The distinction between the calculation and experimental results becomes more clear at lower . As an example we present the data for in Fig. 4. It is seen from Fig. 4(b) that the temperature dependence of the conductivity remains close to the logarithmic one. The temperature dependence of is also close to the logarithmic one with the slope corresponding to .
As in the case of the higher conductivity, the temperature dependence of is close to [Fig. 4(a)] therefore the term responsible for the weak localization in Eq. (2) remains equal to . However, it is impossible to describe the temperature dependence of the conductivity for if one uses found from the experimental Drude conductivity as in the previous case [Fig. 4(b)]. One can suppose that the value of has been obtained with large error and another value should be used as initial one. We tried to describe the data using both and as the fitting parameters. As seen from Fig. 4(b) the much better agreement can be achieved in this case. However, as clearly evident from Fig. 4(c), even with these parameters the calculated dependence strongly deviates from the experimental one. Namely, the upturn of with the temperature decrease predicted by the RG theory is not observed experimentally.
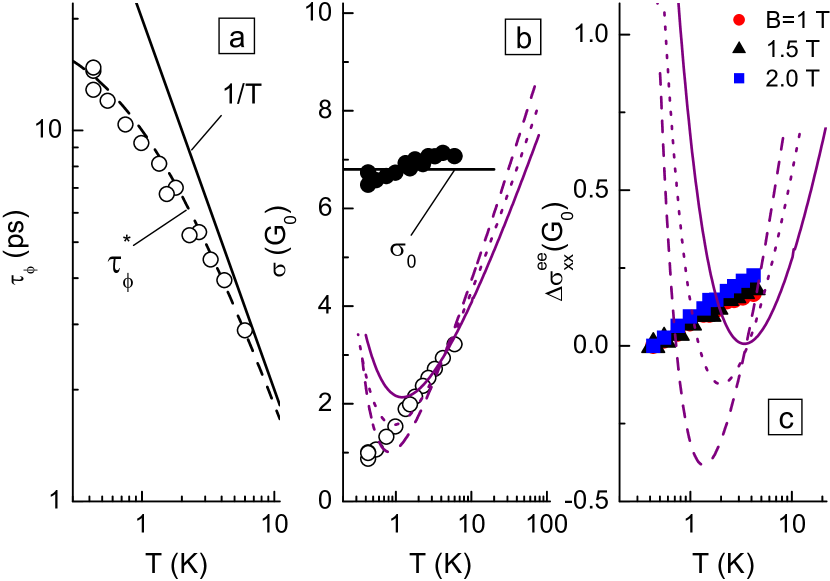
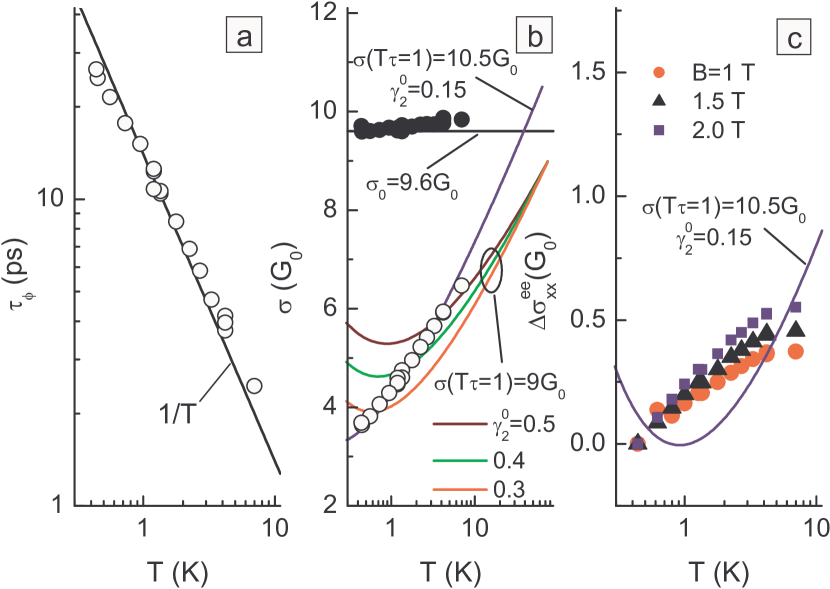
It could be assumed that the procedure of the extraction of the e-e interaction contribution being transparent nevertheless fails. However, the RG theory predicts that not only the e-e interaction contribution should demonstrate the upturn with the temperature decrease at the lower Drude conductivity but the total conductivity as well [see Fig. 1(a)]. In this case the experiment and RG theory can be compared directly without any additional treatment of the data. Therefore, let us inspect the results for the lower Drude conductivity, , presented in Fig. 5. The temperature dependence of found from the low-field negative magnetoresistance deviates from the law demonstrating tendency to saturation at low temperature [see Fig. 5(a)]. As shown in Ref. Minkov07-1, such the behavior results from the fact that the dephasing length (where is the diffusion coefficient) at low becomes comparable with the localization length , and the quantity , rather than is experimentally obtained from the fit of the magnetoresistance. Indeed, the data in Fig. 5(a) are well described by this formula with , ps and that is close to . Since the saturation is not yet observed in our temperature range, the temperature dependence of the conductivity remains close to the logarithmic one [see open symbols in Fig. 5(b)]. In contrast to that, the RG equations predict the upturn of the conductivity within our temperature range independently of the initial and values: and . As discussed above the upturn results from the strong renormalization of that leads not only to the change of sign of , but to large its value as well, so that . In the actual case this results in that the calculated curve following the data at the hight temperature, K, exhibits, nevertheless, minimum at K and growth at lower temperature [see dotted curve in Fig. 5(b)].
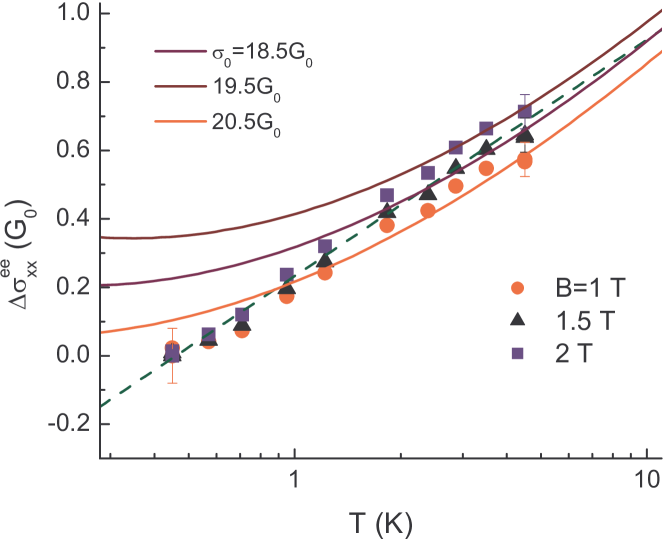
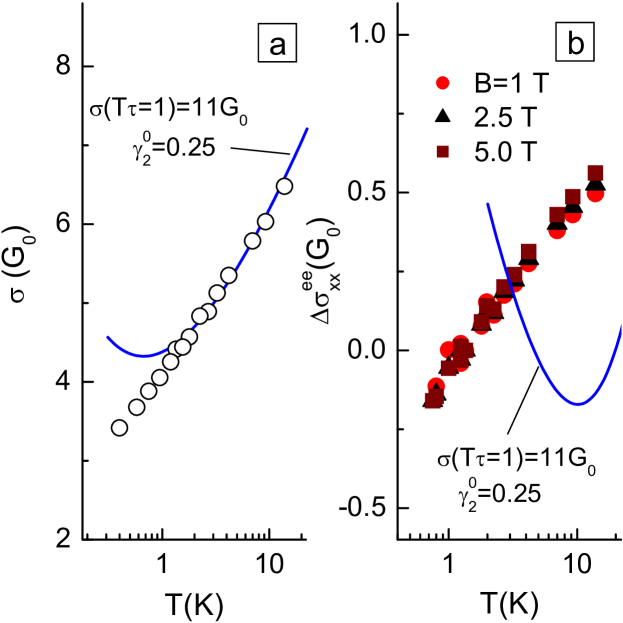
It is clear that the one-loop approximation of the RG theory is insufficient for so low conductivity, . It is pertinent to note here, that such decisive disagreement with the RG theory for the structure 4261 with the stronger disorder is observed at the higher conductivity (Fig. 6). As seen the experimental dependence of is close to the logarithmic one,fnt2 whereas the RG equations predict the upturn in the vs plot already at .
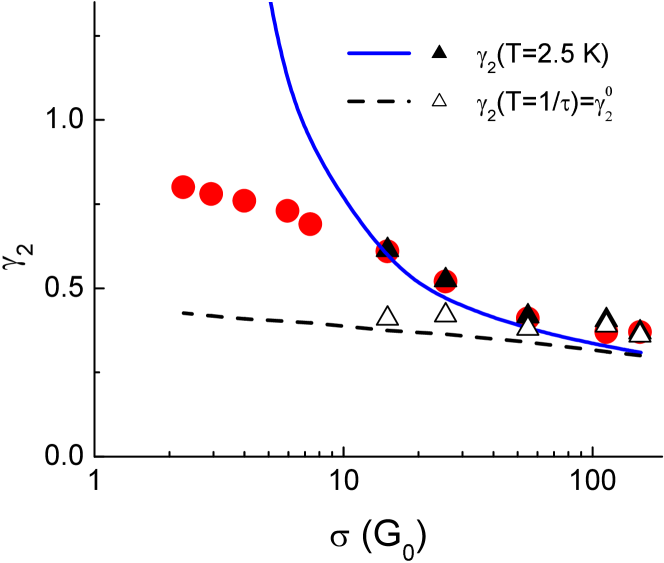
Let us analyze the results in the whole. In Fig. 7 we compare the low temperature values of the Fermi liquid amplitude obtained experimentally in wide range of the conductivity values, ,fnt1 with that predicted by the RG theory. The data obtained with the help of Eq. (1) from the slope of the experimental vs dependence within the temperature range from K to K are shown by circles. They agree well with the results obtained from the fit of the vs data by the RG equations, Eqs. (2) and (3) (shown by solid triangles). As shown above such the fit is possible only at the relatively high conductivity, . Note that the initial values of , , fall closely to the curve calculated from Eq.(4). One can see that increases monotonically when the conductivity goes down, and this increase is well described by the one-loop RG equations down to . At the lower conductivity, the theory predicts much steeper rise of than that obtained from the data treatment.
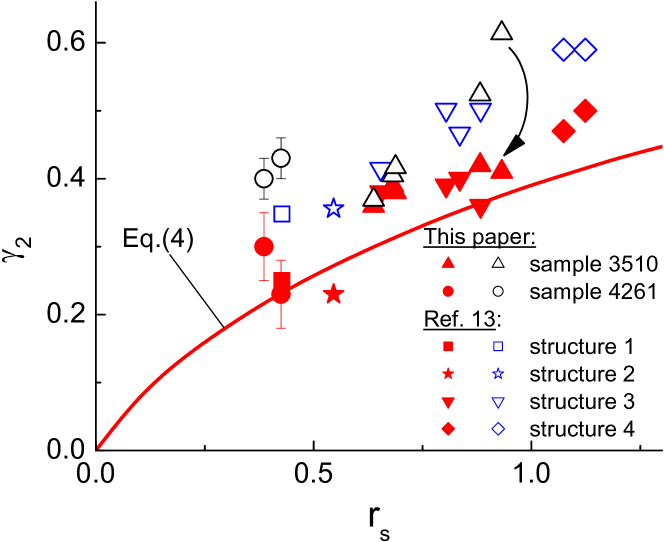
As mentioned in Sec. I the behavior of the e-e interaction contribution with decreasing conductance was studied in Ref. Minkov03, . It has been, in particular, found that the value of decreases with the decrease. We have retreated those data following the line of attack described above. The results for are presented in Fig. 8. In this figure, the open symbols are the low temperature value obtained from vs dependence. The value of corresponding to the best fit of the data by the RG equations are presented by solid symbols. It is seen that while the low temperature points lie noticeably above the theoretical curve, Eq. (4), the values fall very close to it for all the structures investigated both in Ref. Minkov03, and in this paper.
Thus, the RG equations well describe both the temperature dependence of the conductivity at and the temperature dependence of the interaction contribution at the relatively high conductivity, . The renormalization of the interaction constant at is large enough. For instance, the amplitude in the sample 3510 increases from at K up to at K. Such the increase corresponds to the reduction of by a factor of two: from at the higher temperature down to at the lower one. The renormalization of becomes stronger at further conductivity decrease. However, the experimental vs plot saturates when increases by about of two times in our conductivity range, whereas the RG theory predicts much stronger renormalization at (see Fig. 7). One of the possible reason of the disagreement between the theory and experiment at is the restriction of the one-loop approximation. Another possible reason is the interplay of the weak localization and interaction, which is not taken into account in the theory considered.
It would seem that the understanding is achieved: the RG theory adequately describes the data while the conductivity is rather high, .
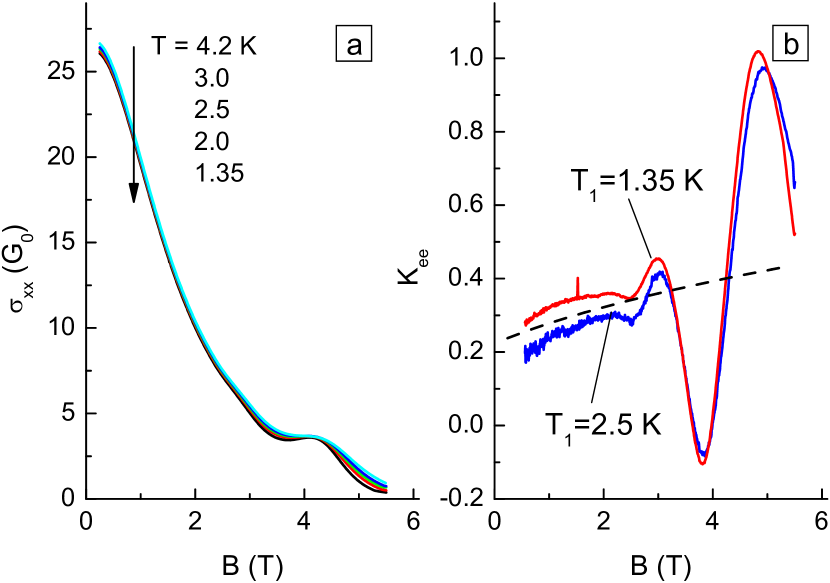
However, let us analyze the data in the presence of magnetic field in more detail. Eqs. (2) and (3) have to describe if the Zeeman splitting is relatively small, . In the case of , when the WL contribution is suppressed, the one unity in braces in Eq. (2) should be omitted. Because strongly decreases with increasing , , when , the strong change of the interaction contribution due to the renormalization of should be clearly evident also. As evident from Figs. 2(c), 3, 4(c), 5(c), and 6(b), the vs plots are practically independent of the magnetic field. This contradiction is more clearly illustrated by Fig. 9, where the results for structure 3510 at are presented. As seen from Fig. 9(a) decreases drastically: from at T down to at T. However, the quantity , which is according to Eq. (1), slightly increases against the background of the Shubnikov-de Haas (SdH) oscillations [Fig. 9(b)], instead of decreasing due to the renormalization of . It would be assumed that the decrease expected is compensated by the increase of caused by the suppression of two from three triplet channels due to the Zeeman effect.Cast1 ; Cast3 ; Fin84 ; Raim90 ; Minkov07 However, this effect becomes essential in strong magnetic fields, , which is not the case.
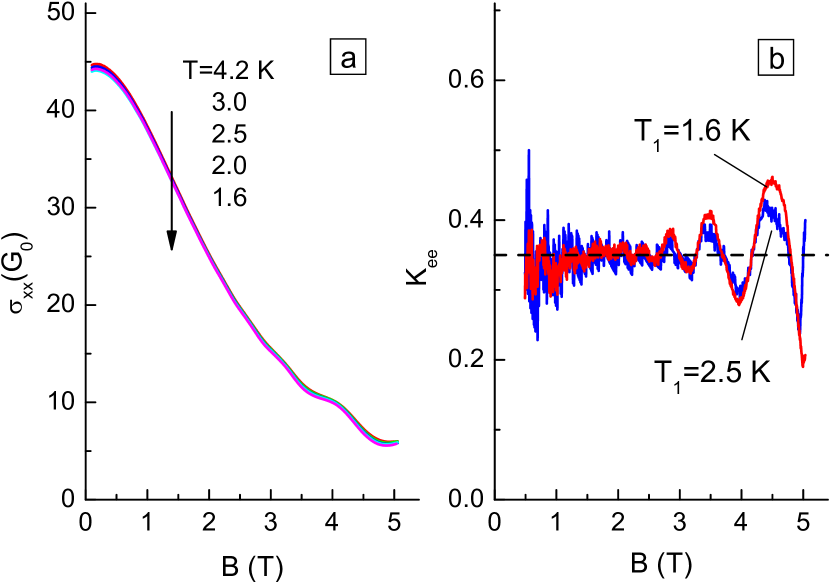
To assure that the e-e interaction contribution does not depend on the magnetic field in spite of strong decrease, we have performed analogous measurements on the structure with the very small value of g-factor. It is the Al0.3Ga0.7As/GaAs/Al0.3Ga0.7As structure with the quantum well width nm. The electron density in the structure is cm-2. The value of g-factor on the bottom of the conduction band for this structure is about .Pfeffer06 At the Fermi energy, meV, its value is still less due to nonparabolicity of the conduction band, it can be estimated as . The results are presented in Fig. 10. It is seen that even though changes from down to in our magnetic field range [Fig. 10(a)], there is no monotone change of the value [Fig. 10(b)]. Exhibiting the weak SdH oscillations it remains constant. It should be recorded that the value of changes drastically when the conductivity is lowered by means of the gate voltage: it falls from at down to at .
Thus, the interaction contribution to the conductivity at decreases when the conductivity controlled by the gate voltage goes down. This decrease is well described by the RG equations while . On the other hand, no decrease of the interaction contribution is evident when the conductivity decreases being controlled by the external magnetic field. In this case the contribution remains constant while is lowered by one order of magnitude. Such the behavior remains puzzling.
IV Conclusion
We have experimentally studied the evolution of the diffusion part of the e-e interaction correction to the conductivity of 2D electron gas in GaAs/In0.2Ga0.8As/GaAs single quantum well within the conductivity range from down to .
To separate out the interaction contribution to the conductivity we have used the unique property of the e-e interaction in the diffusion regime, namely, the fact that it contributes to the diagonal component of the conductivity tensor, , only. The simultaneous analysis of the weak localization magnetoresistance, the temperature dependence of at and at allows us to determine the conductivity dependence of the Landau’s Fermi liquid amplitude . The results have been interpreted within the framework of the RG theory. It has been obtained that the low temperature value of increases with conductivity lowering. The one-loop approximation of the RG theory adequately describes the data while the conductivity is higher than . At lower conductivity, drastic disagreement between theory and experiment is evident, suggesting the next-loop approximations in the RG theory are needed. Finally, it remains unclear why the renormalization of the Fermi liquid amplitude takes experimentally place when the conductivity decreases with the gate voltage, but do not when it decreases in the external magnetic field. More work is required to resolve this issue.
Acknowledgments
We would like to thank I. S. Burmistrov, I. V. Gornyi, and M. V. Sadovskii for illuminating discussions. This work was supported in part by the RFBR (Grant Nos. 07-02-00528, 08-02-00662, and 09-02-0789).
References
- (1) B. L. Altshuler and A. G. Aronov, in Electron-Electron Interaction in Disordered Systems, edited by A. L. Efros and M. Pollak, (North Holland, Amsterdam, 1985) p.1.
- (2) A. M. Finkelstein, Zh. Eksp. Teor. Fiz. 84, 168 (1983) [Sov. Phys. JETP 57, 97 (1983)]; Z. Phys. B 56, 189 (1984).
- (3) A. M. Finkel stein, Electron Liquid in Disordered Conductors, Vol. 14 of Soviet Scientific Reviews, edited by I. M. Khalatnikov (Harwood, London, 1990).
- (4) C. Castellani, C. Di Castro, P. A. Lee, and M. Ma, Phys. Rev. B 30, 527 (1984).
- (5) C. Castellani, C. Di Castro, P. A. Lee, M. Ma, S. Sorella, and E. Tabet, Phys. Rev. B 30, 1596 (1984).
- (6) C. Castellani, C. Di Castro, P. A. Lee, Phys. Rev. B 57, R9381 (1998).
- (7) Alexander Punnoose, Alexander M. Finkel’stein, Phys. Rev. Lett. 88, 016802 (2001).
- (8) Alexander Punnoose, Alexander M. Finkel’stein, Science 310, 289 (2005).
- (9) T. R. Kirkpatrick and D. Belitz, Phys. Rev. B 41, 11082 (1990).
- (10) D. A. Knyazev, O. E. Omel yanovskii, V. M. Pudalov, and I. S. Burmistrov, Pis’ma Zh. Eksp. Teor. Fiz. 84, 780 (2006) [JETP Lett. 84, 662 (2006)].
- (11) S. Anissimova, S. V. Kravchenko, A. Punnoose, A. M. Finkel’stein, and T. M. Klapwijk, Nat. Phys. 3, 707 (2007).
- (12) D. A. Knyazev, O. E. Omel’yanovskii, V. M. Pudalov, and I. S. Burmistrov, Phys. Rev. Lett. 100, 046405 (2008).
- (13) C. E. Yasin, T. L. Sobey, A. P. Micolich, W. R. Clarke, A. R. Hamilton, M. Y. Simmons, L. N. Pfeiffer, K. W. West, E. H. Linfeld, M. Pepper, and D. A. Ritchie, Phys. Rev. B 72, R241310 (2005).
- (14) G. M. Minkov, O. E. Rut, A. V. Germanenko, A. A. Sherstobitov, V. I. Shashkin, O. I. Khrykin, and B. N. Zvonkov, Phys. Rev. B 67, 205306 (2003).
- (15) G. M. Minkov, A. V. Germanenko, O. E. Rut, A. A. Sherstobitov, and B. N. Zvonkov, Phys. Rev. B 76, 165314 (2007).
- (16) Gabor Zala, B. N. Narozhny, and I. L. Aleiner, Phys. Rev. B 64, 214204 (2001).
- (17) G. M. Minkov, A. V. Germanenko, O. E. Rut, A. A. Sherstobitov, V. A. Larionova, A. K. Bakarov, and B. N. Zvonkov, Phys. Rev. B 74, 045314 (2006).
- (18) G. M. Minkov, A. V. Germanenko, O. E. Rut, A. A. Sherstobitov, and B. N. Zvonkov, Phys. Rev. B 75, 235316 (2007).
- (19) A. P. Dmitriev, V. Y. Kachorovskii, and I. V. Gornyi, Phys. Rev. B 56, 9910 (1997).
- (20) S. Hikami, A. I. Larkin, and Y. Nagaoka, Prog. Theor. Phys. 63, 707 (1980).
- (21) H.-P. Wittmann and A. Schmid, J. Low Temp. Phys. 69, 131 (1987)
- (22) I. L. Aleiner, B. L. Altshuler, and M. E. Gershenzon, Waves Random Media 9, 201 (1999).
- (23) G. M. Minkov, A. V. Germanenko and I. V. Gornyi, Phys. Rev. B 70, 245423 (2004).
- (24) By and large the structures 4261 and 3510 behave themselves analogously. Exception is that the slope of the vs dependence is somewhat different from that predicted theoretically, . This issue will be discussed elsewhere.
- (25) We have supposed that the change of the slope of vs and vs dependences results from the renormalization of the interaction constant only. It is not straightforward method for the determination of the interaction constant. More direct method is based on the suppression of the triplet channel in the magnetic field due to the Zeeman effect. This method is applied for the systems with the large enough g-factor. It was used for the 2D hole systemMinkov07 where . However, the holes are the carriers of four-fold degenerated band with the total moment . To the best of our knowledge, this method was not applied for the 2D electron systems with the simple, single-valley energy spectrum.
- (26) A. M. Finkelstein, Zh. Eksp. Teor. Fiz. 86, 367 (1984) [Sov. Phys. JETP 59, 212 (1984)].
- (27) R. Raimondi, C. Castellani, and C. Di Castro, Phys. Rev. B 42, 4724 (1990).
- (28) P. Pfeffer and W. Zawadzki, Phys. Rev. B 74, 233303 (2006).