A rotating molecular jet in Orion
We present CO(2-1), 13CO(2-1), CO(6-5), CO(7-6), and SO(65-54) line observations made with the IRAM 30 m and Atacama Pathfinder Experiment (APEX) radiotelescopes and the Submillimeter Array (SMA) toward the highly collimated (11∘) and extended ( 2′) southwest lobe of the bipolar outflow Ori-S6 located in the Orion South region. We report, for all these lines, the detection of velocity asymmetries about the flow axis, with velocity differences roughly on the order of 1 km s-1 over distances of about 5000 AU, 4 km s-1 over distances of about 2000 AU, and close to the source of between 7 and 11 km s-1 over smaller scales of about 1000 AU. The redshifted gas velocities are located to the southeast of the outflow’s axis, the blueshifted ones to the northwest. We interpret these velocity differences as a signature of rotation but also discuss some alternatives which we recognize as unlikely in view of the asymmetries’ large downstream continuation. In particular, any straightforward interpretation by an ambient velocity gradient does not seem viable. This rotation across the Ori-S6 outflow is observed out to (projected) distances beyond 2.5 104 AU from the flow’s presumed origin. Comparison of our large-scale (single dish) and small-scale (SMA) observations suggests the rotational velocity to decline not faster than 1/R with distance R from the axis; in the innermost few arcsecs an increase of rotational velocity with R is even indicated. The magnetic field lines threading the inner rotating CO shell may well be anchored in a disk of radius 50 AU; the field lines further out need a more extended rotating base. Our high angular resolution SMA observations also suggest this outflow to be energized by the compact millimeter radio source 139-409, a circumbinary flattened ring that is located in a small cluster of very young stars associated with the extended and bright source FIR4.
Key Words.:
stars: pre-main sequence – ISM: jets and outflows – ISM: individual: (Orion-S, OMC1-S, Orion South, M42) – ISM: Molecules – ISM: Binary stars – ISM: Circumbinary Disk – ISM: Radio lines1 Introduction
Protostellar jets have the essential task of removing angular momentum from the cores of pre-/protostellar clouds, in order for these to contract into new stellar objects. It is believed that T Tauri winds and protostellar jets are driven magnetocentrifugally from keplerian accretion disks close to the central stars (for a review see Königl & Pudritz (2000); Shu et al. (2000); Pudritz et al. (2007); Shang et al. (2007)). In these models the magnetic fields that are anchored in the accretion disk-star system are responsible for accelerating the jets’ material from the accretion disk. The material ejected from the disk therefore possesses angular momentum and, if not completely free to move away from the jet immediately, will thus show a toroidal velocity component, i.e. rotation about the jet axis.
In recent years a number of observations at optical wavelengths, using high spectral and angular resolution toward the launching zones of young jets from T Tauri stars, have attempted to identify velocity asymmetries that might be interpreted as signatures of jet rotation. These observations include Bacciotti et al. (2002), Coffey et al. (2004), Woitas et al. (2005), and Coffey et al. (2007) who detected systematic velocity shifts (of order 5 to 25 km s-1) across the jet’s axis within the first 100-200 AU from the star, toward six T Tauri stars, e. g. DG tau, RW Aur, CW Tau, and Th 28. Furthermore, observations at infrared wavelengths have also revealed such velocity jumps in the launching zones of the Herbig-Haro objects HH 26 and HH 72 (Chrysostomou et al. 2008). All these authors have interpreted the velocity shifts as a signature of jet rotation produced by a magneto centrifugal wind.
The first tentative evidence of such an outflow rotation was presented by Davis et al. (2000) at infrared wavelengths. They reported velocity shifts of a few km s-1 across the HH212 jet at distances of about 104 AU from the ejecting object using spectral line observations of the molecule H2.
At millimeter wavelengths there have likewise been attempts to find such signatures near the base of strong molecular outflows (HH 30: Pety et al. (2006); HH212: Codella et al. (2007), Lee et al. (2008); HH 211: Lee et al. (2007); CB 26: Launhardt et al. (2009)). However, only in the CB 26 and the HH212 outflows there seems to be evidence of rotation.
Recent studies, however, have proposed alternative explanations for observed velocity asymmetries in the jets. Soker (2005) remarked that the interaction of the jet with a twisted-tilted (warped) accretion disk can lead to the observed asymmetry in the jet’s line-of-sight velocity profile and thus the magneto centrifugal wind acceleration model is not required to explain such velocity jumps at the base of the optical and infrared jets. Cerqueira et al. (2006) proposed that a precessing jet whose ejection velocity changes periodically with a period equal to the precession period could also reproduce the line profiles of the jets.
In the following we address the issue of outflow rotation by combining new interferometer and single-dish observations of the Ori-S6 molecular outflow (Schmid-Burgk et al. 1990) which is located in the southernmost part of the very active high- and intermediate-mass star forming region Orion South. Single-dish observations suggested this outflow to originate near the millimeter sources CS3/FIR4 some 100′′ to the South of the BN/KL object. Unfortunately the immediate vicinity of CS3/FIR4 contains at least two more molecular outflows (Zapata et al. 2005, 2007), both almost perpendicular to Ori-S6, so that unique differentiation between the several emitting structures becomes possible for single telescopes only beyond some 20′′ from the presumed region of origin. Interferometry however has permitted Zapata et al. (2004a, b) to propose the source of this outflow to be the elongated radio object 134-411 (possibly a compact thermal jet) that is located close to the position of CS3/FIR4, the position angle of its major axis being consistent with that of the outflow.
The redshifted lobe of Ori-S6 is highly collimated (11∘), of relatively low radial velocities (up to 15 to 20 km s-1 relative to ambient) and extended over 2′ in a direction of P.A. around 210∘. That lobe is much better defined and stronger than its blueshifted counterpart because it is interacting directly with the molecular cloud, while the latter points in direction of the HII region and is likely destroyed by it. In the following we will deal with the redshifted lobe only.
Zapata et al. (2006) suggested that this outflow could be associated with a collimated SiO jet that they had detected in their SMA observations and that is emanating from the CS3/FIR4 region with almost the same orientation. On larger scales, Henney et al. (2007) discussed the possibility that the redshifted lobe of the Ori-S6 outflow is associated with a strong shock (”Southwest Shock”), some 400′′ downstream, that is observed at optical wavelengths and imaged in their Fig. 6.
CO position-velocity diagrams along the red lobe reveal a two-step structure over a distance of about 120′′ from the source region. Over the inner 60′′ there is a linear buildup of outflow velocities, from ambient (around 7 to 8 km s-1) to maximum values near 25 km s-1, which then terminates abruptly. At the same point the ambient velocities as seen in CO, which closer to CS3/FIR4 cover a rather wide range of between 7 and 9.5 km s-1, acquire an additional component, of around 10 km s-1, which further downstream becomes the dominant velocity. At this point a second, even faster linear buildup of radial velocity, again starting from ambient values, sets in which follows exactly the same direction as the first one. Quite likely the break in outflow velocity around the 60′′ point is related to the change in ambient conditions.
In the present study we will concentrate on the inner 60′′ section. Already early on Muders & Schmid-Burgk (1992) had noted this section, as seen in C18O(2-1), to be enveloped by a somewhat symmetrical cylindrical structure that seemed to undergo rotation about the outflow axis.
In this paper we present CO(2-1), 13CO(2-1), CO(6-5), CO(7-6), and SO(65-54) line observations made with both the IRAM 30 m and APEX telescopes as well as the Submillimeter Array toward the redshifted lobe of Ori-S6. We report the detection, at all three observatories, of velocity jumps across the flow axis and interpret these as a signature of rotation. We discuss some alternative suggestions to explain these velocity asymmetries. Finally, the SMA observations suggest the source of the extended collimated outflow to be the millimeter continuum source 139-409.
2 Observations
2.1 Submillimeter Array
2.1.1 SO(65-54)
Observations were made with the Submillimeter Array (SMA)111The Submillimeter Array is a joint project between the Smithsonian Astrophysical Observatory and the Academia Sinica Institute of Astronomy and Astrophysics, and is funded by the Smithsonian Institution and the Academia Sinica. during 2004 September 3. The SMA was in its extended configuration, which includes 21 independent baselines ranging in projected length from 16 to 180 m. The phase reference center of the observations was R.A. = 05h35m14s, decl.= -05∘24′00′′ (J2000.0). The size of the primary beam response at this frequency is 50′′. The receivers were tuned to a frequency of 230.534 GHz in the upper sideband (USB), while the lower sideband (LSB) was centered on 220.534 GHz.
The SO(65-54) transition was detected in the LSB at a frequency of 219.949 GHz. The full bandwidth of the SMA correlator is 4 GHz (2 GHz in each band). The SMA digital correlator was configured in 24 spectral windows (“chunk”) of 104 MHz each, with 32 channels distributed over each spectral window, providing a resolution of 3.25 MHz (4.29 km s-1) per channel.
The zenith opacity (), measured with the NRAO tipping radiometer located at the Caltech Submillimeter Observatory, was 0.09, indicating very good weather conditions during the experiment. Observations of Callisto provided the absolute scale for the flux density calibration. Phase and amplitude calibrators were the quasars 0423-013 and 3C 120, with measured flux densities of 2.30 0.06 and 0.50 0.03 Jy, respectively. The absolute flux density calibration uncertainty is estimated to be 20%, based on SMA monitoring of quasars. Further technical descriptions of the SMA and its calibration schemes can be found in Ho et al. (2004).
The data were calibrated using the IDL superset MIR, originally developed for the Owens Valley Radio Observatory (Scoville et al. 1993) and adapted for the SMA.222The MIR cookbook by C. Qi can be found at http://cfa-www.harvard.edu/cqi/mircook.html The calibrated data were imaged and analyzed in standard manner using the MIRIAD and AIPS packages. We used the ROBUST parameter set to 0 for an optimal compromise between sensitivity and angular resolution. The line image rms-noise was 20 mJy beam-1 for each channel at an angular resolution of with a P.A. = -73∘.

Observations were made during December 2007. The SMA was in its compact configuration, which includes 28 independent baselines ranging in projected length from 8 to 57 m. The receivers were tuned to a frequency of 230.534 GHz in the upper sideband (USB), while the lower sideband (LSB) was centered at 220.534 GHz. The observations were made in mosacing mode using the half-power point spacing between field centers and thus covering a total area of about 2′ 2′ in Orion South that contains the outflow reported by Schmid-Burgk et al. (1990).
The full bandwidth of the SMA correlator is 4 GHz. The SMA digital correlator was configured in 24 spectral windows of 104 MHz each, with 128 channels distributed over each spectral window, providing a resolution of 0.812 MHz (1.05 km s-1) per channel.
The zenith opacity (), was 0.1 – 0.3, indicating reasonable weather conditions. Observations of Uranus provided the absolute scale for the flux density calibration. Phase and amplitude calibrators were the quasars 0530+135 and 0541-056.
The line image rms-noise was 150 mJy beam-1 for each channel at an angular resolution of with a P.A. = -4.9∘.
2.1.2 12CO(2-1)
2.2 Single-dish Observations
2.2.1 IRAM 30m
Initial CO and 13CO(2-1) observations were performed in February 1991 at the IRAM 30m telescope, covering a 70′′ 80′′ area centered 10′′ north of the presumed source of the outflow. The beam size at 220 GHz was 13′′, the main beam efficiency 0.46. We used position switching with the reference fixed at 30′ west of the grid center and chose a velocity resolution of 0.14 km s-1. Observed points were 6′′ apart, and the observation time per point was 80 s.
These measurements were extended and complemented by 13CO(2-1) OTF observations on February 2 and 4, 2008, with a total observing time per night of 45 min. Now the center of the 100′′ 72′′ grid was placed 36′′ downstream from the presumed source and the grid rotated to align with the outflow. We co-added the OTF dumps every 6′′ along scans 6′′ apart. Velocity resolution was 0.05 km s-1. Both frequency switching (throw 15 MHz) and position switching were used.
2.2.2 APEX
Some preliminary CO(6-5) and (7-6) measurements were performed in October 2007 with the 12m Atacama Pathfinder Experiment (APEX) telescope located on Chajnantor in Chile. The same lines were simultaneously reobserved in depth on September 21 and 22, 2008 with the 2 7-element CHAMP+ array, covering a 120′′ 120′′ field around the origin of Ori-S6. Zenith opacity at 5100 m altitude was 0.35 at 690 GHz and 0.42 at 806 GHz. At 690 GHz the APEX beam is 9′′, at 806 GHz 7.5′′. Spectral resolution was chosen to be 0.73 MHz, corresponding to 0.32 resp. 0.27 km s-1 per channel, such that the 2048 channels per band resulted in a total velocity coverage of 650 resp. 550 km s-1 per band, sufficient to detect the highest-velocity bullets possibly present in this very active star-forming region Orion South.
The single-dish measurements were reduced with the standard CLASS software of the Gildas package333http://www.iram.fr/IRAMFR/GILDAS, with only first-order baselines subtracted from the data.
3 Results
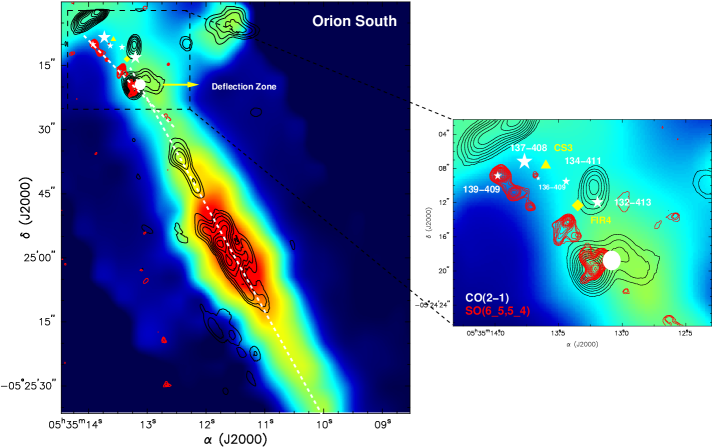
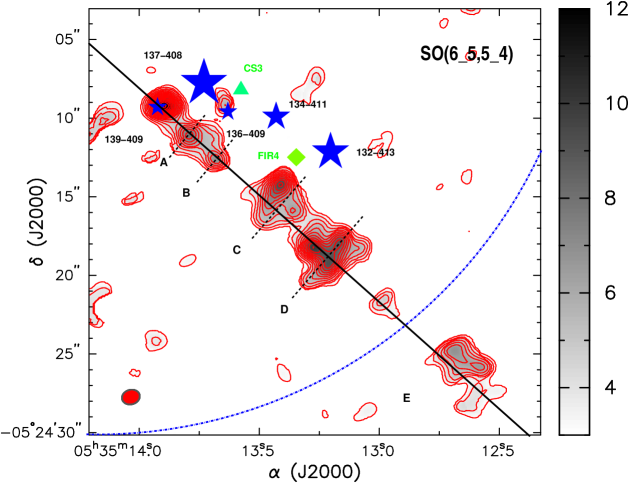
Fig. 1 shows a map of the high velocity CO(2-1) emission from the Ori-S6 redshifted lobe, i. e. intensity integrated from 12 to 23 km s-1, as obtained at the IRAM 30 m telescope (Schmid-Burgk et al. 1990), overlaid with both our SMA total moment-zero SO(65-54) and CO(2-1) maps. In this image one can see the SO emission to trace the inner, very collimated jet ejected along a P.A. of 45∘ from the source 139-409 that is located in a small cluster of young stars associated with the extended and bright source FIR4 (Zapata et al. 2006, 2007). The CO emission on the other hand delineates the more extended parts of the outflow, with its major axis bending, within a small distance from the source, towards a P.A. of some 30∘. The small difference between both position angles can be explained by the outflow undergoing a smooth deflection, possibly due to the high density ( 106 cm3) molecular cloud located behind the Orion Nebula as had already been suggested for other outflows populating this region (Zapata et al. 2006; Henney et al. 2007). A process for deflection of an outflow has been proposed and modeled by Cantó & Raga (1996). But there is also the possibility that we are seeing two outflows with different orientations, one traced by SO(65-54) on small scales, and the other one by CO(2-1) on large scales. However, we do not see any CO evidence of an outflow with P.A.= 45∘ extending from near the source FIR4. Moreover, coincidentally both components show the same velocity range of between 8 and 25 km s-1, indicating them to be part of the same outflow. Furthermore, the SO clump or bullet named D in Fig. 1 is well coincident with a bright clump of the CO outflow located in the deflection zone, thus linking directly the two components. Finally, Zapata et al. (2009, in prep.) found the continuation of the SO emission at the same position of the CO(2-1) shell, confirming thus that both molecular outflows are part of the same one.
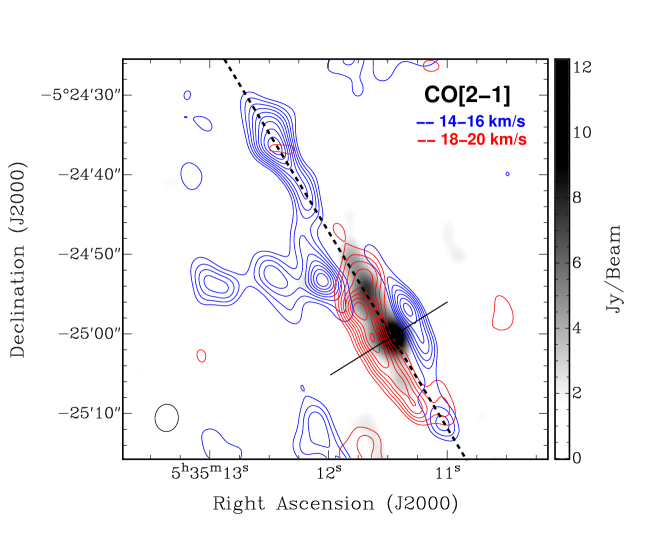
Fig. 2 presents an overlay of two CO(2-1) emission intervals of the south-western lobe of the Ori-S6 outflow made with the SMA, one integrated over the velocities from 14 to 16 km s-1 (blue), the other from 18 to 20 km s-1 (red). This shows clearly a velocity “jump” across the outflow, with the redshifted gas velocities located toward the South-east, the blueshifted ones toward the North-west. With a distance of 415 pc to the Orion Nebula (Menten et al. 2007), the separation between these two components is about 2 103 AU.
The position-velocity diagram of Fig. 3, taken along the black line across the outflow in Fig. 2, displays the decrease of radial velocity in the rotating shell with distance from the flow axis. It shows the velocity gradient on both sides not to be mirror-symmetric (the short white lines mark angles 30∘ to the vertical of the diagram). In fact the redshifted component appears to drop less steeply than its blueshifted counterpart. This would indicate the rotation velocity to increase with distance from the axis (solid rotation?), which might in principle be used to put lower limits on the magnetic and frictional forces active in the shell.
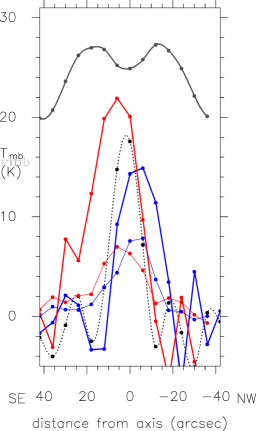
The single-dish observations of CO(2-1), (6-5), and (7-6) complement this SMA picture. Of course at the velocities of the ambient gas these lines are optically very thick; it therefore takes the rare isotopomeres to discern any near-ambient-velocity structure close to the outflow axis. 13CO(2-1) shows a clear and simple picture: over a distance of at least some 50′′ along the outflow two ranges of increased intensity run parallel to the outflow axis, one on either side, of constant and equal distance ( 15 ′′) from the axis, and of equal intensity if observed around vLSR = 7.7 km s-1. At lower velocities the ridge to the North-west begins to dominate, at higher values the south-eastern one. We thus suspect the ambient LSR velocity in the immediate vicinity of the outflow to be around 7.7 km s-1, with the two ridges marking the edges of a tubular wall that surrounds the flow axis. The depression between the ridges seems relatively stronger for the rarer isotopomere C18O, maybe indicating preferential destruction due to less self-shielding against the UV generated in the jet’s shock. A typical 13CO intensity cross section through the outflow is shown in Fig. 4 for vLSR = 7.7 km s-1, taken at downstream distance 45′′ from the bending point (marked by the white dot in Fig. 1). This point is from now on to serve as the zero-point for all single-dish distance determinations along the outflow because from here the outflow follows a straight line. Its coordinates are R.A. = 05h35m13.04s, decl.= -05∘24′20.0′′ (J2000.0).
At velocities a few km s-1 away from near-ambient values a structural asymmetry appears in the emission of both CO(2-1) and 13CO(2-1), see Fig. 4. Some 3 to 4 km s-1 below the 7.7 km s-1 value the intensity of both species is strongest along a strip situated between the ambient tubular wall and the outflow axis (as defined by the high-velocity cross-section profile) on the north-western side of the axis, at vLSR some 3 to 4 km s-1 above this value the emission peaks along a corresponding strip on the south-eastern side. These two zones are spatially separated by 10′′ to 15′′ and by 7 km s-1 in radial velocity, and this asymmetry extends downstream to projected distances of at least 2.5 104 AU from the source. The sense of the asymmetry corresponds to our SMA results, but the velocities in question have a different context: The SMA variations are a superposition of an asymmetry of a few km s-1 onto the high-velocity components of the outflow, the single-dish data concern motions outside the core flow zone.
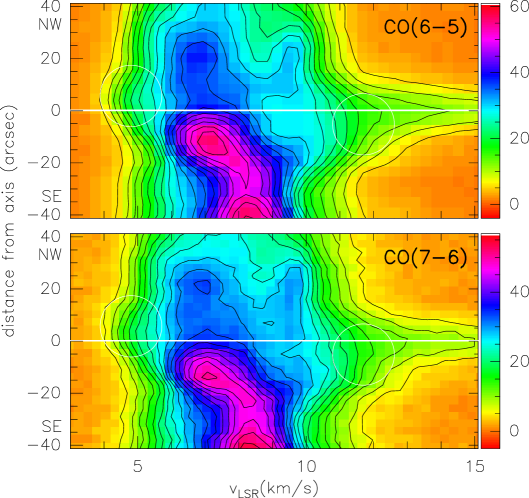
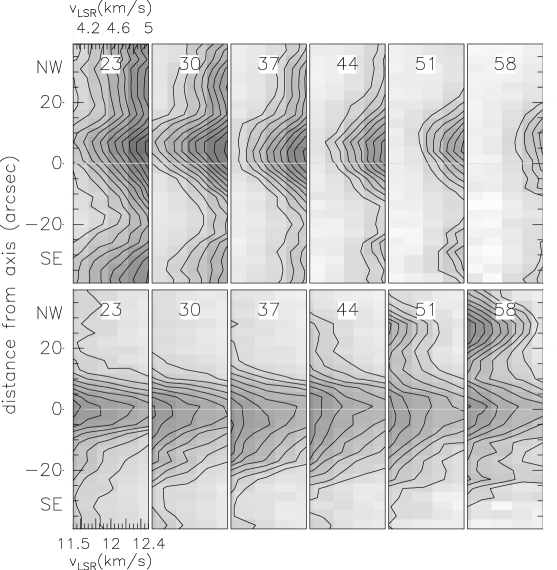
Typical p-v diagrams taken perpendicularly across the outflow at distance 37′′ from point O, as obtained with the somewhat higher resolutions of the APEX measurements than that of IRAM CO(2-1), are shown in Fig. 5. No important long-range gradient of the ambient velocities is evident, and in particular there appears no obvious tilt across the outflow axis (the horizontal white line). However, in both diagrams one notes conspicuous excursions of the iso-intensity lines, somewhat anti-symmetrically offset from the outflow’s axis, at velocities slightly beyond the optically thick vLSR values, i.e. below 5 resp. above 11 km s-1 (big white circles). These might seem spurious; but when observing at different downstream positions one notes their appearance in each p-v crosscut between 20′′ and 60′′ from point O (see Fig. 6), contrary to some other local excursions also visible in Fig. 5 which do not persist across this range. Fig. 6 does show noticeable differences between the high- and the low-velocity diagrams. But complete antisymmetry between the encircled regions of Fig. 5 cannot be expected because the outflow proper will have different effects on the two velocity windows, contaminating the redshifted rotation component. This component seems to extend further from the axis, and it may consist of two somewhat distinct parts, one at the axial distance of the blueshifted component (about 5′′), the other one further away (see panel 37 of Fig. 6). Higher resolution studies and better knowledge of the central outflow’s contribution are needed to decide this issue.
In the two transition regions between the typical excursion and the ambient velocities, i.e. at around 6 resp. 10.5 km s-1, there are hints in Fig. 5 (as well as at other downstream distances) of emission deficits at about the same offsets from the axis as those where the excursion emission peaks (Isointensity lines change from convex to concave along the vLSR axis). This seems to indicate in situ acceleration in opposite directions on either side of the outflow, rather than a mere ambient velocity gradient to be at the root of the observed velocity antisymmetry.
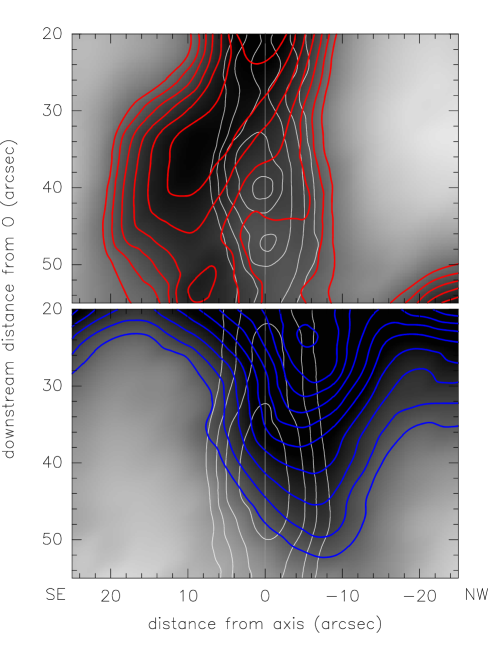
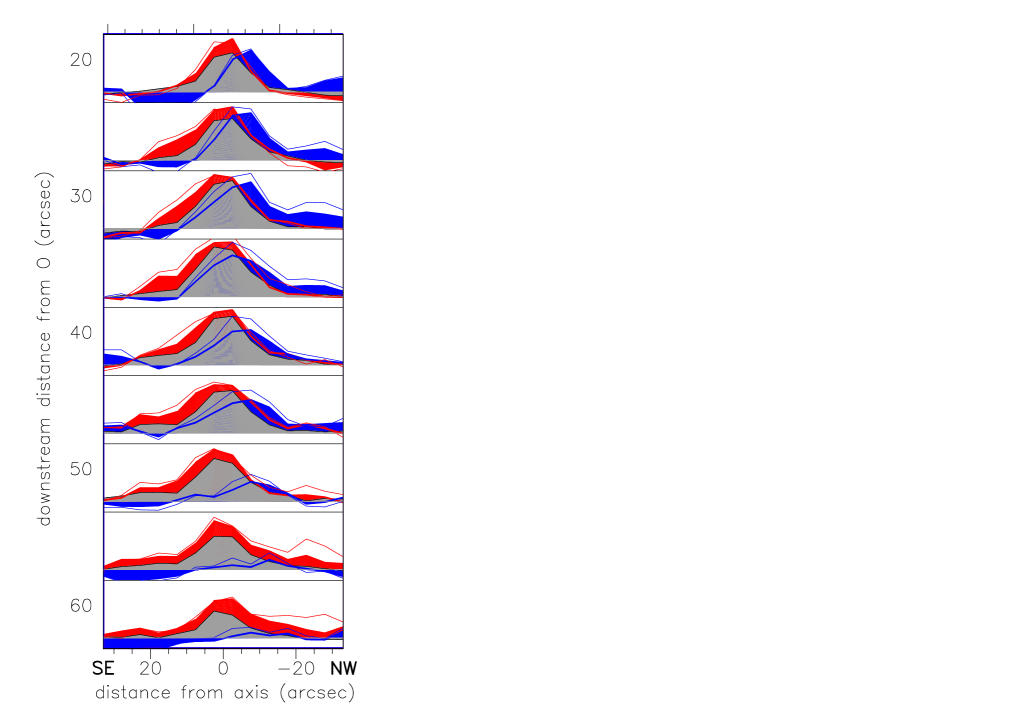
Spatial intensity profiles across the flow (Fig. 7), taken for the two velocity excursions in question at various downstream distances from point O, clearly show a persistent “red-blue” asymmetry about the axis that is defined by the high-velocity crosscut here depicted in grey. Mapping the two “excursion channels” of 3.5 to 5.0 km s-1 resp. 11.25 to 12.75 km s-1 results in the spatial distributions of Fig. 8 which represent the considerable velocity difference of some 6 to 8 km s-1 over a distance of around 10-15′′ or 4-6 103 AU. Of course this variation does not signal an actual velocity difference of 6 km s-1 or so between the two sides, the bulk of the line profiles being hidden by large optical depth such that only their extreme wings can be seen. The fact that either side shows predominantly just one of the two wings, the “red” or the “blue” one, indicates however that the true radial velocity shift across the flow must be roughly of order at least 0.5 km s-1, corresponding to 20 km s-1 per pc; were it much smaller, then one would measure about the same wing emission on either side. This in turn indicates that the rotation velocity between the inner SMA region and the annular zone of axial distance R = 10′′ to 15′′ does not decrease much faster than 1/R.
Note that in order to somewhat correct Fig. 8 for the contribution from the outflow proper to the redshifted intensities we have rather cursorily subtracted part of the outflow’s higher velocities (between 14 and 18 km s-1) from the data.
In Fig. 9 we show the SO(65-54) redshifted emission of the innermost part of the Ori-S6 outflow as mapped with the SMA. The emission is here integrated over velocities between 8 and 25 km s-1. Our SO observations only detect the innermost part of the outflow because of the small primary beam size response of the SMA and because the beam was centered to the north of the millimeter source 139-409. In Fig. 9, we also mark the primary beam of the SMA. The molecular emission is well resolved and shows a collimated jet with clumpy morphology that is being ejected from that source. The resolved spatial size of each molecular gas bullet or clump is about 1000 to 2000 AU.
| Peak | Half Maximum | LSR Radial | |
|---|---|---|---|
| Flux | Velocity Width | Velocity | |
| Bullet | [Jy Beam-1] | [km s-1] | [km s |
| A | 0.180.02 | 11.02.0 | 9.60.7 |
| B | 0.280.02 | 10.01.0 | 12.40.4 |
| C | 0.560.02 | 7.60.4 | 12.10.2 |
| D | 0.340.02 | 10.50.9 | 15.00.4 |
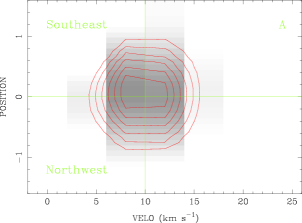
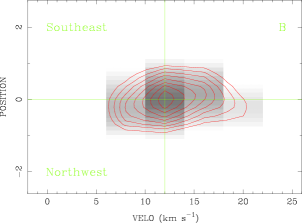
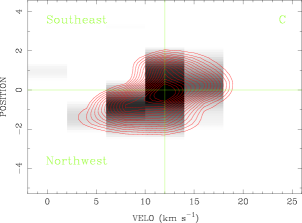
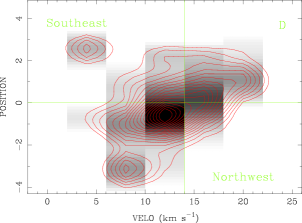
Position-velocity diagrams along directions perpendicular to the SO jet (i. e. along P.A. 135∘) are presented in Fig. 10 for four molecular gas bullets (A, B, C and D, see Fig. 9). The bullet named E, seems to not be real because it falls far outside the primary beam response of the SMA. Three of these bullets (B, C and D) again show velocity jumps across the symmetry axis, of the same sense as those observed on large scales ( IRAM 30m, APEX, and SMA) but with larger velocity excursions (7 to 11 km s-1) over scales of 1000 AU, see Table 1 where we give the parameters of the Gaussian least square fits to the profiles. The kinematics of the molecular gas in the bullets seems consistent with a rigid body law where the velocity is proportional to the distance from the rotation axis. This feature seems least evident in the innermost bullets, perhaps because of our poor spectral resolution (4 km s-1) as well as their very compact size of around one SMA beam ( 1′′). Note that the molecular bullets appear to increase their radial velocities with distance from the ejecting object (Table 1). A similar increase had already, on the much larger 30m scale, been discovered out to 70′′ from the source in the CO flow (Schmid-Burgk et al. 1990).
Zapata et al. (2007) reported the millimeter source 139-409 to be a circumbinary molecular ring, of size a few hundred astronomical units ( AU), that is produced by two intermediate-mass stars with very compact circumstellar disks of sizes and separations less than 50 AU. The circumbinary disk is seen almost edge-on with . The redshifted molecular gas is located toward the west, the blueshifted one toward the east. Note that the sense of rotation of the molecular material in this circumbinary disk is opposite to that found in the jet.
4 Discussion
Three independent observations all show velocity asymmetries about the outflow axis that suggest rotation on different length scales. Seen along the redshifted lobe down from the origin this rotation would be clockwise for the SO clumps, the CO jet shell, and the ambient envelope alike.
Although this congruence of velocity shifts on three different length scales lends some credence to a rotation model for Ori-S6 we have to discuss alternative explanations for the observed red-blue asymmetries. The most obvious alternative would be a general large-scale velocity gradient in the region. Indeed, as the p-v diagram of Fig. 5 shows, there is some overall velocity change in the brightest component, from higher to lower velocities along a direction roughly SE to NW. Between the edges of this diagram, i.e. over a distance of 80′′, peak vLSR is seen to change by about 1 km s-1. Were this a smooth gradient, it would amount to 5 km s-1 per pc, a value high but not uncommon for molecular cloud clumps. Over the 5′′ resp. 10′′ distances between the two sides of the CO jet shell (Fig. 2) resp. the “ambient” CO tube (Fig. 4) this would however amount to velocity asymmetries below 0.1 km s-1, much less than what is observed. In fact, over these distances the brightest component does not seem to vary at all in velocity; only beyond, and then only in the SE part of the diagram over the very limited extent of some 10′′, a much larger gradient appears, of order 60 km s-1 per parsec. This huge gradient connects suspiciously to the velocity dominant still further away from the flow. One could postulate such a large, spatially very limited velocity gradient that by chance coincides with the outflow positions. But that gradient would have to be matched closely with the flow for these asymmetries to be evident over length scales of order 60′′. This seems unlikely. Also, the convex-concave transitions mentioned above appear to favor in situ acceleration over any effects of an ambient velocity gradient. We thus discard the notion of the asymmetries being caused by such a gradient in the ambient gas.
Since the outflow originates in a binary system (Zapata et al. 2007) a recent calculation (Murphy et al. 2008) of two nearly parallel jets of unequal speed stemming from such a system may be of relevance for Ori-S6. In that model the two jets eventually merge, as witnessed by a persistent kink in the final structure. Furthermore, due to binarity precession begins to show after some time in the form of a bending jet trajectory. Although neither of these effects can as yet be definitely excluded for our inner jet, SMA data of the large-distance CO structure clearly speaks against any sizeable precession or kink. Nor would it seem likely that the two flow velocities should not over their large common path gradually adjust to each other and thus wipe out any initial differences in speed. We therefore look for other explanations for the observed velocity jumps across the flow axis.
Soker’s (2005) alternative proposal, that left-right asymmetries in jets could result from (non-magnetic) interaction at the base between jet and a warped disk, would, on the other hand, in our case at the very least require a warp spatially static over the long times that it takes to build up the outflow out to 100′′ from the source: 0.2 pc / 15 km s-1 is of order 13,000 years, so even accounting for possibly reducing projection factors a very large period of standstill would be demanded of the close binary system at the source of Ori-S6. Hence we also discard Soker’s mechanism and relate the observed jumps to rotation instead.
Where would this rotation originate? The CO jet shown in Fig. 2 is considered ejected from a rotating protostellar disk and then accelerated and collimated by MHD forces. Anderson et al. (2003) provide a formula that allows to relate jet properties measured at large distances from the disk to the position (the “footpoint”) on the disk from where the observed jet section first emerges:
| (1) |
Here is the observed radial distance of the jet shell from the flow axis, the radius on the disk from where that shell’s material leaves, vϕ,∞ and vp,∞ are the toroidal and poloidal velocities observed for the shell at , and the mass of the (proto)star at the center of the disk. In our case we assume from observation 2.5′′=1000 AU, vϕ,∞ 2 km s-1, vp,∞ 10/sin km s-1 and 2 to 5 M⊙, with the unknown angle between flow direction and plane of the sky. This results in a footpoint radius of 140/sin AU for the jet component shown in Fig. 2. Since the apparent poloidal flow velocity of 10 km s-1 relative to ambient is relatively low for molecular jets it seems likely that is small. For 30 ∘ the footpoint radius would drop to below 56 AU, a value that fits the above-mentioned disk dimensions of the binary components very well. Furthermore, similar values for the footpoint radius are found for the SO(65-54) molecular jet.
A similar estimate for the CO envelope of nearly ambient velocity, shown in cross-section in Fig. 5, must await more detailed investigations since its apparent vp,∞ value is (very) small and not determined; likewise vϕ,∞ can be estimated only very roughly, as explained above – the asymmetric wings say little quantitatively about the bulk toroidal motions of the envelope. A trial with 5′′, vϕ,∞ 0.4 km s-1, and vp,∞ 1 km s-1 would result in footpoint radii about a factor 10 larger than the CO jets shell’s, suggesting an origin quite different from that of the jet’s disk.
Anderson et al. (2003) also provide an expression for the ratio between toroidal and poloidal components of the magnetic field strength at the observed jet positions (see their eq. 2). Using the same parameter values as employed for estimating the jet shell’s footpoint radius and setting to 30∘ we arrive at a field strength ratio (toroidal over poloidal) of around 6. The magnetic field in the shell thus seems to be tightly wound up, thereby keeping the shell material well collimated by its hoop stresses.
Where in the system 139-409 the jet actually originates has yet to be determined. The sense of rotation of the circumbinary ring is nearly opposite to that of jet and outflow, and the jet leaves the system under an angle of 45∘ with the ring plane. One should therefore expect the origin of the flow to be at the circumstellar disk of one of the binary components. The two disks need not align with the ring. Further deep observations of highest resolution will be required to clarify the jet-disk connection.
5 Summary
The Ori-S6 outflow presents a promising laboratory for future studies of magneto-centrifugal models of jet acceleration. We have observed the compact jet and its larger-scale molecular envelope on three different spatial scales and found the following:
-
The SO bullets in the jet, its CO shell, as well as the more distant CO envelope all show rotation about the outflow axis; the sense of rotation is the same for all;
-
The inner jet is composed of individual bullets that appear to follow a solid body rotation law with peak values around 5 km s-1. The CO shell, at a distance of about 1000 AU from the axis, rotates at 2 km s-1; the CO envelope, at a distance of 2000 AU from the axis, i.e. several times the bullets’ radii, rotates at 0.5 km s-1;
-
The rotation is observed out to at least 25,000 AU downstream from the source;
-
The magnetic field lines embedded in the jet’s CO shell can well thread a protostellar disk of radius 50 AU. For the wider CO envelope the footpoint in the equatorial plane of the disk must lie considerably further out;
-
The exact identification of the outflow source remains open since at the obvious position there is a circumbinary ring containing two intermediate mass stars. Orientation and sense of rotation of the ring do not coincide with those of the outflow.
All these topics are amenable to more extended observations that aim at problems of star formation, such as angular momentum budgets and high-velocity mass ejection.
Acknowledgements.
We would like to thank Dr. Bernd Klein for having taken the recent CO data on the 30m telescope, and Dr. Rainer Mauersberger for reactivating the IRAM data of 1989. Facilities: IRAM 30m APEX and SMAReferences
- Anderson et al. (2003) Anderson, J. M., Li, Z.-Y., Krasnopolsky, R., & Blandford, R. D. 2003, ApJ, 590, L107
- Bacciotti et al. (2002) Bacciotti, F., Ray, T. P., Mundt, R., Eislöffel, J., & Solf, J. 2002, ApJ, 576, 222
- Cerqueira et al. (2006) Cerqueira, A. H., Velázquez, P. F., Raga, A. C., Vasconcelos, M. J., & de Colle, F. 2006, A&A, 448, 231
- Chrysostomou et al. (2008) Chrysostomou, A., Bacciotti, F., Nisni, B., et al. 2008, ArXiv e-prints, 802
- Codella et al. (2007) Codella, C., Cabrit, S., Gueth, F., et al. 2007, A&A, 462, L53
- Coffey et al. (2007) Coffey, D., Bacciotti, F., Ray, T. P., Eislöffel, J., & Woitas, J. 2007, ApJ, 663, 350
- Coffey et al. (2004) Coffey, D., Bacciotti, F., Woitas, J., Ray, T. P., & Eislöffel, J. 2004, ApJ, 604, 758
- Davis et al. (2000) Davis, C. J., Berndsen, A., Smith, M. D., Chrysostomou, A., & Hobson, J. 2000, MNRAS, 314, 241
- Henney et al. (2007) Henney, W. J., O’Dell, C. R., Zapata, L. A., et al. 2007, AJ, 133, 2192
- Ho et al. (2004) Ho, P. T. P., Moran, J. M., & Lo, K. Y. 2004, ApJ, 616, L1
- Königl & Pudritz (2000) Königl, A. & Pudritz, R. E. 2000, Protostars and Planets IV, 759
- Launhardt et al. (2009) Launhardt, R., Pavlyuchenkov, Y., Gueth, F., et al. 2009, A&A, 494, 147
- Lee et al. (2008) Lee, C.-F., Ho, P. T. P., Bourke, T. L., et al. 2008, ApJ, 685, 1026
- Menten et al. (2007) Menten, K. M., Reid, M. J., Forbrich, J., & Brunthaler, A. 2007, A&A, 474, 515
- Mezger et al. (1990) Mezger, P. G., Zylka, R., & Wink, J. E. 1990, A&A, 228, 95
- Muders & Schmid-Burgk (1992) Muders, D. & Schmid-Burgk, J. 1992, in Astronomische Gesellschaft Abstract Series, 45–45
- Mundy et al. (1986) Mundy, L. G., Scoville, N. Z., Baath, L. B., Masson, C. R., & Woody, D. P. 1986, ApJ, 304, L51
- Murphy et al. (2008) Murphy, G. C., Lery, T., O’Sullivan, S., et al. 2008, A&A, 478, 453
- Pety et al. (2006) Pety, J., Gueth, F., Guilloteau, S., & Dutrey, A. 2006, A&A, 458, 841
- Pudritz et al. (2007) Pudritz, R. E., Ouyed, R., Fendt, C., & Brandenburg, A. 2007, in Protostars and Planets V, ed. B. Reipurth, D. Jewitt, & K. Keil, 277–294
- Schmid-Burgk et al. (1990) Schmid-Burgk, J., Guesten, R., Mauersberger, R., Schulz, A., & Wilson, T. L. 1990, ApJ, 362, L25
- Scoville et al. (1993) Scoville, N. Z., Carlstrom, J. E., Chandler, C. J., et al. 1993, PASP, 105, 1482
- Shang et al. (2007) Shang, H., Li, Z.-Y., & Hirano, N. 2007, in Protostars and Planets V, ed. B. Reipurth, D. Jewitt, & K. Keil, 261–276
- Shu et al. (2000) Shu, F. H., Najita, J. R., Shang, H., & Li, Z.-Y. 2000, Protostars and Planets IV, 789
- Soker (2005) Soker, N. 2005, A&A, 435, 125
- Woitas et al. (2005) Woitas, J., Bacciotti, F., Ray, T. P., et al. 2005, A&A, 432, 149
- Zapata et al. (2006) Zapata, L. A., Ho, P. T. P., Rodríguez, L. F., et al. 2006, ApJ, 653, 398
- Zapata et al. (2007) Zapata, L. A., Ho, P. T. P., Rodríguez, L. F., et al. 2007, A&A, 471, L59
- Zapata et al. (2005) Zapata, L. A., Rodríguez, L. F., Ho, P. T. P., et al. 2005, ApJ, 630, L85
- Zapata et al. (2004a) Zapata, L. A., Rodríguez, L. F., Kurtz, S. E., & O’Dell, C. R. 2004a, AJ, 127, 2252
- Zapata et al. (2004b) Zapata, L. A., Rodríguez, L. F., Kurtz, S. E., O’Dell, C. R., & Ho, P. T. P. 2004b, ApJ, 610, L121