A Photoionized Nebula Surrounding and Variable Optical Continuum Emission from the Ultraluminous X-Ray Source in NGC 5408
Abstract
We obtained optical spectra of the counterpart of the ultraluminous X-ray source NGC 5408 X-1 using the FORS spectrograph on the VLT. The spectra show strong high excitation emission lines, Heii 4686 and [NeV] 3426, indicative of X-ray photoionization. Using the measured X-ray spectrum as input to a photoionization model, we calculated the relation between the Heii and X-ray luminosities and found that the Heii flux implies a lower bound on the X-ray luminosity of . The [Nev] flux requires a similar X-ray luminosity. After subtraction of the nebular emission, the continuum appears to have a power-law form with a spectral slope of . This is similar to low-mass X-ray binaries where the optical spectra are dominated by reprocessing of X-rays in the outer accretion disk. In one observation, the continuum, Heii 4686, and [NeV] 3426 fluxes are about 30% lower than in the other five observations. This implies that part of the line emission originates within one light-day of the compact object. Fitting the optical continuum emission and archival X-ray data to an irradiated disk model, we find that of the total bolometric luminosity is thermalized in the outer accretion disk. This is consistent with values found for stellar-mass X-ray binaries and larger than expected in models of super-Eddington accretion flows. We find no evidence for absorption lines that would permit measurement of the radial velocity of the companion star.
Subject headings:
black hole physics – galaxies: individual: NGC 5408 galaxies: stellar content – X-rays: galaxies – X-rays: black holes1. Introduction
“Ultraluminous X-ray sources” (ULXs) are variable X-ray sources in external galaxies with luminosities (if the emission is isotropic) greatly exceeding those of Galactic X-ray binaries. The irregular variability, observed on time scales from tenths of seconds to years, suggests that ULXs are binary systems containing a compact object. The compact objects in these binaries are either stellar-mass black holes in an unusual state with very high accretion rates or intermediate-mass black holes. It is of significant interest to determine the nature of the compact objects in ULXs.
Beyond the luminosities, there are two lines of X-ray evidence suggesting that ULXs harbor intermediate mass black holes: X-ray spectral evidence for accretion disks cooler than those in stellar-mass black hole X-ray binaries (Kaaret et al., 2003) and quasiperiodic oscillations (QPOs) at lower frequencies than found in stellar-mass black hole X-ray binaries at similar luminosities (Strohmayer & Mushotzky, 2003). Feng & Kaaret (2007a) recently found that the putative cool disk in one ULX, NGC 1313 X-2, does not follow the relation that the luminosity is proportional to temperature to the fourth power, , as expected for accretion disk emission, ruling out this interpretation for that source. This finding casts doubt on the X-ray spectral evidence at least for that source. In contrast, the X-ray timing evidence appears robust with the QPO frequencies following the relations found in X-ray binaries (Feng & Kaaret, 2007b). QPOs have been definitively detected from only two ULXs: one in M82 and NGC 5408 X-1 (Strohmayer & Mushotzky, 2003; Strohmayer et al., 2007). Further, NGC 5408 X-1 is surrounded by a powerful radio nebula (Lang et al., 2007) which requires an extremely energetic outflow from the compact object. NGC 5408 X-1 is one of the best intermediate mass black hole candidates amongst the ULXs.
Optical spectroscopy of ULXs provides, perhaps, the best means to better understand the nature of the ULXs. Indeed, the most definitive constraint on the compact object mass would come from optical measurement of the mass function of the companion star. The ULX in M82 may lie in a superstar cluster and, in any event, lies in too crowded and obscured a region to permit extraction of an optical spectrum of the ULX binary (Kaaret et al., 2001, 2004a). In contrast, NGC 5408 X-1 lies in a relatively uncrowded region and is only weakly obscured. We recently identified the optical counterpart to NGC 5408 X-1 (Lang et al., 2007). Thus, NGC 5408 X-1 is the best intermediate mass black hole candidate ULX for which optical spectroscopy of the binary system can be performed.
Optical emission can arise from a companion star, an accretion disk surrounding the compact object, or a surrounding nebula. If the light arises from the companion star, then one would expect continuum emission and, for most spectral types, a series of absorption lines. Measurement of the continuum shape would help constrain the spectral type of the companion star. Detection of spectral lines from the companion star would enable us to determine the star’s spectral type, thereby constraining the evolutionary history of the binary. Repeated observations would enable measurement of the mass function and a lower bound on the compact object mass.
If the optical emission arises from the accretion disk, then we would expect to see a blue or hot continuum and emission lines. High-excitation lines, particularly Heii, would give direct information about the nature of the accretion flow and the incident X-ray flux. These lines can provide information about the nature of the binary system and an estimate of the true X-ray luminosity. In addition, since the accretion disk moves with the compact object, the emission line radial velocity represents the radial velocity of the compact object and thus provides a means to constrain the mass of the compact object. This technique was demonstrated by Hutchings et al. (1987) for the persistent black hole candidate LMC X-1.
If the optical light arises from a surrounding nebula then the nebula could be either shock-powered, in which case low excitation lines would be expected, or X-ray photoionized, in which case high excitation lines would be expected. Forbidden lines can produced in a photoionized nebula but not in the high densities of an accretion disk. Nebulae may also produce continuum emission.
We obtained several observations of NGC 5408 X-1 using the FORS instrument on the VLT and analyzed archival X-ray data from XMM-Newton. The observations and data reduction are described in §2. The results are described in §3 and discussed in §4.
| Observation | Start | Duration | Air mass |
|---|---|---|---|
| OB1 | 2008-04-08 04:59:04 | 3850 s | 1.050 |
| OB2 | 2008-04-08 05:46:04 | 3850 s | 1.049 |
| OB3 | 2008-04-08 06:45:13 | 3850 s | 1.095 |
| OB4 | 2008-04-09 05:46:17 | 3850 s | 1.051 |
| OB5 | 2008-04-10 05:08:33 | 3850 s | 1.046 |
| OB6 | 2008-04-10 05:54:29 | 3850 s | 1.056 |
Note. — The table lists VLT/FORS observations of NGC 5408 and includes the date and UT time of the start of the observation, the number of integrations and the duration of each integration, and the average airmass during each observation.
2. Observations and Analysis
2.1. Optical
The Very Large Telescope (VLT) was used for the observations because of the dimness of the optical counterpart of NGC 5408 X-1, , and the need to obtain moderately high resolution spectra. NGC 5408 X-1 transits nearly overhead at Cerro Paranal. We chose to use the FOcal Reducer and Spectrograph 1 (Appenzeller et al., 1998, FORS1) which has a blue sensitive CCD because we are primarily interested in lines that would be produced in a photoionized nebula or accretion disk and many of the important lines for such systems are in the blue range. FORS1 is mounted on the VLT unit telescope 2 (UT2). We used the GRIS_600B grism which covers a wavelength range of 3350 Å to 6330 Å with a dispersion of 0.75 Å/pixel and a spectral resolution of at the central wavelength. We used a slit and 22 binning of the pixels with high gain readout and standard resolution.
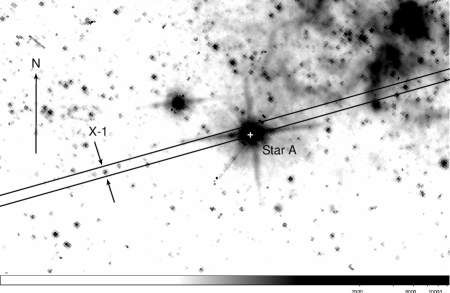
The spectrograph slit was oriented so that the closest neighbors of the ULX counterpart are best separated along the slit. The slit also covered a bright star, ‘star A’, that appears in the 2MASS catalog (Skrutskie et al., 2006) at a position of , (J2000). Since the ULX optical counterpart is quite dim, star A was used for acquisition. We checked the slit position by correcting the astrometry of the FORS acquisition image using the stars in the 2MASS catalog. Fig. 1 shows an HST image of the field (Kaaret et al., 2004b) with the reconstructed slit position superimposed. The optical counterpart of NGC 5408 X-1 identified in Lang et al. (2007) appears to be well placed in the slit.
Multiple observations of NGC 5408 X-1 were obtained over three successive nights, see Table 1. The data reduction was performed using the Image Reduction and Analysis Facility (IRAF) (Tody, 1993). Starting with the raw data, we created bias and lamp flat-field images using exposures obtained on the 3 nights of observations. These corrections were applied to the spectrum images. Each observation block (OB) consisted of three integrations of 850 s each with an offset of 12 pixels along the spatial axis between successive integrations. We analyzed the data by combining the 3 two-dimensional spectra in each observation block in order to remove bad pixels and cosmic ray hits. We used the xregister task in IRAF to caculate the offsets needed to align the images and then the imcombine task to average the images, applying the ccdclip method to remove cosmic rays and bad pixels. We also combined the entire set of 18 spectra into one using the same procedure.
The dimness of the continuum emission from the optical counterpart of the ULX made finding a trace of the spectrum unreliable. Instead, we first traced the spectrum of star A and then used that as a reference for the trace of the ULX spectrum. The trace position on the spatial axis varied by less than 0.5 pixels along the length of the dispersion axis. The trace for the ULX counterpart was centered using the profile of the Heii 4686 emission line. Wavelength lamp and standard star (EG247) spectra were used to wavelength and flux calibrate the spectra. Extinction corrections were applied using the CTIO extinction tables available in IRAF.
The spectra were searched for emission and absorption lines using the splot task in IRAF. A number of emission lines, discussed below were found. No stellar absorption lines were detected. There are some weak absorption features that are due to subtraction of night sky background lines at 5580 Å and just above the He i line at 5885 Å. The latter night sky line makes measurement of the He i 5876 flux unreliable. After correction for the redshift of NGC 5408, , the lines are all within 1 Å of the expected values except for [Nev] 3426 which differs by 3 Å. However, [Nev] is at a shorter wavelength than the shortest available in the wavelength calibration lamp spectra, 3650 Å, and we believe that the offset is due to extrapolation of the calibration.
2.2. X-ray
To determine the spectrum of X-rays from the ULX, we extracted the longest publicly available observation of NGC 5408 from the XMM-Newton archive. The observation was performed on Jan 13, 2006 and had a duration of 133 ks (Strohmayer et al., 2007). We performed the standard XMM data filtering, including removal of data from times when background flares were present using SAS version 8.0.0. We selected only single pixel events in order to obtain the best energy resolution, since adequate photon statistics were available, and binned the X-ray spectrum in the 0.3–9.55 keV band to have at least 25 counts per bin. We fitted the spectrum using XSPEC version 12.5.0.
Following Kaaret et al. (2004b), we chose to use a Comptonization model, compps (Poutanen & Svensson, 1996), including multicolor blackbody emission from an accretion disk because we must extrapolate the X-ray spectrum to energies below the minimum observed X-ray energy in order to provide a useful input to the photoionization modeling described below. We used the tbabs model to account for interstellar absorption along the line of sight. We found evidence for an emission line or the combination of a unresolved group of emission lines near 0.9 keV and included a Gaussian to fit that component. Our best fitted model gave a of 243.2 for 219 degrees of freedom with a column density , an inner disk temperature , and a Comptonization electron temperature of and optical depth of . We note that the electron temperature and optical depth depend on the specific geometry and form of the electron distribution used. The Gaussian emission had a centroid of , a width of , and an equivalent width of 31 eV. This emission component may represent a thermal plasma, as previously suggested for this source (Strohmayer et al., 2007) and also seen from some other ULXs (Feng & Kaaret, 2005). However, using the apec thermal plasma model instead of the single Gaussian produces a worse fit, of 263.3 for 219 degrees of freedom. Thus, interpretation of the line is not clear and higher resolution spectra will likely be required to understand the origin of the emission. Correcting for absorption and integrating the model from 1 eV to 100 keV, the total luminosity is .
We note that our X-ray and optical observations are not simultaneous; they are separated by two years. However, NGC 5408 X-1 does not appear to be highly variable in X-rays. The X-ray light curve constructed by Kaaret et al. (2003) spanning 22 years with multiple observatories, showed a ratio between the maximum and minimum observed fluxes of 1.4. Those fluxes ranged from 7% below to 30% above our measured flux. Five Chandra observations carried out over 3 years showed a variability of 12% and no significant changes in spectral shape.


| Identification | Wavelength (Å) | Flux | FWHM (Å) |
|---|---|---|---|
| Ne V] 3426 | 3428.9 | 315 21 | 5.2 0.2 |
| O II] 3727 | 3734.4 | 1103 40 | 6.2 0.1 |
| H 3771 | 3777.0 | 46 11 | 4.5 1.1 |
| H 3798 | 3804.8 | 56 12 | 5.4 1.1 |
| H 3835 | 3842.4 | 71 11 | 5.1 0.8 |
| Ne III] 3869 | 3875.9 | 285 15 | 4.9 0.2 |
| H, He i 3889 | 3896.1 | 188 14 | 5.5 0.3 |
| H, Ne iii] 3970 | 3976.6 | 260 16 | 5.8 0.3 |
| H 4102 | 4109.5 | 268 14 | 5.4 0.2 |
| H 4340 | 4348.6 | 471 15 | 5.1 0.1 |
| O III] 4363 | 4371.2 | 81 10 | 5.3 0.7 |
| He II 4686 | 4693.7 | 382 12 | 6.3 0.2 |
| H 4861 | 4869.9 | 1000 8 | 5.2 0.1 |
| O III] 4959 | 4967.8 | 1083 5 | 5.1 0.1 |
| O III] 5007 | 5015.7 | 3226 4 | 5.1 0.1 |
| He I 5876 | 5885.3 | 57 6 | 4.9 0.8 |
| O I] 6300 | 6310.5 | 101 5 | 5.2 0.5 |
Note. — The table gives the dereddened fluxes of emission lines relative to the flux of H = 1000. The dereddened H flux is .
3. Results
Figure 2 shows profiles along the spatial direction of the H emission line, the Heii emission line, and integrated flux over the 4370-4680 Å continuum band. The profiles were extracted from the combination of the entire set of 18 spectra. The spatial profile of the continuum flux from Star A in the same band, shifted to match the profile of the ULX, is shown for comparison. The continuum emission from the ULX appears unresolved. The Heii emission is well centered on the continuum emission from the ULX, but is somewhat broader. We estimate a spatial extent for the Heiii region of roughly (full width at half maximum) corresponding to a diameter of 30 pc for a distance of 4.8 Mpc to NGC 5408 (Karachentsev et al., 2002). The H emission is offset from the continuum and much broader. We chose to extract spectra from a trace that is wide covering the continuum emission and the central part of the Heii emission. The trace is 7 pixels wide as marked by the horizontal line on Fig. 2. For comparison, we also examined the spectrum from a wide trace. The H fluxes increases by a factor of 2.0 and the Heii 4686 increases by a factor of 1.3 for the wide trace. Since the nebula appears to have a larger angular size than our slit size () and the background region selected (due to the presence of star A) may contain some nebular emission, the fluxes quoted here may underestimate the true fluxes.
Using the Balmer decrements of H/H and H/H to estimate the reddening, we find E(B-V) = 0.080.03. The reddening estimated from dust within the Milky Way is (Schlegel, Finkbeiner, & Davis, 1998) and we take this as a lower limit on the reddening. The column density measured via the X-ray spectrum is equivalent to an optical reddening E(B-V) = 0.13 (Predehl & Schmitt, 1995). If the optical extinction measures to the edge of a nebula surrounding the ULX and the additional extinction seen in the X-rays is due to absorption in the nebula, then the column density through the nebula would be . We corrected for reddening using the extinction curve from Cardelli, Clayton, and Mathis (1989) with .
The combined spectrum from all of the observations is shown in Fig. 3. The spectrum is dominated by emission lines, but continuum emission is also detected. Table 2 gives the dereddened line fluxes relative to H and their widths. The dereddened H flux was . The widths of the lines are all consistent with the instrumental resolution except for [O II] 3726, 3729 which is a blend, He II 4686, and possibly [Ne V] 3426.

| Line | OB1 | OB2 | OB3 | OB4 | OB5 | OB6 |
|---|---|---|---|---|---|---|
| O III] 5007 | 223 | 213 | 206 | 219 | 228 | 216 |
| H 4861 | 76 | 70 | 70 | 73 | 75 | 72 |
| He II 4686 | 25 | 25 | 24 | 17 | 26 | 25 |
| Ne V] 3426 | 18 | 19 | 18 | 11 | 18 | 20 |
| Continuum | 1.9 | 2.0 | 1.8 | 1.4 | 2.0 | 2.1 |
Note. — The table lists the observed fluxes of four selected emission lines in units of and the continuum flux integrated over the band 4000-6000 Å in units of for each observation block (OB).
We analyzed each observation block individually. Most of the line fluxes appear constant with variations on the order of 5% that may be due to differences in the placement of the slit. However, the fluxes for He II 4686 and [Ne V] 3426 in OB 4 are only 70% of the average in the other observations, see Table 3. The average width of the [O III] 5007 line is 5.1Å. The average width of the He II 4686 line, excluding OB4, is somewhat broader at 6.2Å. This suggests an intrinsic width of the He II line of 3.5Å, equivalent to 230 km/s. The width of the He II 4686 line in OB4 is 5.6Å, which is marginally narrower than in the in other observations.
We measured the continuum emission by removing all the detected lines and then averaging the remaining flux in bins of 50Å. We fit a power-law to the dereddened and redshift-corrected continuum spectrum in the 4000–6000Å band. The total flux in this band for each OB is given in Table 3. The level of continuum emission is roughly constant, within about 5%, except for OB4 which has about 70% of the average flux of the other observations. The best fitted spectral index for the average of all observations is , where the uncertainty allows for the uncertainty in the reddening. The spectral indexes for the individual OBs are consistent with this range. Fig. 4 shows the continuum emission for the average spectrum and the OBs with the highest (OB6) and lowest (OB4) continuum flux.
4. Discussion
4.1. Emission lines
The fact that the line emission appears spatially extended and the narrow widths of the lines suggest that they are produced in a nebula. However, the variability of the He II 4686 and [Ne V] 3426 lines suggests that part of the emission in these two lines is produced close to the compact object, within one light day.
The spectral resolution is not adequate to resolve the [O ii] 3729/3726 lines and the coverage does not extend to the [S ii] 6716/6731 lines, so these standard density indicators cannot be used to estimate the density. From the flux and spatial extent of the H line, a rough estimate of the average density is . The column density from the ULX to us through (half of) the nebula is then in reasonable agreement with the excess absorption in the X-ray spectrum.
The weakness of low-ionization lines, particularly [O i] 6300 suggests that shocks are not the dominant source of ionization. Using the ratio of [O iii] lines, , we estimate the nebular temperature to be near 17000 K. This is consistent with that expected for photoionization and lower than that expected for shock ionization (Osterbrock & Ferland, 2006). The metallicity indicator ([O ii](3727 + [O iii](4959 + 5007))/H = 5.40.2, suggesting a metallicity somewhat lower than solar (Kewley & Dopita, 2002). Using the spectrum from the trace, the same ratio is .
The strength of the Heii 4686 and [Nev] 3426 emission is strong evidence that the line emission is powered by photoionization from a source of high excitation. The ratio Heii/H equals 0.38 for the average of all observations and 0.27 for OB4. Both values are higher than found in Hii regions in nearby galaxies (Garnett et al., 1991) and higher than in the X-ray photoionized nebula surrounding Holmberg II X-1 (Pakull & Mirioni, 2003; Kaaret et al., 2004b). Within the trace in the average spectrum, the luminosity in Heii 4686 is for a distance of 4.8 Mpc to NGC 5408 (Karachentsev et al., 2002). Taking the full extent of the nebula (within the slit) increases this to . The [Nev] 3426 luminosity integrated over the full extent of the nebula is . These values may underestimate the true luminosities, since the nebula appears to be more spatially extended than our slit. The variability of the Heii line indicates that part of the emission is due to the compact object instead of the extended nebula. The Heii luminosity for the wide trace in OB4 is .
The Heii emission from NGC 5408 X-1 is a factor of 10 more luminous than that from the persistent stellar-mass black hole X-ray binary LMC X-1 (Pakull & Angebault, 1986) but similar in luminosity and size to the Heiii region around the ultraluminous X-ray source Holmberg II X-1 (Kaaret et al., 2004b). There are powerful radio nebulae associated with both ULXs (Miller et al., 2005; Lang et al., 2007), while LMC X-1 is radio quiet (Fender, Southwell, and Tzioumis, 1998). The higher Heii luminosities of the ULXs suggest that the compact objects produce a greater isotropic luminosity than does the stellar-mass black hole X-ray binary LMC X-1.
We used the photoionization code Cloudy version 07.02 Ferland et al. (1998) to model the nebula with the X-ray spectrum described above as input in order to determine the relation between the Heii luminosity and the ionizing X-ray luminosity. We placed the X-ray source at the center of a spherical nebula with a filling factor of 1 and a radius of 20 pc. The radius is slightly larger than the observed size of the Heiii region since the H emission extends to lower excitation and thus larger radii.
The relation between Heii luminosity and the total luminosity of the ionizing X-ray/UV radiation is not sensitive to metallicity or density as long as the density is high enough that the region of fully ionized He is contained within the simulated nebula and the density is not so high that there is strong absorption of Heii 4686 within the nebula. From the measured Heii luminosity for OB4, the minimum value we observe, we estimated that the true X-ray luminosity must be at least . This value is a lower bound since an increased X-ray luminosity would be required if nebula surrounding the ULX covers only part of the emitted X-rays or if the radiation field at the outer edge of the nebula is still strong enough to ionize He. Given the X-ray flux and spectrum measured with XMM-Newton, the total intrinsic X-ray luminosity is and the X-ray luminosity in the observed 0.3-10 keV band is after correction for absorption. Thus, the X-ray emission from the ULX is not strongly beamed. Use of the [Nev] luminosity produces similar conclusions, but they are a bit less certain due to the influence of metallicity.
A Cloudy simulation with a density of , an input X-ray luminosity of , and a metallicity of produced results that matched the data for OB4 reasonably well. In particular, the [O iii] line ratio, . The diameter of the Heiii region was close to 30 pc. The Heii luminosity was and the [Nev] luminosity was . All of these are close to the observed values for OB4. The ratio Heii/H = 0.52 is somewhat higher than observed because our simulated nebula does not cover the full Hii region.
We note that the observed H and [O iii] emission is offset from the continuum emission, while the Heii emission is reasonably well centered on the continuum. Thus, while our Cloudy simulation is likely a reasonable approximation to the geometry of the high excitation regions of the nebula, it does not adequately describe the more extended, low excitation parts of the nebula. Therefore, while the simulation results regarding the Heii and [Nev] fluxes are likely robust, the results regarding the low excitation lines may be dependent on the geometry of the nebula. High resolution imaging of the nebula in several emission lines will be necessary to understand its structure in detail.
The nebula is similar in size to the radio nebula near NGC 5408 X-1 (Lang et al., 2007). The ULX Holmberg II X-1 also has both Heii and radio nebulae and their morphology appears to be linked (Miller et al., 2005). It would be of interest to image both the optical and radio in more detail and compare their morphologies.
4.2. Continuum emission

Compared with a power-law fitted to the data in the 4000-6000 Å band, the continuum spectrum, see Fig. 4, shows a marked increase at short wavelengths with higher flux at wavelengths shorter than the Balmer edge. Such a feature is expected from a photoionized nebula. The solid line in Fig. 5 shows the predicted continuum emission from the Cloudy simulation described below and the triangles show the data after the nebular continuum is subtracted. The nebular continuum matches the enhancement across the Balmer edge reasonably well. The excess in the subtracted flux just longward of the Balmer edge is likely due to high order lines in the Balmer series that the line removal procedure applied to the optical data does not successfully identify and remove.
We fitted the continuum after nebular subtraction with a power-law in the 4000-6000 Å band. The best fitted spectral index is and the dominant errors are the nebular subtraction and the reddening correction. The fitted flux is Å-1 at 4300 Å and Å-1 at 5500 Å. These translate to Johnson-Cousins magnitudes of and . The latter value is in reasonable agreement with that found from HST images of the counterpart, (Lang et al., 2007).
The X-ray to optical flux ratio, where is the X-ray flux density in Jy after correction for absorption, is at 2 keV and at 0.5 keV. As noted above, our X-ray and optical observations are separated by 2 years. However, since the observed X-ray variability of NGC 5408 X-1 is relatively modest, see §2.2, the induced uncertainty in is only 0.3. These values of are similar to those found for those low-mass X-ray binaries where the optical spectra are dominated by reprocessing of X-rays in the outer accretion disk (van Paradijs & McClintock, 1995). The spectral shape, a power-law with a spectral index is close to , is also similar to X-ray binaries where the optical light is primarily due to reprocessed X-rays. Thus, a significant fraction of the light from the optical companion may arise from reprocessing in the disk.
We fitted the X-ray and optical data simultaneously with the irradiated disk model of Gierliński, Done, & Page (2008), diskir. We first used the Cloudy simulation based on the X-ray spectrum modeled with compps to estimate the nebular optical continuum. We then fitted the X-ray and optical nebula-subtracted continuum emission data with the diskir model. We then ran Cloudy again, using this initial set of diskir model parameters. We used this second Cloudy run to, again, estimate the nebular optical continuum; this is the dashed line in Fig. 5. We then performed the nebula subtraction and fitted the X-ray and optical data with the diskir model a second time. The parameters from the second iteration of Cloudy are very similar to those of the first iteration. The ratio of Heii luminosity to bolometric luminosity of the compact object agrees within 5% and the other line fluxes agree within 20%.
Our best fitted irradiated disk model gave a of 278.7 for 258 degrees of freedom with a column density , an inner disk temperature , an asymptotic photon index of , an electron temperature of , and a ratio of Compton to disk luminosity of . The fraction of the Compton tail thermalized in the disk was fixed at 0.1. The irradiated portion of the disk had an outer radius of , in units of the inner disk radius, , where is the compact object mass. The irradiated disk thermalized a fraction of the bolometric luminosity . Correcting for absorption and integrating the model from 0.1 eV to 100 keV, the total luminosity is . As for the Comptonized disk model, the irradiated disk model required addition of a Gaussian near 0.92 keV to produce an adequate fit. We note that the X-ray and optical observations were not simultaneous. We redid the fits with the optical fluxes reduced by 30% and the only significant change in the parameters was a reduction of to .
The fact that the optical continuum is well described by a model of the irradiated outer parts of a standard geometrically thin, optically thick accretion disk raises confidence in the application of standard accretion disk models to the spectra of NGC 5408 X-1. The fraction of the total luminosity thermalized in the outer disk is higher than seen from stellar-mass X-ray binaries in the soft or ‘thermal dominant’ spectral state, but is within in the range seen in states where a sizable fraction of the emission arises from the Comptonized component (Gierliński, Done, & Page, 2008). The spectral state of NGC 5408 X-1 would be classified as the ‘steep power-law state’ on the basis of the energy spectrum and the presence of QPOs in the classification scheme of Remillard & McClintock (2006). It would be of interest to study reprocessing in stellar-mass X-ray binaries in similar states, in which a moderately soft power-law component supplies significant flux, to allow a direct comparison. From the best fit value found for the outer radius of the irradiated disk, we calculate an orbital velocity at the outer edge of the disk of 1200 km/s. This is larger than the measured width of the Heii emission line, which must arise at least in part from reprocessing since it is variable. These results may suggest that we view the disk close to face-on.
As noted in the introduction, the cool temperatures derived from standard disk models applied to ULX spectra have been interpreted as evidence for intermediate mass black holes (Kaaret et al., 2003), but the validity of such models have been ruled out for some sources Feng & Kaaret (2007a). The alternative is that the sources are stellar mass black holes with super-Eddington accretion rates. In the so-called ‘slim disk’ models of super-Eddington accretion flows, the disk surface is convex causing the outer disk to be shielded from the luminous portions of the inner disk (Abramowicz et al., 1988). Thus, the fraction of the apparent luminosity that irradiates the outer disk is much lower than for a standard thin disk. Super-Eddington accretion may, instead, cause the ejection of mass leading to a wind that reprocesses the hard spectrum of radiation from the inner part of the disk into a softer spectrum (Poutanen et al., 2007). The outer parts of the disk would then see this softer spectrum, that we measure to have a characteristic temperature near 0.16 keV. Such soft X-rays do not thermalize in the disk and, thus, do not contribution significantly to the reprocessed emission in the 4000–6000Å band (Gierliński, Done, & Page, 2008). Such accretion flows would thermalize only a very small fraction of the apparent luminosity in the outer disk.
The measured ratio of optical to X-ray flux for NGC 5408 X-1 is larger than would be expected in models of super-Eddington accretion flows, but is in the range expected from a standard thin disk. Further observations of the continuum emission from NGC 5408 X-1 would allow us to better constrain the properties of the irradiated disk. Simultaneous measurement of the optical and X-ray spectrum would provide a better constraint on the thermalized radiation fraction. Extension of the optical coverage into the IR would enable measurement of the roll over of the irradiated spectrum to a Rayleigh-Jeans spectrum. From our best fitted irradiated disk model, this should occur at roughly 1 m. Extension of the optical coverage into the UV could enable measurement of the long wavelength tail of the direct disk emission.
Acknowledgments
This paper is based on observations made with ESO Telescopes at the La Silla Paranal Observatory under program ID 381.D-0051(A). We thank the telescope operators for performing the observations, particularly in their successful correction of an error in our finding chart. PK thanks Sylvain Chaty for his extensive help with the FORS data reduction and Hua Feng and Ken Gayley for useful discussions. PK acknowledges partial support from a Faculty Scholar Award from the University of Iowa and NASA grant NNX08AJ26G. SC acknowledges support from the European Community through Marie Curie FP7 ITN network ”Black Hole Universe” (Grant #: 215212). This publication makes use of data products from the Two Micron All Sky Survey, which is a joint project of the University of Massachusetts and the Infrared Processing and Analysis Center/California Institute of Technology, funded by the National Aeronautics and Space Administration and the National Science Foundation.
References
- Abramowicz et al. (1988) Abramowicz, M.A., Czerny, B., Lasota, J.P., Szuszkiewicz, E. 1988, ApJ, 332, 646
- Appenzeller et al. (1998) Appenzeller, I. et al. 1998, Messenger, 94, 1
- Cardelli, Clayton, and Mathis (1989) Cardelli, Clayton, and Mathis 1989, ApJ, 345, 245
- Dachs, Poetzel, & Kaiser (1989) Dachs, J., Poetzel, R., Kaiser, D. 1989, A&AS, 78, 487
- Fender, Southwell, and Tzioumis (1998) Fender, R.P., Southwell, K., Tzioumis, A.K. 1998, MNRAS, 298, 692
- Feng & Kaaret (2005) Feng, H., & Kaaret, P. 2005, ApJ, 633, 1052
- Feng & Kaaret (2007a) Feng, H. & Kaaret, P. 2007a, ApJ, 660, L113
- Feng & Kaaret (2007b) Feng, H. & Kaaret, P. 2007b, ApJ, 668, 941
- Ferland et al. (1998) Ferland, G.J., Korista, K.T., Verner, D.A., Ferguson, J.W., Kingdon, J.B., Verner, E.M. 1998, PASP, 110, 761
- Garnett et al. (1991) Garnett D.R., Kennicutt R.C., Chu Y.-H., Skillman E.D. 1991, PASP, 103, 850
- Gierliński, Done, & Page (2008) Gierliński, M., Done, C. & Page, K. 2008, MNRAS, to appear, arVix:0808.4064
- Hutchings et al. (1987) Hutchings, J.B., Crampton, D., Cowley, A.P., Bianchi, L., Thompson, I.B. 1987, AJ, 94, 340
- Kaaret et al. (2001) Kaaret, P. et al. 2001, MNRAS, 321, L29
- Kaaret et al. (2003) Kaaret, P., Corbel, S., Prestwich, A.H., Zezas, A. 2003, Science, 299, 365.
- Kaaret et al. (2004a) Kaaret, P., Alonso-Herrero, A., Gallagher, J.S. III, Fabbiano, G., Zezas, A., Rieke, M.J. 2004, MNRAS, 348, L28
- Kaaret et al. (2004b) Kaaret, P., Ward, M. J., & Zezas, A. 2004, MNRAS, 351, L83
- Karachentsev et al. (2002) Karachentsev, I.D. et al. 2002, A&A, 385, 21
- Kewley & Dopita (2002) Kewley, L.J. & Dopita, M.A. 2002, ApJS, 142, 35
- Lang et al. (2007) Lang, C.C., Kaaret, P., Corbel, S., Mercer, A. 2007, ApJ, 666, 79
- Miller et al. (2005) Miller, N.A, Mushotzky, R.F., Neff, S.G. 2005, ApJ, 623, L109
- Osterbrock & Ferland (2006) Osterbrock, D.E. & Ferland, G.J. 2006, Astrophysics of Gaseous Nebulae and Active Galactic Nuclei (2nd ed., University Science Books)
- Pakull & Angebault (1986) Pakull M.W., Angebault L.P. 1986, Nature, 322, 511
- Pakull & Mirioni (2003) Pakull, M. W., & Mirioni, L. 2002, Revista Mexicana de Astronomía y Astrofísica (Serie de Conferencias) 15, 197
- Poutanen & Svensson (1996) Poutanen J., Svensson R. 1996, ApJ, 470, 249
- Poutanen et al. (2007) Poutanen, J., Lipunova, G., Fabrika, S., Butkevich, A.G., Abolmasov, P. 2007, MNRAS, 377, 1187
- Predehl & Schmitt (1995) Predehl, P. & Schmitt, J.H.M.M. 1995, A&A, 293, 889
- Remillard & McClintock (2006) Remillard, R. A., & McClintock, J. E. 2006, ARA&A, 44, 49
- Rodríguez, Mirabel, Martí (1992) Rodríguez, L.F., Mirabel, I.F., Martí, J. 1992, ApJ, 401, L15
- Schlegel, Finkbeiner, & Davis (1998) Schlegel, D., Finkbeiner, D., & Davis, M. 1998, ApJ, 500, 525
- Skrutskie et al. (2006) Skrutskie, R.M. et al. 2006, AJ, 131, 1163.
- Strohmayer & Mushotzky (2003) Strohmayer, T.E. & Mushotzky, R.F. 2003, ApJ, 586, L61
- Strohmayer et al. (2007) Strohmayer, T. et al. 2007, ApJ, 660, 580
- Tody (1993) Tody, D. 1993, “IRAF in the Ninetie” in Astronomical Data Analysis Software and Systems II, A.S.P. Conference Ser., Vol 52, eds. R.J. Hanisch, R.J.V. Brissenden, J. Barnes, 173.
- van Paradijs & McClintock (1995) van Paradijs, J. & McClintock J.E. in X-Ray Binaries, eds. W.H.G. Lewin, J. van Paradijs, & E.P.J. van den Heuvel, (Cambridge Univ. Press, 1995), pp. 58-125.