DSF/30/2008, IFIC/08-67
Sensitivity on Earth Core and Mantle densities using Atmospheric Neutrinos
Abstract
Neutrino radiography may provide an alternative tool to study the very deep structures of the Earth. Though these measurements are unable to resolve the fine density layer features, nevertheless the information which can be obtained are independent and complementary to the more conventional seismic studies. The aim of this paper is to assess how well the core and mantle averaged densities can be reconstructed through atmospheric neutrino radiography. We find that about a sensitivity for the mantle and for the core could be achieved for a ten year data taking at an underwater km3 Neutrino Telescope. This result does not take into account systematics related to the details of the experimental apparatus.
pacs:
13.15+g, 14.60Lm, 91.35.-x1 Introduction
Earth tomography with high–energy cosmic neutrinos is quite an old idea [1]-[8] that seems to provide a viable independent determination of the internal structure of our planet. In particular, cosmic neutrinos with an energy of a few TeV have an interaction length of the order of the Earth radius and thus sample the density profile along the path. Detecting at a km3 Neutrino Telescope the flux of emerging charged leptons (mainly muons) versus the arrival direction can be therefore, a promising approach for measuring at least some of the features of the Earth density radial profile as recently discussed in Ref. [8]. In particular, such a measurement can provide information concerning the core/mantle boundary which determines the geodynamo as well as the feeding mechanism of hotspots at the surface [9]. The standard body-wave and free oscillation studies, even though are much more precise tools than what it can be reasonably obtained by neutrino radiography, are not free of ambiguities related to the local nature of the seismometer arrays and moreover, to the capacity of free-oscillation data to detect one–dimensional structures only.
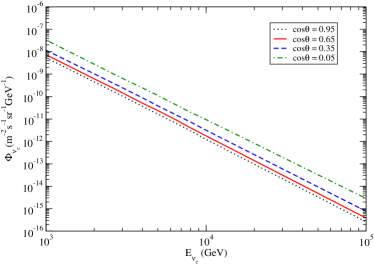
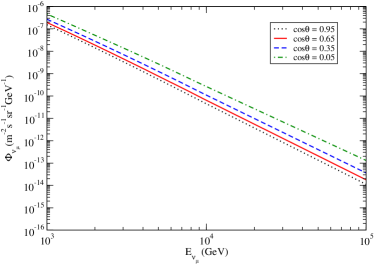
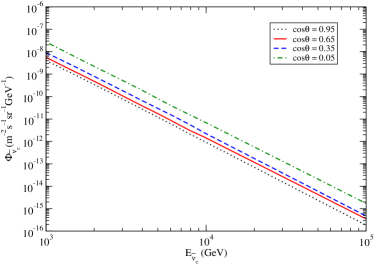
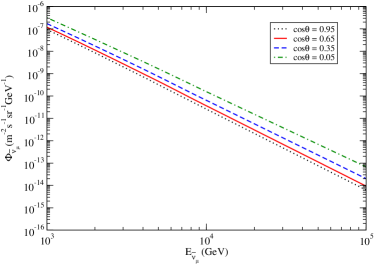
At the energy of few TeV the neutrino flux crossing the Earth is
essentially made of Atmospheric Neutrinos (AN) which are produced in
collisions of cosmic rays with nuclei in the Earth’s atmosphere. The AN
spectrum decreases very steeply with energy, as the flux is proportional
to with [10]. Until
energies of the order of TeV the AN are the dominant contribution to
the whole neutrino flux and this is compatible with AMANDA bound on
extragalactic neutrinos [10, 11]. On the
other hand, at higher energies a considerable prompt neutrino flux from
the decay of heavy mesons is expected, as well as an extragalactic
neutrino component. We are limited in our analysis by the transparency of
the Earth to the neutrinos of the lowest energies, and by their prompt and
yet uncertain extragalactic flux components at the highest energies. So,
we use the electron and muon (anti)neutrino fluxes calculated in Ref.
[12] by using the “modified DPMJET-III” in the energy
range GeV and extrapolating as a power-law behavior till
GeV. These fluxes show a zenith angle dependence, as shown in
Fig. 1, which should be taken into account since the
relative numbers of neutrino induced charged lepton events in the detector
in different angular bins are crucial observables for our analysis. We
notice that neutrino flavor oscillations can be neglected in the energy
range we are interested in, since they are only effective at energies
lower than TeV [13, 14].
 |
 |
 |
 |
The detection perspectives of high energy neutrinos have received a great
interest in the past few years, in view of several proposals and R&D
projects for Neutrino Telescopes (NT’s) in the deep water of the
Mediterranean sea. In particular, the construction of the ANTARES
NT [15] was recently completed and it is taking data.
ANTARES [15], as well as NEMO
[16] and NESTOR [17], are involved in
research and development projects which in the future could lead to the
construction of a km3 telescope as pursued by the KM3NeT project
[18]. Furthermore, IceCube experimental setup, a
cubic-kilometer under-ice neutrino detector [19] is now under
construction and already taking data. It applies and improves the
successful technique of AMANDA [20] to a larger volume.
The sensitivity of a NT to the very deep geological structures is provided
by the charged lepton event rate as a function of the arrival direction,
which shows a remarkable dependence upon the adopted radial matter density
profile, as discussed in details in Ref. [8]. In
particular, in this work the authors point out the possibility to use the
arrival direction distribution of events in ten years of data taking at
IceCube, to distinguish, at level, between the Earth
matter density profile of the Preliminary Reference Earth Model
(PREM) [21] and a homogeneous Earth toy model.
However, in Ref. [8] no indication of the real
sensitivity of neutrino Earth radiography to PREM parameters is reported.
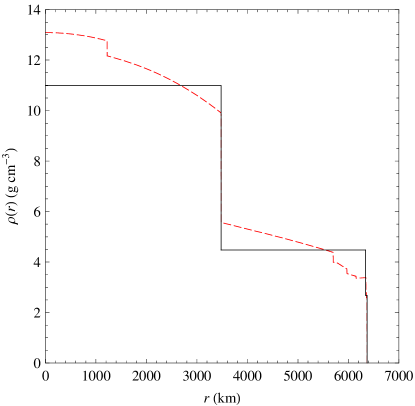
In this paper we present a study of the sensitivity of an underwater NT to
Earth interior in the case of the simplified PREM (sPREM) shown in
Fig. 2, where core and mantle densities are assumed to be
constant and hereafter denoted by and , respectively. To
assess how well these two parameters can be reconstructed, we exploit a
likelihood analysis where the reference Earth model corresponds to the
average values predicted by sPREM, and
with the core/mantle boundary fixed at
3450 km from the center of the Earth. We use as physical observable the
expected event rate as a function of the arrival direction, which accounts
for muon (anti)neutrino induced processes and, only for neutrino
conversions inside the NT, for the electron (anti)neutrino contribution as
well.
2 The Monte Carlo for neutrino interaction in the Earth
We choose as an example of undersea NT a km3 detector placed at
NEMO site, and generate a large number of tracks crossing the NT
fiducial volume (for simplicity a cube of 1 km edge placed at 100 m from
seabed) by means of a detailed Digital Elevation Map of the under-water
Earth surface, which is available from the Global Relief Data survey
(ETOPO2), a grid of altimetry measurements with a vertical resolution of 1
m averaged over cells of 2 minutes of latitude and longitude
[22]. Details can be found in
[23, 24]. The simulation is performed
following tracking particles inside the rock with a maximum of 5 zones of
3 different densities, corresponding to the two regions of sPREM, as well
the crust thin layer. This leads to three possible kinds of neutrino
tracks inside the Earth: those going i) through the core, ii) through
mantle and crust, and iii) through the crust only. We inject a number of
electron and muon (anti)neutrinos for a given energy at each angular bin
according to the flux of AN given in [12]. We do not
consider neutrino tau contribution in this range of energy, since we are
neglecting neutrino oscillations.
The detectable events can be classified in two categories: the track events where the charged lepton is produced outside the fiducial volume, and the contained ones, where neutrino converts inside the NT.
Concerning muon neutrinos, which provide the main contribution to the total amount of events, the Monte Carlo simulates their interaction in the Earth and propagates the outgoing lepton. In this respect, we take into account the phenomenon of neutrino regeneration for a neutral current neutrino interaction. In the case of a charged current neutrino interaction, we consider the muon energy loss in matter due to ionization, bremsstrahlung, pair production and nuclear interaction. An energy threshold of 1 TeV is considered in counting the muons detected in the fiducial volume and the condition of a minimal track length of 300 m in the apparatus defines detectable events. This energy threshold value results to be a good compromise between the need of a sufficiently large statistics, thus a not too high lower energy threshold, and the necessity to reduce the neutrino interaction length in order to increase the sensitivity to Earth density profile. Contained events, which take contributions both from electron and muon neutrinos, are treated separately. To be conservative, in analogy to track ones we assume that they are detected if charged lepton energy is larger than 1 TeV. This, of course, does not take into account the amount of energy released in the hadronic channel accompanying the charged current interaction that for contained events could be in principle detectable. Since the contribution of contained processes is in any case subdominant with respect to the track one, we assume this conservative point of view which has the advantage to make our analysis almost independent of the details of the experimental apparatus. In Fig. 3 we show the angular distribution of the total number of events simulated with our Monte Carlo (at these energies the neutrino and detected charged lepton are collinear) with the zenith angle of the emerging charged lepton, i.e. upgoing neutrinos correspond to . Here, from top to bottom, the solid line represents track-muons, the dashed one the contained-muons and finally the dotted line the contained-electrons. The electron neutrino contribution is typically smaller by one order of magnitude than the corresponding muons due to the less abundant incoming flux (see Fig. 1).

In Fig. 4 we show the total amount of events as a function of both the charged lepton energy and the arrival direction. As expected the main contribution comes from almost horizontal processes just close to the chosen energy threshold.

| sPREM | PREM [8] | |
|---|---|---|
| [0, 0.17] | 2463 | 1132 |
| [0.17, 0.33] | 1196 | 736 |
| [0.33, 0.50] | 714 | 537 |
| [0.50, 0.67] | 513 | 429 |
| [0.67, 0.83] | 306 | 359 |
| [0.83, 1.0] | 210 | 254 |
In Table 1 we report the angular distribution of induced events in 10 years of operation of a NT placed at NEMO site as predicted by our analysis for the sPREM, and compare it with the PREM expectation of Ref. [8] obtained for IceCube. The energy threshold for muons has been fixed to 10 TeV since the corresponding values for 1 TeV are absent in Ref. [8]. As a result of this comparison the two predictions can be considered quite in fair agreement if one takes into account the difference in the adopted Earth density profiles and in the level of detail of the simulation approaches. In fact, differently than in Ref. [8] where a complete Monte Carlo of IceCube is exploited, we are not assuming any details of the experimental apparatus, but simply assume a cube with a 1 km3 volume and acceptance only constrained by the requirement that charged leptons should have a track length in the apparatus not smaller than 300 m.
3 Results and Conclusions
In order to carry out a sensitivity study, we vary the mantle and core densities in a grid of values: 4.00, 4.25, 4.50, 4.75, 5.00 g cm-3, 9.0, 10.0, 11.0, 12.0 g cm-3, and calculate with the Monte Carlo the corresponding number of events in ten years of data taking, , in the five equally spaced angular bins of in the interval [0,1]. We assume an Earth radius of 6378 km and a crust with a thickness of 37 km, while the crust density is fixed to be 2.68 g cm-3. For each pair of chosen values of and , the radius of the core/mantle boundary is then constrained by the mass of the Earth.
We then compare the counts with the expected counts for the benchmark case, g cm-3, g cm-3, km, by means of a likelihood analysis, in which the likelihood function, , is defined using the following expression for the :
| (1) | |||||
where takes into account an overall uncertainty of the atmospheric neutrino fluxes and neutrino interaction cross-section (), while encodes the uncertainty between horizontal and vertical events () [8].

We show in Fig. 5 the 68 and 95% C.L. contours of the marginalized function with respect to and ,
| (2) |
By using we can derive the one dimensional likelihoods reported in Figs. 6 and 7
 |
 |

from which one obtains the “measured” values of the densities and the radius of core/mantle boundary at :
| (3) | |||||
| (4) | |||||
| (5) |
Our analysis hence suggests that a and uncertainties (at 2
level) on the averaged mantle and core densities respectively,
can be reached in a neutrino radiography campaign with a ten years of
data taking at a typical km3 NT, placed in the NEMO site.
In order to understand how different values of and can
affect the angular distribution of events, we report in Table
2 the number of expected induced events in 10
years of operation of a NT placed at NEMO site in the five bins
considered in our analysis for the sPREM, denoted by M g cm-3, and compare them with the same
expectations for two benchmark points and shown in Fig.
5 and chosen at the boundary of the 95% C.L. region. The
energy threshold for muons is 1 TeV. This comparison illustrates the level
of sensitivity of the angular bins with respect to and .
A variation of the expected number of events per bin which is typically
less than 5% is fully compatible with a statistics larger than 104 in
ten years of running time.
| sPREM (M) | A | B | |
|---|---|---|---|
| [0, 0.2] | 113436 | 113860 | 112876 |
| [0.2, 0.4] | 72393 | 75456 | 73981 |
| [0.4, 0.6] | 47334 | 48142 | 47790 |
| [0.6, 0.8] | 34105 | 34144 | 33503 |
| [0.8, 1.0] | 26781 | 27392 | 26780 |
It is worth reminding that these results are obtained in a very simplified
PREM model, and this justifies the good level of sensitivity reachable on
and determinations. Notice also that we do not take into
account systematics related to the details of the experimental apparatus.
Sensitivity to the full PREM detailed features is much weaker, as the
number of density layers and corresponding density parameters sensibly
grow. Nevertheless, information from NT would represent an independent
confirmation of the coarse grained mantle-core transition and
provide complementary information to geophysical techniques.
Acknowledgments: This work is supported by the Istituto Nazionale di Fisica Nucleare I.S. Fa51, the PRIN 2006 “Fisica Astroparticellare: Neutrini ed Universo Primordiale” of the Italian Ministero dell’Istruzione, Università e Ricerca, the Spanish MICINN (grants SAB2006-0171 and FPA2008-00319), by a MICINN-INFN agreement, and by the European Union under the ILIAS project (Contract No. RII3-CT-2004-506222).
References
- [1] L. V. Volkova and G. T. Zatsepin, Bull. Russ. Acad. Sci. Phys. 38 (1974) 151.
- [2] I. P. Nedyalkov, Balatonfuered 1982, Proceedings, Neutrino ’82, Vol. 1, 300-302.
- [3] T. L. Wilson, Nature 309 (1984) 38.
- [4] G. A. Askarian, Sov. Phys. Usp. 27 (1984) 896.
- [5] C. Kuo et al., Earth Plan. Sci. Lett. 133 (1995) 95.
- [6] A. B. Borisov, B. A. Dolgoshein and A. N. Kalinovsky, Yad. Fiz. 44 (1986) 681.
- [7] P. Jain, J. P. Ralston and G. M. Frichter, Astropart. Phys. 12 (1999) 193.
- [8] M. C. González-García, F. Halzen, M. Maltoni and H. K. M. Tanaka, Phys. Rev. Lett. 100 (2008) 061802 [arXiv:0711.0745 [hep-ph]].
- [9] D.E. Loper and T. Lay, J. Geophys. Res. B4 (1995) 6397.
- [10] J. F. Beacom and J. Candia, JCAP 0411 (2004) 009 [arXiv:hep-ph/0409046].
- [11] M. Ackermann et al. [AMANDA Collaboration], Astropart. Phys. 22 (2004) 127 [arXiv:astro-ph/0405218].
- [12] M. Honda, T. Kajita, K. Kasahara, S. Midorikawa and T. Sanuki, Phys. Rev. D 75 (2007) 043006 [arXiv:astro-ph/0611418].
- [13] A. D. Martin, M. G. Ryskin and A. M. Stasto, Acta Phys. Polon. B 34 (2003) 3273 [arXiv:hep-ph/0302140].
- [14] J. F. Beacom, P. Crotty and E. W. Kolb, Phys. Rev. D 66 (2002) 021302 [arXiv:astro-ph/0111482].
- [15] M. Spurio [ANTARES Collaboration], arXiv:hep-ph/0611032.
- [16] E. Migneco et al. [NEMO Collaboration], Nucl. Instrum. Meth. A 588 (2008) 111.
- [17] G. Aggouras et al. [NESTOR Collaboration], Nucl. Instrum. Meth. A 567 (2006) 452.
- [18] U. F. Katz, Nucl. Instrum. Meth. A 567 (2006) 457 [arXiv:astro-ph/0606068].
- [19] M. Krasberg [IceCube Collaboration], AIP Conf. Proc. 867 (2006) 209.
- [20] J. D. Zornoza [IceCube Collaboration], Nucl. Phys. Proc. Suppl. 165 (2007) 196.
- [21] A. M. Dziewonski and D. L. Anderson, Phys. Earth Planet. Interiors 25 (1981) 297.
- [22] U.S. Department of Commerce, National Oceanic and Atmospheric Administration, National Geophysical Data Center, 2001 2-minute Gridded Global Relief Data, http://www.ngdc.noaa.gov/mgg/fliers/01mgg04.html
- [23] A. Cuoco et al., JCAP 0702 (2007) 007 [arXiv:astro-ph/0609241].
- [24] E. Borriello et al., Phys. Rev. D 77 (2008) 045019 [arXiv:0711.0152 [astro-ph]].