The Fundamental Planes of E+A galaxies and GALEX UV-excess early-type galaxies: Revealing their intimate connection
Abstract
Strong Balmer absorption lines and the lack of H and [OII] emission lines signify that E+A galaxies are post-starburst systems. Recent studies suggest that E+As may undergo the transition from the ‘blue cloud’ to the ‘red sequence’ and eventually migrate to red sequence early-type galaxies. An observational validation of this scenario is to identify the intervening galaxy population between E+As and the red-sequence. Motivated by recent findings with Galaxy Evolution Explorer (GALEX) that an unexpectedly large fraction of early-type galaxies exhibit UV-excess (i.e. blue UV – optical colours) as a sign of recent star formation (RSF), we investigate the possible connection of the UV-excess galaxies to E+As. In particular, we examine the Fundamental Plane (FP) scaling relations of the currently largest sample of 1,000 E+As selected from the SDSS and 20,000 morphologically-selected SDSS early-type galaxies with GALEX UV data. The FP parameters, combined with stellar population indicators, reveal a certain group of UV-excess early-types that bridges between E+As and quiescent red galaxies. The newly identified galaxies are the post-starburst systems characterized by UV-excess but no H emission. This is essentially a conceptual generalisation of “E+A”, in that the Balmer absorption line in the “E+A” definition is replaced with UV – optical colours that are far more sensitive to RSF than the Balmer lines. We refer to these UV-excess galaxies as “E+a” galaxies (named after “E+A”), which stands for elliptical (“E”) galaxies with a minority of A-type (“a”) young stars. The species are either (1) galaxies that experienced starbursts weaker than those observed in E+As (1 10 per cent of E+As, “mild E+As”) or (2) the products of passively evolved E+As after quenching star formation quite a while ago ( 1 Gyr, “old E+As”). We suggest that the latter type of E+a galaxies (i.e. old “E+As”) represents the most recent arrival to the red sequence in the final phase of the E+A to red early-type transition.
keywords:
galaxies: fundamental parameters – galaxies: elliptical and lenticular, cD – galaxies: formation – galaxies: evolution – galaxies: starburst – ultraviolet: galaxies1 Introduction
The study of galaxy evolution began to flourish after Dressler & Gunn (1983) discovered galaxies with unusual spectra that showed characteristics of both elliptical galaxies and A-type stars, now referred to as “E+A” galaxies. E+As are considered as post-starburst systems because of strong Balmer absorption lines, sign of recent starbursts within 1 Gyr, and a lack of [OII] and H emission lines indicating a suddenly quenched star formation (e.g. Dressler & Gunn, 1983; Poggianti et al., 1999; Goto, 2004).
How star formation in E+As has started and quenched is a topic that has been studied by many. One plausible explanation is that E+As result from some physical mechanisms in cluster environments, such as ram-pressure stripping (e.g. Spitzer & Baade, 1951; Gunn & Gott, 1972; Fujita & Goto, 2004), galaxy-cluster tidal interaction (Bryd & Valtonen, 1990), or galaxy harassment (e.g. Moore et al., 1996). However, the fact that a significant fraction of E+As are found in field environments implies that cluster-related physical mechanisms are not enough to explain the origin of all E+As (e.g. Zabludoff et al., 1996; Blake et al., 2004; Goto, 2005b). Another possible explanation for the E+A phenomena is starburst galaxies with very thick optical depth caused by dust obscuration (Couch & Sharples, 1987; Smail et al., 1999; Poggianti & Wu, 2000), but radio and IR observations have detected little star formation obscured by dust in E+As (Galaz, 2000; Miller & Owen, 2001; Goto, 2004). Recently, Goto (2005b) showed that E+As have closer companions than other galaxies do, providing evidence that a dynamical merger / interaction could be the physical origin of field E+As. This scenario is also supported by the dynamically disturbed morphologies of E+As (Tran et al., 2004; Yang et al., 2004; Yamauchi & Goto, 2005; Liu et al., 2007). While there are some plausible scenarios, the origin of E+As is still not well understood.
E+As are the key populations for understanding the galaxy evolution because they are believed to be in a transition phase from a ‘blue cloud’ to a ‘red sequence’. Based on galaxy properties such as colour profiles and scaling relations, Yang et al. (2008) suggest that E+As are the remnants of galaxy-galaxy interactions/mergers and ultimately evolve into early-type galaxies. The typical migration time from the gas-rich ‘blue cloud’ to the gas-poor ‘red sequence’ is about 1.5 Gyr according to the UV properties of E+As (Kaviraj et al., 2007a). UV light is useful for tracking E+A migration because it is very sensitive to the young stellar population. The recent star formation (RSF) signature in UV light continues about 1.5 Gyr (Yi et al., 2005). According to recent GALEX observations, a significant fraction of early-type galaxies in the local Universe have enhanced UV flux (i.e. blue UV – optical colours) as a sign of young stellar population (e.g. Yoon et al., 2004a; Yi et al., 2005; Salim et al., 2005; Donas et al., 2007; Kaviraj et al., 2007b). The relatively weak RSF galaxies might have arisen mainly through two channels: (a) the residual star formation in gas-poor galaxies, or (b) the fading away of a young stellar population in galaxies that underwent a violent starburst. UV-excess early-types appear to be the most recent arrival at the red sequence in the final phase of the blue cloud to red sequence transition, and may thus be linked to E+As.
Early-type galaxies can be described by three observational parameters: their effective radius (), effective mean surface brightness () within , and central velocity dispersion (). These parameters are unified in a two-dimensional manifold, the Fundamental Plane (FP) (Djorgovski & Davis, 1987; Dressler et al., 1987). Even though the FP has intrinsic scatter (Jrgensen et al., 1996), the thin FP of early-type galaxies implies that there are well defined scaling relations between their global parameters. The FP can be expressed such that log = log + + , where is the effective radius in kpc. Supposed that early-type galaxies are virialized homologous systems with a constant mass-to-light ratio, the virial theorem predicts = 2.0 and = 0.4. However, the actual, measured coefficients are different from the theoretical expectations (called the “tilt” of the FP). The FP is a useful tool for exploring evolutionary connections among various classes of galaxies (e.g. Genzel et al., 2001; Tacconi et al., 2002; Lee et al., 2007). The purpose of this paper is to investigate the evolutionary path from E+As to quiescent galaxies via UV-excess galaxies by comparing their FPs.
The paper is organized as follows. A description of the sample used in this study is given in § 2. We examine the FPs of our samples and discuss the implication of our results in § 3. We will report an evolutionary connection between E+As and UV-excess galaxies. Finally, § 4 gives the summary.
Except where stated otherwise, we adopt the CDM cosmology with .
2 Sample
2.1 E+A galaxies
This study uses the largest sample of 1,284 E+As selected from the SDSS DR6. The selection criteria of the E+As are the same as Goto (2007), i.e. H EW 4 Å, [OII] EW –2.5 Å, H EW –3.0 Å, and a signal-to-noise ratio 10 pixel-1 in the -band. Since velocity dispersions were measured for only 415 E+As in the SDSS pipeline, we independently measure the velocity dispersions of 673,668 galaxies in the SDSS DR6. Our method is similar to that utilized by the SDSS spectroscopic pipeline; we first mask out possible emission line regions, and then fit the rest of the spectra with a combination of eigen spectra with varying velocity dispersions.
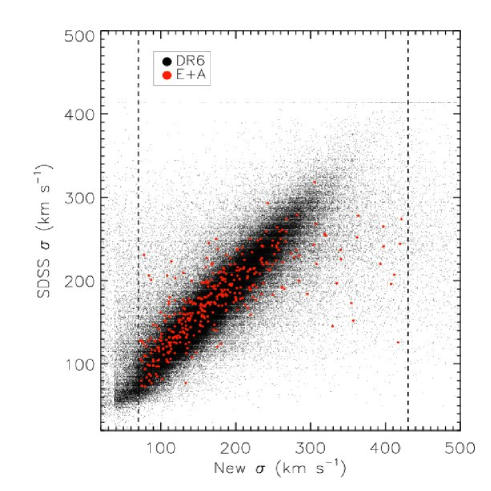
Figure 1 compares our velocity dispersion measurements with those from the SDSS pipeline, showing reasonable one-to-one matches. Red circles are the 377 E+As in common, satisfying 70 km s-1 430 km s-1 in both measurements. We restrict our sample to galaxies with 70 km s-1 430 km s-1 because the instrumental dispersion of the SDSS spectrograph is 69 km s-1 per pixel, and none of template spectra matches the observed ones for most of the galaxies with of 430 km s-1 or higher. Dashed vertical lines mark the lower (70 km s-1) and upper (430 km s-1) limits on the velocity dispersion of our sample. Among the 1,284 E+A candidates from the SDSS DR6, we will use 1,021 E+As which satisfy the velocity dispersion criterion. This is the largest and the most homogeneous E+A sample ever investigated.
2.2 GALEX / SDSS early-type galaxies
The GALEX / SDSS early-type galaxy sample is constructed as follows. First, we make use of 180,000 morphologically-selected SDSS DR4plus early-type galaxies from Choi et al. (2007). In this morphological classification method first presented by Park & Choi (2005), colour, radial gradient in colour, and concentration are the criteria for classification. Park & Choi (2005) estimated the completeness and reliability of this classification method reaching about 91 per cent for SDSS galaxies brighter than -band Petrosian mag, 15.9 and about 88 per cent at 17.5. Then, we match the SDSS early-type galaxies with UV detections in the 2,241 GALEX fields from the GALEX DR4, imaged in the Medium Imaging Survey (MIS), the Deep Imaging Survey (DIS), and Nearby Galaxy Survey (NGS) modes. The cross-matching is performed with an angular matching radius of 3 arcsec. For the multiple GALEX / SDSS matches within the given matching radius ( 5 per cent of all matches), we select the UV source with the smallest angular distance from the SDSS galaxy. The final catalog consists of 23,539 early-type galaxies with near-UV (NUV) information ( 15 per cent of the entire early-type galaxy sample in Choi et al. 2007).
To give basic information of our sample, Figure 2 provides the distributions of -band absolute mag, , and redshift of E+A and early-type galaxies. The early-type sample shows very similar distribution to that of E+A, suggesting their similar stellar mass ranges. However, due to the GALEX UV detection limit, the smaller galaxies are selectively missing in the higher redshift bins, resulting in early-types being confined to lower-redshift regime compared to E+A. In order to avoid the selection bias, the comparative analysis between early-type galaxies and E+As will be restricted to the early-type sample with 0.1. Also note that our volume-limited early-type sample will have redshift ranging from 0.025 to 0.09.
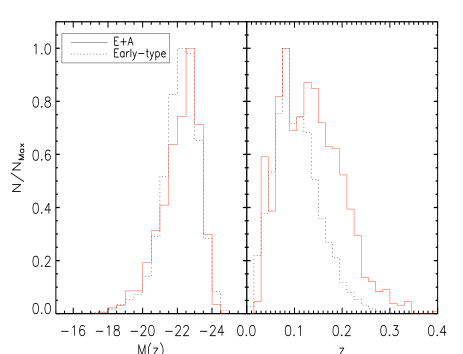
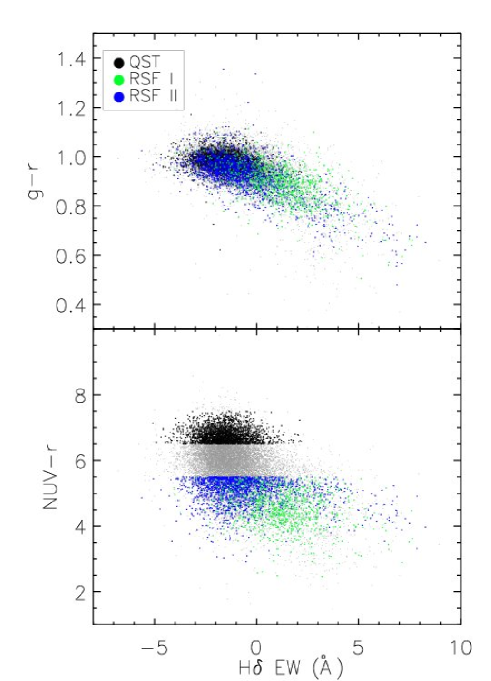
Figure 3 illustrates the power of UV detecting young stellar populations. Most of the quiescent and UV-excess early-type galaxies are so narrowly distributed in colour ( 0.2 mag) that UV-excess early-type galaxies cannot be distinguished from the quiescent ones. In contrast, early-type galaxies with RSF are clearly separated from the quiescent ones in colour. Note that the FUV flux is often affected by the UV upturn while the NUV flux is less sensitive to the phenomenon (Yoon et al., 2004b; Lee et al., 2005; Ree et al., 2007). Thus, the NUV flux is a better tracer for RSF activities in early-type galaxies. This is why colour is used as a selection criterion for UV-excess early-type galaxies. The criterion for UV-excess early-type galaxies is rather conservatively defined as 5.5 (Yi et al., 2005; Kaviraj et al., 2007b; Schawinski et al., 2007). The threshold comes from the colours of nearby giant early-type galaxies with the strongest UV upturn but no sign of RSF activities (e.g Burstein et al., 1988; Lee et al., 2005; Ree et al., 2007). Therefore, we can not rule out the possibility that this threshold excludes some of the less massive RSF galaxies, but, a better threshold than this should await more precise information about the dependence of UV upturn properties on galaxy mass.
The selected UV-excess early-type galaxies are further divided into the following two types by using colour and another prime RSF indicator, H emission line: (a) Ongoing weak star formation galaxies (RSF I) that are characterized by the presence of H emission line with an RSF signature in colour, and (b) Post-weak-star-formation or bygone weak star formation galaxies (RSF II) that show a sign of RSF in colour but no H emission. The rest of the galaxies are UV-dead quiescent galaxies that show no evidence of new-born stars, and are referred to as “QST” .
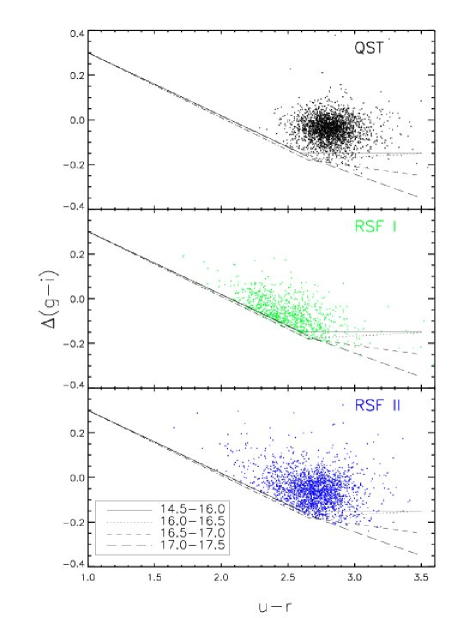
The Park & Choi (2005) morphological classification method performs well in general. However, since the strategy relies on galaxy colours, the UV-excess early-type galaxies may be selectively missed in this scheme. It is important to specify how this affect our results. Figure 4 is the same as Fig. 1 (lower panel) of Park & Choi (2005) but with early-type galaxies having GALEX UV information. It is clear that QST and RSF II galaxies are fairly secure in this scheme, while about a quarter of RSF I galaxies appear to be more consistent with the late-type morphology. This agrees with the result based on visual inspections in Figures 12, 13, and 14. Since our results are based mainly on the QST and RSF II galaxies, the colour-based classification scheme does not affect our conclusion.
In addition, we select 1,548 early-type galaxies with a strong H emission line from the SDSS DR6 with the following criteria:
-
•
Inverse concentration index, / 0.33
-
•
(axis ratio) in the -band 0.6
-
•
H emission line EW 9 Å
-
•
S/N in the -band 10
- •
-
•
Exclusion of 36 disc bulges by eye inspection
We refer to these galaxies as “SH” (strong H) and they do not necessarily have the GALEX UV data.
| RSF mode | H | Class | |
|---|---|---|---|
| Emission line | colour | ||
| Quiescent mode | No | Red | QST |
| ( 0.5 Å) | (6.5 , 7.5) | ||
| Ongoing weak SF | Weak | Blue | RSF I |
| (9 Å , 3 Å) | ( 5.5) | ||
| Bygone weak SF | No | Blue | RSF II |
| ( 0.5 Å) | ( 5.5) | “E+a” | |
| Ongoing starburst | Strong | SH | |
| ( 9 Å) |
The selection criteria for the different types of galaxies introduced in this section are summarized in Table 1.
3 The Fundamental Planes of E+A galaxies and GALEX / SDSS Early-type galaxies
3.1 Construction of the Fundamental Planes
| -band | -band | ||||||||
|---|---|---|---|---|---|---|---|---|---|
| rms | rms | ||||||||
| Direct Fit | |||||||||
| QST | 1.25 0.01 | 0.310 0.003 | –8.33 0.07 | 0.058 | 1.20 0.01 | 0.307 0.003 | –8.46 0.08 | 0.047 | |
| RSF I | 1.13 0.03 | 0.254 0.006 | –6.91 0.16 | 0.166 | 1.08 0.03 | 0.238 0.006 | –6.68 0.17 | 0.166 | |
| RSF II | 1.18 0.02 | 0.254 0.005 | –7.06 0.11 | 0.160 | 1.12 0.02 | 0.239 0.005 | –6.83 0.11 | 0.156 | |
| SH | 0.59 0.03 | 0.200 0.008 | –4.60 0.19 | 0.191 | 0.57 0.03 | 0.222 0.006 | –5.14 0.15 | 0.194 | |
| E+A | 0.73 0.03 | 0.206 0.004 | –4.98 0.12 | 0.184 | 0.68 0.02 | 0.209 0.003 | –5.05 0.10 | 0.170 | |
| Orthogonal Fit | |||||||||
| QST | 1.61 0.02 | 0.306 0.004 | –9.09 0.08 | 0.053 | 1.60 0.02 | 0.301 0.004 | –9.23 0.09 | 0.055 | |
| RSF I | 1.72 0.05 | 0.286 0.007 | –8.82 0.22 | 0.072 | 1.75 0.05 | 0.266 0.007 | –8.71 0.23 | 0.078 | |
| RSF II | 1.75 0.03 | 0.270 0.005 | –8.62 0.13 | 0.075 | 1.75 0.03 | 0.249 0.005 | –8.43 0.14 | 0.080 | |
| SH | 1.80 0.12 | 0.230 0.011 | –7.83 0.34 | 0.129 | 1.76 0.12 | 0.251 0.009 | –8.30 0.33 | 0.130 | |
| E+A | 1.20 0.04 | 0.222 0.005 | –6.35 0.14 | 0.108 | 1.05 0.04 | 0.217 0.003 | –6.06 0.12 | 0.104 | |
| Evolution-Corrected Direct Fit | |||||||||
| QST | 1.19 0.01 | 0.311 0.003 | –8.23 0.07 | 0.014 | 1.12 0.01 | 0.308 0.003 | –8.32 0.07 | 0.035 | |
| RSF I | 1.10 0.03 | 0.258 0.006 | –6.92 0.15 | 0.159 | 1.03 0.03 | 0.244 0.006 | –6.71 0.16 | 0.156 | |
| RSF II | 1.14 0.02 | 0.258 0.005 | –7.06 0.11 | 0.150 | 1.06 0.02 | 0.244 0.004 | –6.82 0.11 | 0.142 | |
| SH | 0.58 0.03 | 0.211 0.008 | –4.79 0.18 | 0.183 | 0.55 0.03 | 0.230 0.006 | –5.27 0.14 | 0.182 | |
| E+A | 0.70 0.03 | 0.210 0.004 | –5.02 0.12 | 0.175 | 0.63 0.02 | 0.211 0.003 | –5.03 0.09 | 0.161 | |
| Evolution-Corrected Orthogonal Fit | |||||||||
| QST | 1.51 0.02 | 0.306 0.003 | –8.87 0.07 | 0.051 | 1.46 0.02 | 0.300 0.003 | –8.94 0.07 | 0.053 | |
| RSF I | 1.62 0.05 | 0.284 0.007 | –8.60 0.20 | 0.071 | 1.62 0.05 | 0.264 0.007 | –8.44 0.21 | 0.076 | |
| RSF II | 1.65 0.03 | 0.270 0.005 | –8.43 0.12 | 0.074 | 1.63 0.03 | 0.249 0.005 | –8.20 0.13 | 0.079 | |
| SH | 1.68 0.12 | 0.232 0.011 | –7.63 0.31 | 0.127 | 1.59 0.11 | 0.251 0.008 | –7.95 0.30 | 0.128 | |
| E+A | 1.12 0.04 | 0.223 0.004 | –6.20 0.13 | 0.105 | 0.95 0.03 | 0.217 0.003 | –5.87 0.11 | 0.102 | |
The three observed parameters for the FP analysis are obtained as follows. We set the effective radius to , where is the ratio of the minor and major axes and is an effective radius from the de Vaucouleurs fit (de Vaucouleurs, 1948). We do this in order to convert an elliptical aperture to an effective circular radius (Bernardi et al., 2003a). The effective mean surface brightness within is given by = + 2.5 log(2) K() 10 log(+1), where is the apparent magnitude obtained by the de Vaucouleurs’ fit (de Vaucouleurs, 1948) and is the redshift. We take into account the K-correction as described by Blanton et al. (2003) and the cosmological (1+)4 dimming effect (e.g. Tolman, 1930). We correct the velocity dispersion for the aperture effect of the SDSS using = , where is 1.5 arcsec and is in arcsec (Jrgensen et al., 1995).
We determine the FP coefficients (, , ) of each type of galaxies (QST, RSF I / II, SH, and E+A) by using the two schemes; the least square direct fitting method and the least square orthogonal fitting method. By performing the robust fit, we reduce the effect of outliers. Direct fitting yields the coefficients that minimize the thickness of the plane in the log direction, while the orthogonal fitting algorithm minimizes the summation of residuals perpendicular to the plane. The plane coefficients are obtained from simple algebraic calculations. For the orthogonal fitting, we use a following covariance matrix
for which the eigenvector corresponding to the smallest eigenvalue is the normal vector of the plane we are seeking. The smallest eigenvalue represents the rms scatter of the plane (e.g. Saglia et al., 2001; Bernardi et al., 2003c). For the direct fitting method, on the other hand, we use the same algebra as Bernardi et al. (2003c). The uncertainties in the coefficients are estimated via 10,000 bootstrap resamplings of the data. The best-fit coefficients and their errors are presented in Table 2.
For a sanity check, we make a combined subset of QST and week-SF (i.e. RSF I and RSF II) galaxies and compare the FP coefficients to those of Bernardi et al. (2003a). We assume that by putting SH galaxies aside the subset mimics their sample. The derived coefficients from both the direct fit and the orthogonal fit are about 5 10 per cent larger than those of Bernardi et al. (2003c). Bernardi et al. (2003b) showed that the corrections for the evolution and selection effects tend to reduce the coefficient . They determined the evolution parameter Q using the maximum likelihood method in the -band (0.85) and in the -band (1.15). After taking weak passive luminosity evolution effect into account, we find the coefficients for the combined sample in very good agreement with Bernardi et al. (2003c). For example, the evolution corrected coefficients of our combined sample are 1.07 for the direct fit and 1.50 for the orthogonal fit in the -band. The Q-correction has been applied to all classes of our sample (QST, RSF I / II, SH, and E+A). The slopes of these subclasses become shallower and consistent with the coefficients suggested by Bernardi et al. (2003c) within the coefficient measurement errors. The evolution corrected coefficients are listed in Table 2. Note that we do not apply the correction for the selection effect which is no more straightforward due to complications arising from the cross matching between two datasets (SDSS and GALEX). Nevertheless, the bias in due to this effect is relatively insignificant compared to the evolution effect (Bernardi et al., 2003c) and hence does not affect our results.
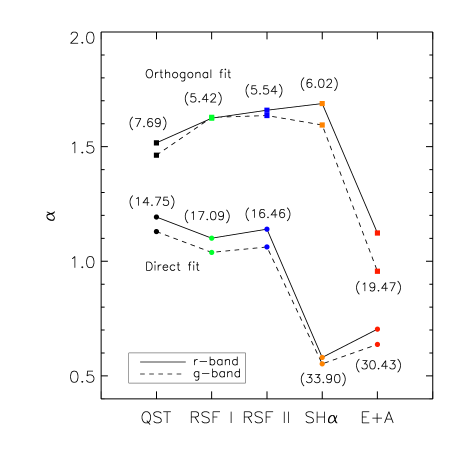
Figure 5 shows the evolution corrected coefficients of all galaxy types obtained from the direct fit (circles) and the orthogonal fit (squares). The well-known wavelength dependency of the FP coefficients (e.g. Pahre et al., 1998; Scodeggio et al., 1998) is weak (e.g Bernardi et al., 2003c; Colless et al., 2001) but apparent. It has been pointed out that the choice of data fitting method affects the FP coefficients (e.g. Saglia et al., 2001; Bernardi et al., 2003c; D’Onofrio et al., 2008). The systematic difference among various fitting methods is most likely caused by the scatter of the FP (e.g. La Barbera et al., 2000). Given that there is no standard method for deriving the coefficients, it is important to choose the method that describes the given data most properly. The coefficients are especially important values when they are used as indicators of the FP tilt. To test which fitting methods work as more reliable and robuster indicators of the FP tilt, we examine a dihedral angle between our plane and the virial plane. The dihedral angles in degree are denoted in parentheses (Fig. 5). While the coefficients from the orthogonal fit do not show a systematic tendency, those from the direct fit behave well as a function of the dihedral angles, in the sense that the coefficients decrease as the dihedral angles increase. For the orthogonal fit, the rank of among different galaxy types can even change depending on the band in use. For instance, the orthogonal fit gives the steepest slope (i.e. the greatest ) for SH in the -band and for RSF II in the -band, respectively. It is also worth noting that while the orthogonal fit has the advantage of treating the FP parameters symmetrically, the method yields coefficients with larger uncertainties, especially for SH. Taken together, the coefficients from the direct fit more successfully describe the relative features of the FP slopes among different galaxy types. Hence, we use the coefficients based on the direct fitting method in the following analysis.
3.2 Comparison of the Fundamental Planes of E+As and Early-type Galaxies in Different RSF Modes
Yang et al. (2008) measured the coefficients of the FP of 16 E+As in the Gunn and the Johnson using the orthogonal fitting method. Their best-fit FP has = 1.13 0.10 and = 0.24 0.07 for the Gunn , and = 1.09 0.08 and = 0.23 0.06 for the Johnson . The largest E+A sample ( 60 times larger than that used in Yang et al. 2008) allows us to estimate the E+A FP with higher accuracy. Our E+A FP based on the orthogonal fitting method is given by
in the - band and -band, respectively. The evolution corrected coefficients appear in parentheses. When corrected for the evolution effect, becomes 1.12 in the -band and 0.95 in the -band, while remains nearly constant in both bands. Although the bandpass used in Yang et al. (2008) differs slightly from the SDSS -band and -band, our E+A FP obtained from the orthogonal fit agrees well with that of Yang et al. (2008) within the uncertainties regardless of whether the evolution effect is corrected or not. The E+A FP calculated by the direct fitting method is
in the -band and the -band, respectively.
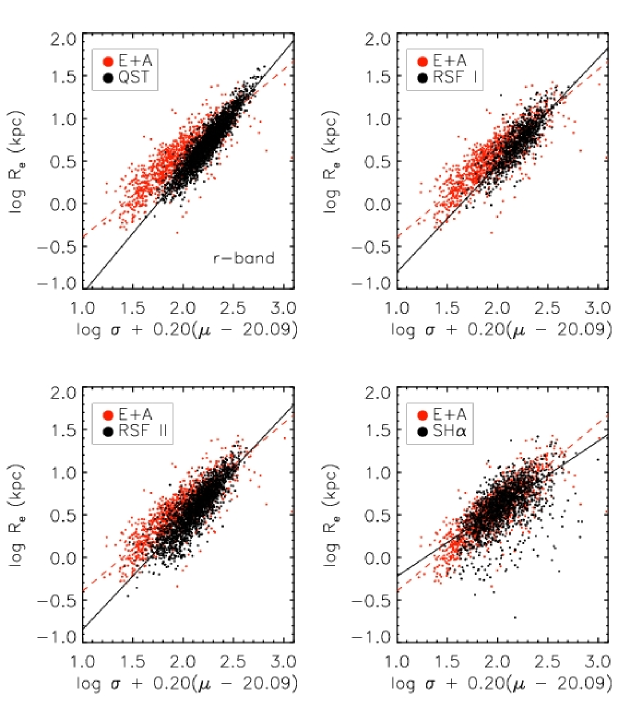
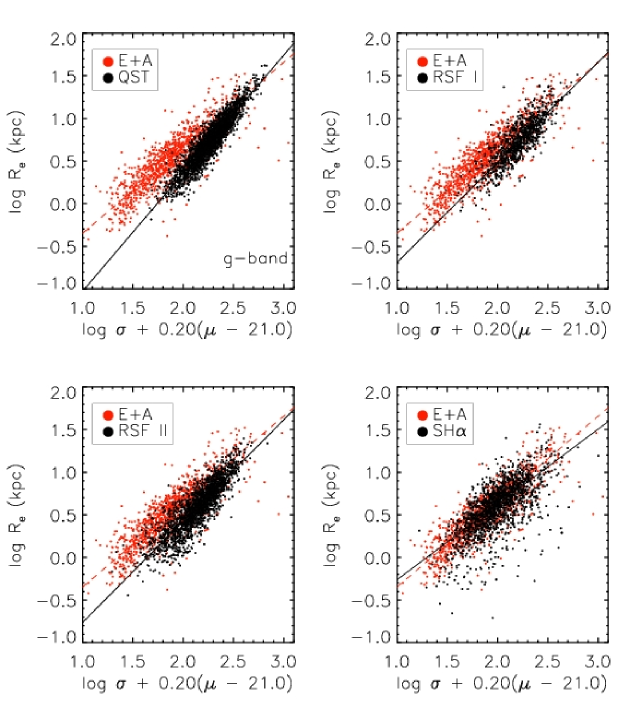
Figures 6 and 7 show the distribution of E+A on the edge-on view of the virial plane, as compared to four other types of galaxies; QST, RSF I, RSF II, and SH. The differences between E+A and the other three types of galaxies are more clearly seen in the -band (see Fig. 7), which is more sensitive to the presence of young stars than the -band. The comparison shows that E+A lies on a plane that is different from those of QST, RSF I, and RSF II in terms of slope, position, and scatter. As mentioned in Section 3.1, the coefficients obtained from the direct fitting method are used when comparing the FP slopes. It is evident that E+A is absent in the upper right part and more extended toward the lower left part of the edge-on projection. Among the four types of galaxies, the QST FP is the most distinct from the E+A FP, both in slope and in scatter. The FP slope of E+A corresponds to 60 per cent of the QST slope in both the -band and the -band, and the rms scatter (i.e. the thickness) of the E+A FP is nearly three times greater than that of the QST FP. In terms of position, the E+A FP extends more toward the lower left part as compared to the QST FP. Comparing RSF I to E+A, we find a similar slope, but a significantly different position. RSF I is distributed over a narrow range, whereas E+A occupies a relatively long and broad region on the edge-on projection of the virial plane. On the contrary, RSF II is similar to E+A in both the slope and position. The SH FP shows a stronger similarity to that of E+A with slightly larger (1.15 times) scatter. The scatter around the SH FP is the largest, and the scatter of the E+A, RSF I / II, and QST follow it in the order.
3.3 Origin of the tilt and shift of the E+A Fundamental Plane
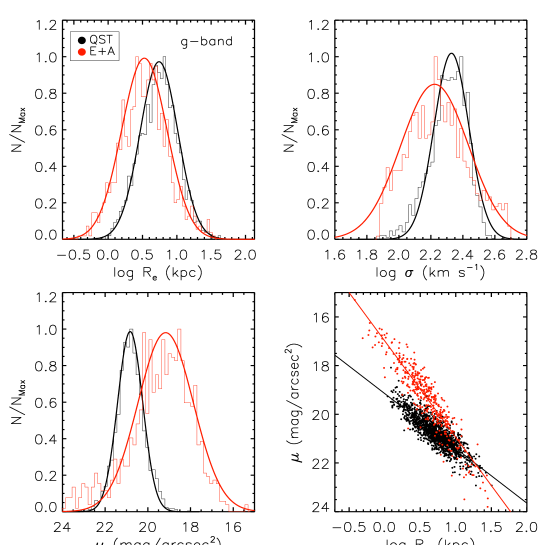
In Figure 8, we compare the distributions of three FP parameters of QST (black) and E+A (red) in order to investigate the physical cause of the shift and tilt of the E+A FP. Each distribution is normalized by its maximum value. The solid curves are the Gaussian fits to the histograms, the standard deviation and the mean of which are summarized in Table 3. Compared to QST, E+A has smaller means and larger standard deviations in all parameters of interest. The smaller effective radius and more luminous surface brightness (i.e. smaller value) of E+A are likely due to centrally concentrated star formation (Caldwell et al., 1999). A Starburst in the galaxy centre increases the central luminosity, leading to both a decreased effective radius and increased mean surface brightness within the effective radius (left panels of Fig. 8). As a consequence, E+A migrates toward the lower left corner of the virial plane projection, as compared to QST (see Fig. 6 and Fig. 7). The smaller velocity dispersion of E+A is also involved in the shift of the E+A FP. According to the downsizing scenario, less massive galaxies have experienced more active star formation in the recent epoch, and so one would expect E+A to be less massive and thus have a smaller velocity dispersion than QST.
| log | log | log + 0.2 | ||
|---|---|---|---|---|
| mean std | mean std | mean std | mean std | |
| QST | 0.740 0.274 | 2.328 0.109 | 20.828 0.589 | 6.480 0.182 |
| RSF I | 0.743 0.248 | 2.187 0.148 | 21.153 0.758 | 6.417 0.182 |
| RSF II | 0.608 0.296 | 2.219 0.147 | 20.756 0.774 | 6.365 0.206 |
| SH | 0.614 0.262 | 2.125 0.169 | 20.138 0.806 | 6.182 0.228 |
| E+A | 0.526 0.328 | 2.223 0.211 | 18.922 1.269 | 6.067 0.316 |
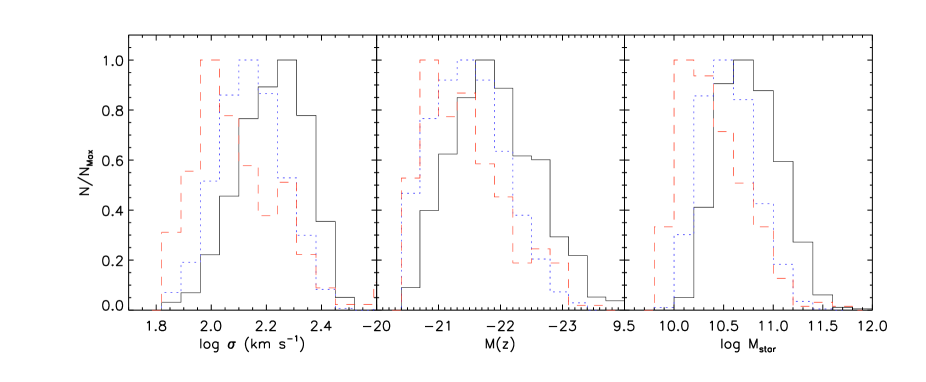
In order to test whether the smaller velocity dispersion of E+A is an intrinsic property, we construct a volume-limited sample of 0.025 0.09 and Mz –20.5. The criteria include galaxies with a wide range of luminosities and a maximum number of E+As in the sample. Figure 9 (left panel) shows that the volume-limited sample exhibits the same trends as seen in the entire E+A sample, namely, a smaller mean and lager standard deviation in the log distribution. The mean values of log are 2.228 for QST and 2.063 for E+A, with standard deviations of 0.135 and 0.192, respectively. One might argue that the velocity dispersion measurement of E+A galaxies may not be a reliable tracer of their masses. The central regions of E+As will contain young stellar populations, and ordered motion in these central regions could underestimate the velocity dispersions. Figure 9 (middle and right panels), however, show that the distributions of and stellar mass are consistent with that of the velocity dispersion of galaxies, confirming that the small log is part of the nature of E+A. Detailed mass functions of E+As are being investigated by Inami et al. (in preparation).
The lower right panel of Figure 8 shows the Kormendy relation (Kormendy, 1977), a projection of the FP. Black circles and red circles denote QST and E+A, respectively, of the same log range (2.2 log 2.4). Solid lines are the best fits of the sample. E+A follows its own scaling relation. The tendency towards a smaller and the more luminous are apparent: the E+A slope is about 2 times steeper than that of QST, which we believe is responsible for the tilt of the E+A FP. In short, both the central concentration of starbursts in E+A and its smaller velocity dispersion play an important role in the shift and the tilt of the E+A FP.
We have compared the E+A FP with the QST, RSF I/ II, and SH FPs in terms of slope, position, and scatter. We wonder whether the four types of early-type galaxies and E+A are independent or instead associated in some ways. The origin of the tilt and shift of the E+A FP is also explored by analyzing its structural and dynamical parameters. When investigating the relationship among them, the geometry of SF within E+As (i.e. the degree of central concentration) is believed to be an important key. We discuss the possible evolutionary connections among the different types of galaxies in the following section.
4 Discussion
4.1 Possible Connection between E+A and UV-excess Galaxies
The FP analysis can provide important clues to the physical links among the five different types of galaxies. We have found that there are systematic differences in position, slopes and scatter among them (see Section 3.2). We have shown that the coefficients increased systematically from SH (0.55), to E+A (0.63), to RSF I (1.03) & II (1.06), and finally to QST (1.12) in the -band. The systematic change may imply a relationship among the different types of galaxies. Our main goal here is to examine whether there are any evolutionary paths from SH to RSF I, RSF II, or QST via E+A.
We explore the distribution of the FP parameters (see Table 3). The largest mean effective radius found in RSF I, despite its relatively small mean velocity dispersion, suggests that weak ongoing star formation in RSF I is not centrally concentrated, but rather widely spread across the galaxy. The mean surface brightness of RSF I is fainter than that of QST, which also supports the possibility. RSF II, however, has a smaller effective radius and more luminous surface brightness than QST, which may lead the RSF II FP to be analogous to that of E+A. Contrary to our expectation that SH is the most similar to E+A in structural and dynamical parameters, SH has a significantly larger mean effective radius and less luminous mean surface brightness than E+A. These results indicate that the ongoing starburst in SH is not as highly concentrated as in E+A ( 75 per cent of E+As show a positive colour gradient according to Yamauchi & Goto 2005), and so the two may have significantly different RSF geometries. A sudden quench of RSF in SH would result in E+A with negative or flat colour gradients, rather than E+A with blue cores or positive colour gradients.
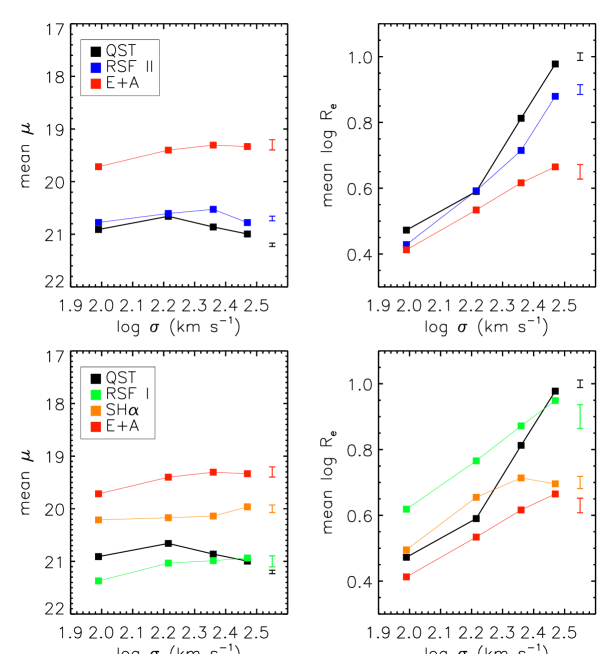
Figure 10 compares the mean surface brightness and the mean effective radius of each galaxy type in the same log bins. We break , 70 km s-1 to 330 km s-1, into four bins of size 65 km s-1: 70 135, 135 200, 200 265, and 265 330 km s-1. They correspond approximately to log 1.85, 2.13, 2.30, 2.43, and 2.52. The bin size of 65 km s-1 is determined in order to generate a fair number of log bins while retaining statistically meaningful number of galaxies in each bin. For clarity, we plot QST, RSF II, and E+A in the upper panels and QST, RSF I, SH, and E+A in the lower panels. The short vertical error bars denote the estimated uncertainties based on the bootstrap method. In left panels in Figure 10, we compare the mean surface brightness. RSF II, E+A, and SH are more luminous than QST. RSF I, however, shows less luminous mean surface brightness than QST in the first three bins. The same trend is observed for the mean surface brightness of RSF II and E+A: an increase in the first three bins followed by a decrease in the last bin. Unlike RSF II and E+A, the mean surface brightness of SH remains roughly constant with log in the first three bins and increases in the last bin. The right panels in Fig. 10 show that RSF II and E+A have a smaller mean effective radius than QST in all bins, whereas the mean effective radius of RSF I and even SH are larger than that of QST in some bins.
We found no evidence for connection of RSF I or SH to E+A in this analysis. It is now clear that even though SH is found in a very similar region to the E+A FP, there is no evidence supporting their connection. Although both RSF I and SH show signs of ongoing star formation, it is hard to link them without exact information regarding star formation histories. The residual star formation in the outskirt of a galaxy can persist after the extinction of central starburst (due to the gas exhaustion and/or the AGN feedback). In this process, SH could turn into RSF I. Or, it might be that RSF I galaxies are ones that somehow undergo star formation across the entire galaxy. In this case, RSF I may or may not be related to SH. In order to understand what causes the RSF I population, we plan to investigate SH and ultra-luminous infrared galaxies (ULIRGs) in the forthcoming paper (Bae et al., in preparation).
RSF II displays similar trends to E+A in both mean surface brightness and mean effective radius, and the two structural parameters of RSF II fall between those of E+A and QST. These results indicate that the star formation geometry of RSF II is also concentrated in the central region as often observed in E+A, even if the influence of the young stellar population is weaker compared to E+A. A detailed investigation of the physical geometry of RSF activity and its impact on the Scaling Relations will be presented in Choi et al. (in preparation).
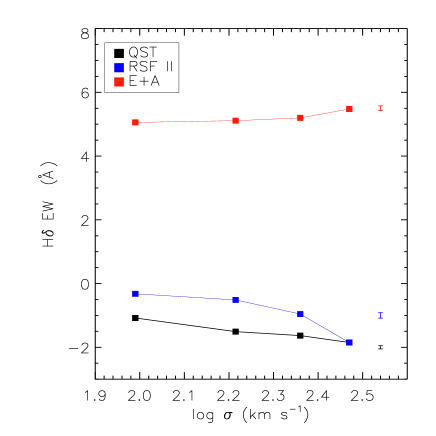
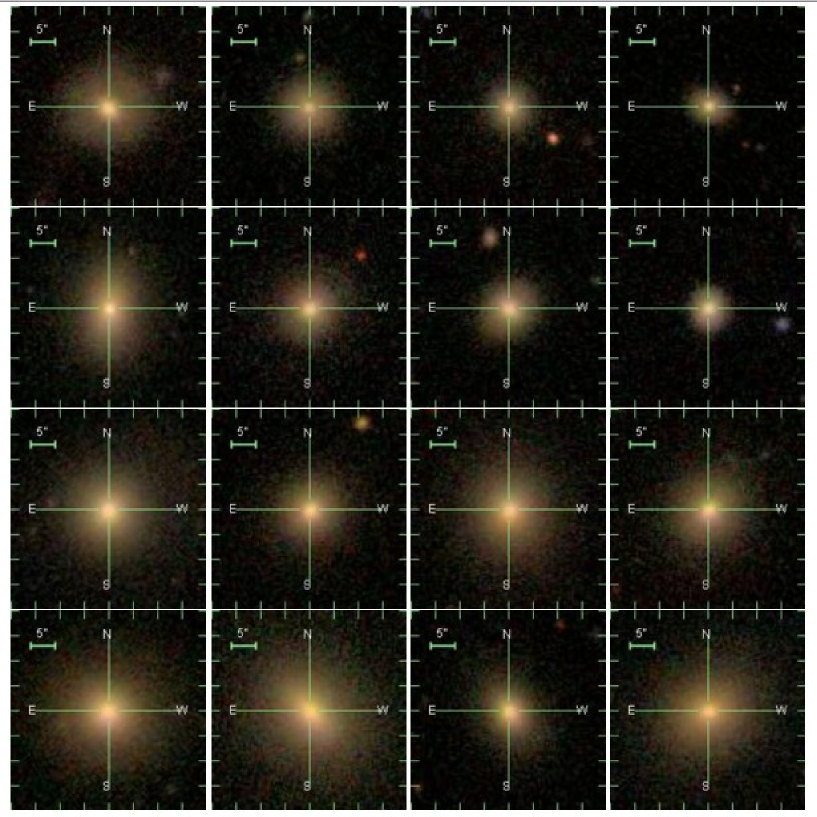
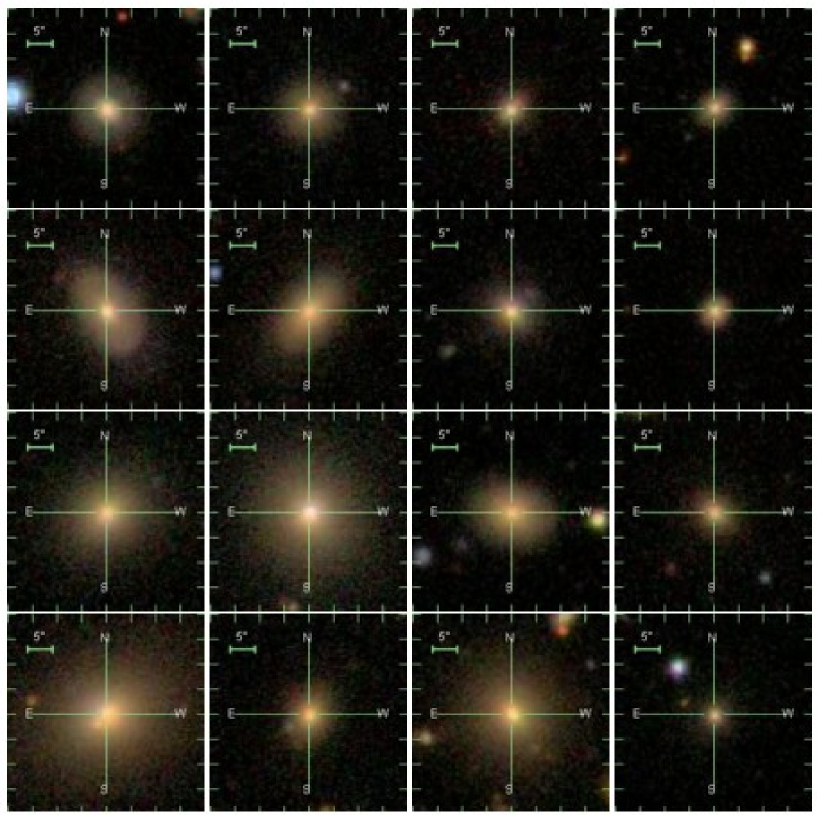
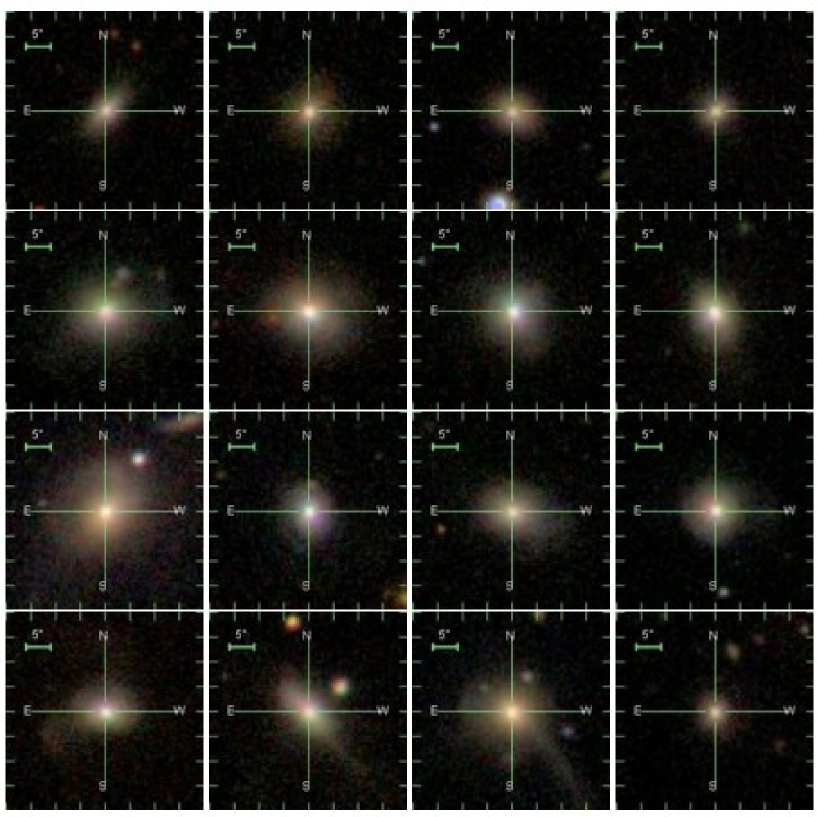
Comparisons of the FPs and their parameters for the five types of galaxies suggest that RSF II may have a more intimate link to E+A than other types. The Balmer absorption strengths can reveal a possible transition between E+A and QST via RSF II. Figure 11 presents the mean H EW at each log bin for RSF II, QST, and E+A. The mean uncertainty of each type (vertical error bars), estimated by the bootstrap method, is as small as the symbol size. As inferred from Figure 3, H EW of RSF II is in between those of QST and E+A, supporting possible links between RSF II and E+A. Independently, another useful sanity check on their association comes from visual inspection of the E+A galaxies. If there is a connection between E+A and QST classes via the RSF II category, then there should be morphological similarities which might not be picked up by the FP parameters. Figures 12, 13, and 14 compare the SDSS images of each class in four different sigma bins. It is apparent from the figure that the E+A galaxies do look bulge-dominated and show similarities to QST and RSF II classes. This is also consistent with RSF II being linked to E+A.
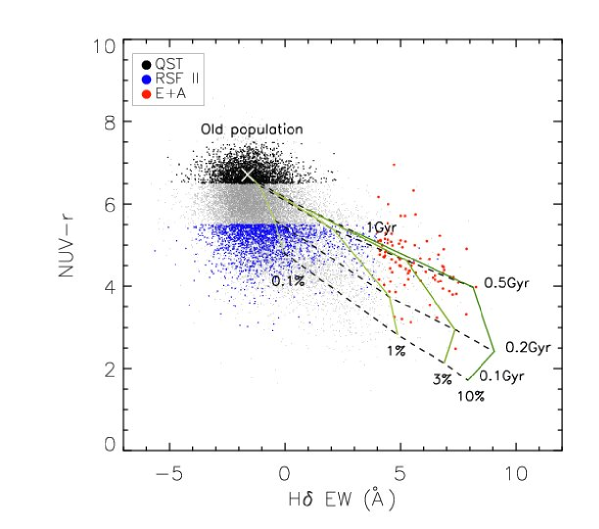
Figure 15 shows possible evolutionary paths from E+A to QST via RSF II by using a stellar population model (Bruzual & Charlot, 2003). We combine a representative old population (the median values of observed H and of QST; large cross) with a young population of solar metallicity ( = 0.02). The stellar population model grids with added young population fractions of = 0.1, 1, 3, and 10 per cent are plotted for the different ages of = 0.1, 0.2, 0.5, and 1 Gyr at fixed metallicity of = 0.02, as indicated by the labels. The stellar population models provide two reasonable explanations for the relationship among QST, RSF II, and E+A. If the star formation activities were quenched quite a while ago, RSF II can be considered as the results of passively evolved E+A (“the old E+As”). However, if star formation was weak, RSF II represents a minor version of E+A (“the mild E+As”). We here refer to RSF II as “E+a”, named after “E+A”. The new acronym represents elliptical galaxies (“E”) with a minority of A-type young stars (“a”).
Comparison of observational data with stellar population models suggests two possible ways of connections between RSF II and E+A. Although the origin of RSF II can be explained by both the “old” E+A scenario and the “mild” E+A scenario, E+A has an important property that should not be overlooked. According to Goto (2007), E+As are very rare objects in the lower-redshift Universe. In the “old” E+A scenario, even though E+As are likely to evolve into RSF II with time, there are not enough E+As to supply the entire RSF II population at any given point in time. The scenario predicts that the mass distributions of E+A, RSF II, and QST should be similar because the difference among these species lies only on the recent star formation rate. According to Figure 9, however, E+A, RSF II, and QST have a systematic difference in there masses and luminosities. These indicate that a large fraction of RSF II galaxies should be explained by the “mild” E+A scenario.
It is important to estimate the number fractions of RSF II galaxies following two different paths. In Figure 15, the stellar population model suggests that RSF II galaxies right below QST group (i.e. –3 Å H EW 2 Å) fit better into the “mild” E+A scenario. On the other hand, the rest of RSF II galaxies located at the plume-like region toward E+As are better explained by the “old” E+A scenario. Defining the old E+A regime as 2 Å (the right edge of the mild E+A group) H EW 4 Å (the left edge of the E+A region), we estimate the number of RSF II galaxies belonging to this group to be 103 ( 5 per cent) among 1,936 RSF II galaxies. We also estimate the number fraction of E+As in our sample. For a fair estimate we only consider the number of E+As with GALEX UV information and the number fractions of QST, RSF II, and E+As turn out to be 1.0 : 0.9 : 0.04. The number of E+As ( 5 per cent) is comparable to that of RSF II of the plume-like region, further supporting their “old” E+A origin. We therefore conclude that a large fraction of RSF II ( 95 per cent) should be the minor (i.e. weaker star formation) versions of E+A (i.e. mild E+A), rather than passively evolved E+A (i.e. old E+A).
5 Summary and Conclusion
The E+A galaxies may undergo the transition from ‘blue cloud’ to ‘red sequence’ and eventually migrate to red sequence early-type galaxies. An observational validation of this scenario is to identify the intervening galaxy population that smoothly bridges the E+As to red-sequence early-type galaxies. In order to investigate the possible associations between E+As and UV-excess galaxies, we have compared their Fundamental Planes. We used the largest sample of 1,021 E+As selected from the SDSS DR6 and 20,000 early-type galaxies with GALEX UV data. Based on recent star formation modes derived from colour and H emission line, we have broken early-type galaxies into QST (RSF-free), RSF I (ongoing weak SF), RSF II (post weak star formation), and SH (ongoing starburst) types. The E+A FP is different from the QST FP, and this is most likely due to a recent starburst in the central region and their intrinsically smaller velocity dispersion. Our sample indicates that RSF II galaxies underwent starbursts that were weaker than those observed in E+As (“the mild E+A scenario”) or the products of passively evolved E+As (“the old E+A scenario”). The galaxies are characterized by UV-excess but no H emission, and this is essentially a conceptual generalisation of “E+A”, in that the Balmer absorption line in the “E+A” definition is replaced with UV – optical colours that are far more sensitive to RSF than the Balmer lines. We refer to these UV-excess galaxies as “E+a” galaxies (named after “E+A”), which stands for elliptical (“E”) galaxies with a minority of A-type (“a”) young stars. We suggest that most old “E+A” galaxies represent the most recent arrivals to the red sequence.
A comparative study between E+a and E+A in terms of their preferred environment will give additional insight into their relationship. For instance, E+As are preferentially found in low-density environment in the nearby Universe and have an excess of neighbours on small scale (Goto, 2005b). A prediction from the present study is that the E+a population would also share these properties with E+As. Schawinski et al. (2007) showed that the RSF fraction is higher in the field environment, although they do not discriminate between RSF I and RSF II. Further investigation is in progress on the environment of E+a and E+A galaxies in terms of their local galaxy number density (Choi et al., in preparation).
Acknowledgments
We thank the anonymous referee for careful reading of the manuscript and the useful suggestions and comments. Y. C. acknowledges the Department of Infrared Astrophysics of Institute of Space and Astronautical Science (ISAS) for their hospitality. Especially, Y. C. is indebted to Takao Nakagawa and Kumiko Nishimatsu for their support during her visit. We thank H.Inami, H.Matsuhara, and K.Yun for useful discussion. We would like to thank Changbom Park and Yun-young Choi for providing the catalogue of morphologically-classified SDSS galaxies based on the DR4plus. Y. C. acknowledges support from the Korea Research Foundation.
T. G. acknowledges support from the Japan Society for the Promotion of Science (JSPS) through JSPS Research Fellowships for Young Scientists. This work was supported by the Sasakawa Scientific Research Grant from the Japan Science Society and by the Japan Society for the Promotion of Science through Grant-in-Aid for Scientific Research 18840047.
S.-J. Y. acknowledges support from the Basic Research Program (grant No. R01-2006-000-10716-0) and the Acceleration Research Program of the Korea Science and Engineering Foundation, and from the Korea Research Foundation Grant funded by the Korean Government (grant No. KRF-2006-331-C00134).
References
- Baldwin et al. (1981) Baldwin J., Phillips M., Terlevich R., 1981, PASP, 93, 5
- Bernardi et al. (2003a) Bernardi M. et al., 2003a, AJ, 125, 1817
- Bernardi et al. (2003b) Bernardi M. et al., 2003b, AJ, 125, 1849
- Bernardi et al. (2003c) Bernardi M. et al., 2003c, AJ, 125, 1866
- Blake et al. (2004) Blake C. et al., 2004, MNRAS, 355, 713
- Blanton et al. (2003) Blanton M. R. et al., 2003, AJ, 125, 2348
- Bruzual & Charlot (2003) Bruzual G., Charlot S., 2003, MNRAS, 344, 1000
- Bryd & Valtonen (1990) Bryd G., Valtonen M., 1990, ApJ, 350, 89
- Burstein et al. (1988) Burstein D., Bertola F., Buson L. M., Faber S. M., Lauer T. R., 1988, ApJ, 328, 440
- Caldwell et al. (1999) Caldwell N., Rose J. A., Dendy K., 1999, AJ, 117, 140
- Colless et al. (2001) Colless M., Saglia R. P., Burstein D., Davies R. L., McMahan R. K.,Wegner G., 2001, MNRAS, 321, 277
- Choi et al. (2007) Choi Y.-Y., Park C., Vogeley M., 2007, ApJ, 658, 884
- Couch & Sharples (1987) Couch W. J., Sharples R. M., 1987, MNRAS, 229, 423
- de Vaucouleurs (1948) de Vaucouleurs G., 1948, Ann.d’Astrophys., 11, 247
- Djorgovski & Davis (1987) Djorgovski S. G., Davis M., 1987, ApJ, 313, 59
- Donas et al. (2007) Donas J. et al., 2007, ApJS, 173, 597
- D’Onofrio et al. (2008) D’Onofiro M. et al., 2008, ApJ, 685, 875
- Dressler et al. (1987) Dressler A., Lynden-Bell D., Berstein D., Davies R. L., Faber S. M., Terlevich R., Wenger G., 1987, ApJ, 313, 42
- Dressler & Gunn (1983) Dressler A., Gunn J. E., 1983, ApJ, 270, 7
- Fujita & Goto (2004) Fujita Y., Goto T., 2004, PASJ, 56, 621
- Galaz (2000) Galaz G., 2000, AJ, 119, 2118
- Genzel et al. (2001) Genzel R., Tacconi L. J., Rigopoulou D., Lutz D., Texza M., 2001, ApJ, 563, 527
- Goto (2007) Goto T., 2007, MNRAS, 381, 187
- Goto (2005a) Goto T., 2005a, MNRAS, 356, L6
- Goto (2005b) Goto T., 2005b, MNRAS, 357, 937
- Goto (2004) Goto T., 2004, A&A, 427, 125
- Gunn & Gott (1972) Gunn J. E., Gott J. R. I., 1972, ApJ, 176, 1
- Jrgensen et al. (1996) Jrgensen I., Franx M., Kjaergaard P., 1996, MNRAS, 280, 167
- Jrgensen et al. (1995) Jrgensen I., Franx M., Kjaergaard P., 1995, MNRAS, 273, 1097
- Kaviraj et al. (2007a) Kaviraj S., Kirkby L. A., Silk J., Sarzi M., 2007a, MNRAS, 382, 960
- Kaviraj et al. (2007b) Kaviraj S. et al., 2007b, ApJS, 173, 619
- Kewley et al. (2001) Kewley L. J., Dopita M. A., Sutherland R. S., Heisler C. A., Trevena J., 2001, ApJ, 556, 121
- Kormendy (1977) Kormendy J., 1977, ApJ, 218, 333
- La Barbera et al. (2000) La Barbera F., Busarello G., Capacciolo M., 2000, A&A, 362, 851
- Lee et al. (2007) Lee J. H., Lee M. G., Kim T., Hwang H. S., Park C., Choi Y.-Y., 2007, ApJ, 663, L69
- Lee et al. (2005) Lee Y.-W. et al., 2005, ApJ, 619, L103
- Liu et al. (2007) Liu C. T., Hooper E. J., O’Neil K., Thompson D., Wolf M., Lisker T., 2007, ApJ, 658, 249
- Miller & Owen (2001) Miller N. A., Owen F. N., 2001, ApJ, 554, L25
- Moore et al. (1996) Moore B., Katz N., Lake G., Dressler A., Oemler A., 1996, Natur, 379, 613
- Pahre et al. (1998) Pahre M. A., De Carvalho R. R., Djorgovski S. G., 1998, AJ, 116,1606
- Park & Choi (2005) Park C., Choi Y.-Y., 2005, ApJ, 635, L29
- Poggianti & Wu (2000) Poggianti B. M., Wu H., 2000, ApJ, 529, 157
- Poggianti et al. (1999) Poggianti B. M. et al., 1999, ApJ, 518, 576
- Ree et al. (2007) Ree C. H. et al., 2007, ApJS, 173, 607
- Saglia et al. (2001) Saglia R. P., Colless M., Burstein D., Davies R. L., McMahan R. K., Jr, Wegner G., 2001, MNRAS, 324, 389
- Salim et al. (2005) Salim S. et al., 2005, ApJ, 619, L39
- Schawinski et al. (2007) Schawinski K., Kaviraj S., Khochfar S., Yoon S.-J., Yi S. K. et al., 2007, ApJS, 173, 512
- Scodeggio et al. (1998) Scodeggio M., Gavazzi Z., Belsole E., Pierini D., Boselli A., 1998, MNRAS, 301, 1001
- Smail et al. (1999) Smail I., Morrison G., Gray M. E., Owen F. N., Ivison R. J., Kneib J.-P., Ellis R. S., 1999, ApJ, 525, 609
- Spitzer & Baade (1951) Spitzer L. J., Baade W., 1951, ApJ, 113, 413
- Tacconi et al. (2002) Tacconi L. J., Genzel R., Rigopoulou D., Baker A. J., Iserlohe C., Texza M., 2002, ApJ, 580, 73
- Tolman (1930) Tolman R. C., 1930, Proc. Natl. Acad. Sci., 16, 511
- Tran et al. (2004) Tran K.-V. H., Franx M., Illingworth G. D., van Dokkum P., Kelson D. D., Magee D., 2004, ApJ, 609, 683
- Yamauchi & Goto (2005) Yamauchi C., Goto T., 2005, MNRAS, 359, 1557
- Yang et al. (2004) Yang Y., Zabludoff A. I., Zaritsky D., Lauer T. R., Mihos J. C., 2004, ApJ, 607, 258
- Yang et al. (2008) Yang Y., Zabludoff A. I., Zaritsky D., Mihos J. C., 2008, ApJ, 688, 945
- Yi et al. (2005) Yi S. K. et al., 2005, ApJ, 619, L111
- Yoon et al. (2004a) Yoon S.-J. et al., 2004a, BAAS, 36, 1385
- Yoon et al. (2004b) Yoon S.-J., Lee Y.-W., Rey S.-C., Ree C., Yi S. K., 2004b, Ap&SS, 291, 223
- Zabludoff et al. (1996) Zabludoff A. I. et al., 1996, ApJ, 466, 104