Reverse-engineering transcriptional modules from gene expression data
Abstract
“Module networks” are a framework to learn gene regulatory networks from expression data using a probabilistic model in which coregulated genes share the same parameters and conditional distributions. We present a method to infer ensembles of such networks and an averaging procedure to extract the statistically most significant modules and their regulators. We show that the inferred probabilistic models extend beyond the data set used to learn the models.
I Introduction
Methods for reverse-engineering transcription regulatory networks from high-throughput microarray data come in many different flavors [1, 2, 3, 4, 5]. An important class of methods are those which not only seek to identify the topological wiring of the network [6, 7, 8], but also attempt to infer a model of the biological system which explains the observed gene expression patterns and generates testable hypotheses. Such models can take the form of probabilistic graphical models [9, 1, 10], simplified kinetic equation models [11], or biophysical models [5]. A common property of all modeling approaches is that the number of parameters is much larger than the number of experimental data points available to define them. Dimensionality reduction is usually achieved by a coarse-graining step which collapses individual genes into clusters of coexpressed genes or modules, where all genes in a cluster share the same model parameters [12]. This conceptual simplification has as a drawback that inferred interactions are influenced by the module quality. Moreover, it is hard to translate the concept of a biological module in a strict mathematical definition. When searching for modules, often many local optima exist with partially overlapping modules differing from each other in a few genes or conditions. Therefore, in our approach we exploit the “fuzzy” property of a module to increase the reliability of the predicted interactions. Instead of reporting only one cluster solution (local optimum), we use a stochastic approach to generate many partially redundant cluster solutions (bootstrapping) and generate an ensemble solution by averaging over multiple high-scoring models. Crucial for the success of the ensemble approach is the availability of an efficient method for sampling a large number of different models covering the whole search space of possible models [13]. Therefore we use the deterministic approach of [14] as a basis for our sampling method. In this approach gene and condition clustering are decoupled from learning the regulatory programs compared to the original method of [9] which optimizes both simultaneously. This allows for a higher efficiency while maintaining an equal performance rate [14]. Several extensions of the method of [9] infer transcriptional modules from gene expression and genome wide location analyis [15, 16, 17, 18]. It is entirely feasible to develop ensemble strategies for these methods as we did for [9]. This constitutes an interesting line of future research. In this paper we give a brief description of the algorithm and highlight some results for an expression compendium for E. coli [8]. A complete analysis of this data set and comparison of our approach to the mutual information based CLR method [8] is given in [19]. A detailed comparison between the ensemble approach and the direct-optimization based method of [9] on S. cerevisiae data is given in [20].
II Results and discussion
II.1 The algorithm
The algorithm takes as input a gene expression data set and a list of candidate regulators. It gives as output a large number of probabilistic models consisting of a set of gene clusters, with for each gene cluster a partition of the experiments and a probabilistic regulatory program explaining the observed experiment partitions in terms of the expression of a small number of regulators. The number of gene and experiment clusters is determined automatically and can vary from one solution to the next. Using overrepresentation in the ensemble, the most probable interactions can be identified. The regulatory programs can be validated on new experimental data and generate testable hypotheses about conditional regulation of the inferred gene clusters.

The first step of the algorithm consists of generating an ensemble of gene clusters with experiment partitions. A Gibbs sampling method iteratively updates the assignment of each gene given the current gene and experiment clusters, and the assignment of each experiment in each gene cluster given the current assignment of all other experiments in that gene cluster, iterating until a stationary state is reached. Details about the Gibbs sampler algorithm and a complete analysis of its convergence properties can be found in [21]. Briefly, in a single run, the Gibbs sampler reaches a local optimum in the direction of genes, but covers the whole search space in the direction of experiments. This implies that for a given cluster of coexpressed genes there are multiple equiprobable ways of partitioning the experiments. To also sample from the whole search space in the direction of genes, we perform several independent Gibbs sampler runs with random restarts. In [21], it is shown that each of the local optima in the direction of genes is (approximately) of the same height, and therefore equally important, and that a relatively small number of local optima is sufficient to cover the whole search space (typically two distinct sets of 10 local optima for a data set of 1000 genes agree for 95% on the probability for each pair of genes to be clustered together, see [21] for details). A graphical cartoon representation of the Gibbs sampling procedure is given in Figure 1.
In the second step of the algorithm, regulatory programs are learned for each experiment partition for each gene cluster. This is achieved by linking the sets in the experiment partition hierarchically in a decision tree. For each split in this tree a candidate regulator is found whose expression is significantly different on both sides of the split, as measured by an entropy measure. Details can be found in [14].

A gene cluster with a regulatory program is called a transcriptional module and a partition of all genes into clusters, each with a regulatory program, a module network. A sample module is shown in Figure 2. To each module network corresponds a probabilistic model defined by a probability density function with the continuous valued expression level of gene (see Methods). The value of measures how well the model explains a particular experiment with expression levels for all genes.
II.2 Ensemble averaging
We have applied the algorithm on a compendium of Affymetrix microarrays for E. coli [8]. The compendium contains 445 expression profiles for 4345 genes under 189 different stress conditions and genetic perturbations. The results are validated by comparison with existing knowledge of transcriptional interactions in RegulonDB [22] and EcoCyc [23]. A complete analysis of the inferred module networks and their biological significance is beyond the scope of this paper and will be given elsewhere [19]. Here we highlight a few examples of inferred interactions which are representative for the working mechanism of the ensemble approach.
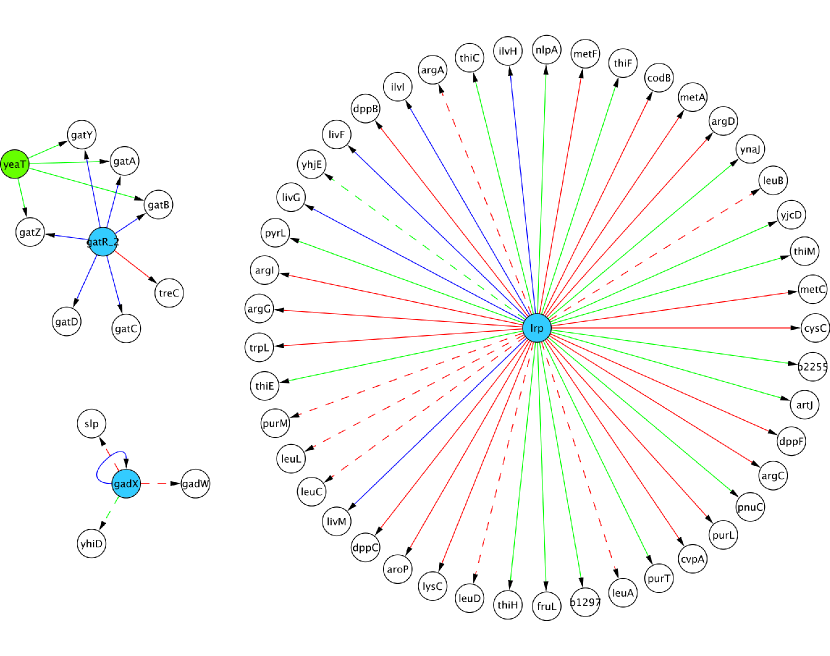
A first example is given by the gatYZABCD operon (involved in galactitol metabolism). As expected the genes in this operon consistently cluster together. GatR_2, a subunit of the GatR transcriptional repressor, is consistently assigned as a candidate regulator. It is known that GatR negatively controls transcription initiation of the gatYZABCD operon, which is the only known target of GatR according to RegulonDB. The many local optima, generated by the Gibbs sampling approach resulted in 81 additional genes which were clustered at least once with one of the gatYZABCD genes. Except for one potential new target treC which was found repeatedly in combination with gatC and gatD, the interactions between the remaining 80 genes and GatR were not sufficiently significant to be retained in the final solution. This illustrates how the ensemble approach guarantees an effective filtering of false positives while retaining the true positives. This example also illustrates how combinatorial regulation can be detected. For gatY, gatZ, gatA and gatB, a second regulator, YeaT (a predicted regulator involved in malate metabolism), with an anticorrelated expression pattern seemed to play a role in a subset of the conditions (see Figure 2).
Four interactions could be inferred for GadX (a transcriptional activator involved in acid resistance) : GadX itself, which makes sense as it is known to be autoregulated [24], and three novel targets slp, gadW and yhiD. This finding is supported by literature, as the expression of both slp [25] and yhiD [25] seemed to be affected in a gadX mutant, while gadX and gadW seem to tightly control each other’s expression [26].
For Lrp (a regulator involved in the high-affinity transport of branched-chain amino acids and a mediator of the leucine response) 44 interactions could be found of which 5 could be confirmed by RegulonDB (ilvI, ilvH, livG, livM and livN) and 39 were new. Among the predicted interactions with Lrp we found the leuLABCD genes. According to literature, the Lrp dependent regulation of the leuLABCD operon is only indirect [27]. However, without additional data, no distinction can be made between direct and indirect effects of a regulator if both give rise to a correlated expression level with the targets. Four of our predicted targets (purM, argA, yhjE and aroP) were tested by ChIP analysis [8] and three (purM, argA and yhjE) were confirmed. YhjE was also found to be differentially expressed in a microarray analysis of lrp mutants [28]. For the remaining genes no clear indication for their regulation by Lrp could be found. However, it should be noted that Lrp not only acts as a regulator, binding specific DNA-sequences, but also functions as a DNA-organizing protein, extending its global role in regulation [29, 30]. A large regulon of Lrp, as was detected by our method, thus is in line with this more global role of Lrp.
II.3 Model evaluation
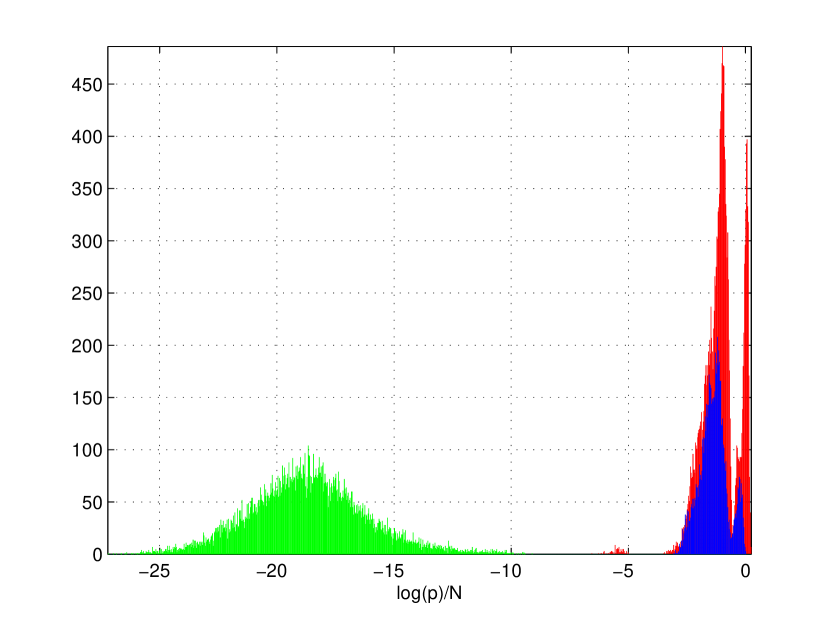
One of the purposes of model-based reverse-engineering methods is to infer a model of the system which extends beyond the data set used to learn the model. As such they can form the basis for developing methods which use new data to refine and extend a partially validated model, rather than infer a completely new network model each time a data set is updated. Validation of a model is done by comparing the distribution of (see Methods) for new data with the distribution for data used to learn the model. In general, higher values of means better explanation of the data by the model. The result of this comparison for 75 experiments recently added to the database [8] with the 189 original experiments, for 100 module network models selected at random from the ensemble, is shown in Figure 4. The overlap between the distributions shows that the probabilistic models indeed generalize to unseen data. For comparison we also perform a randomization test by permuting the gene indices of the data matrix. As expected, the evaluation of the models on randomized data is several orders of magnitude smaller than on real data, and in fact around 15% of the randomized experiments have a value , i.e., zero likelihood.
III Methods
III.1 Data sets
We downloaded a compendium of expression profiles for E. coli [8] and a list of candidate regulators from http://gardnerlab.bu.edu/netinfer_plos_2007/. We averaged over replicate experiments to obtain a data matrix of 4345 genes and 189 experiments. Additional data for 4292 genes and 75 experiments for validation of the probabilistic models was downloaded from http://m3d.bu.edu/norm/.
III.2 Probabilistic model evaluation
The probabilistic model introduced in [9] associates to each gene a continuous valued random variable measuring the gene’s expression level. The distribution of depends on the expression level of a set of parent genes chosen from a list of candidate regulators. Genes regulated by the same parents form a cluster and share the same model parameters. The joint probability distribution for the expression levels of all genes decomposes as a product of conditional distributions,
| (1) |
where is the set of clusters (i.e., a partition of the gene set ), and is the set of regulators for cluster . The distribution (1) is normalized if the network from parents to children is acyclic. The conditional distribution of the expression level of the genes in cluster is a normal distribution with parameters determined by the expression levels of the parents :
| (2) |
The parameters and are determined by arranging the parents in a decision tree. The tests on the nodes of the decision tree are of the form ‘ ?’ for some threshold value , where is the expression value of the parent associated to the node. The leaves of the decision tree are the sets of an experiment partition for cluster and and are the mean, resp. precision of the expression levels of the genes in the cluster in this subset of experiments. See [14] for more details.
To evaluate a model of the form (1), we are only interested in genes for which the model makes actual predicitions, i.e., genes belonging to clusters with a regulation tree. If the clustering procedure does not find distinct experiment clusters for a certain gene cluster, the model predicts one broad normal distribution for the genes in this cluster. Any expression data for these genes will fit the model and thereby obscure the signal of the genes for which true predictions are made. For the particular data used in Section II.3, the number of genes in the new data set is 4292 vs. 4345 in the data used to learn the models. Six of the missing genes belong to the regulator list for the learned models. Hence in some models we may not be able to compute the conditional probability distributions for all genes. Altogether around 2700 genes remain for each model.
III.3 Software availability
The Java software package LeMoNe for learning module networks is available from our website http://bioinformatics.psb.ugent.be/software/details/LeMoNe.
Acknowledgements.
RDS is a research assistant of the IWT. AJ is supported by an Early-Stage Marie Curie Fellowship. This work is supported by 1) Research Council KUL: GOA AMBioRICS,GOA/08/011, CoE EF/05/007 SymBioSys, 2) FWO: projects G.0318.05, 3) IWT: SBO-BioFrame, 4) IUAP P6/25 (BioMaGNet).References
- [1] N Friedman. Inferring cellular networks using probabilistic graphical models. Science, 308:799–805, 2004.
- [2] T S Gardner and J J Faith. Reverse-engineering transcription control networks. Phys Life Rev, 2:65–88, 2005.
- [3] K Lemmens, T Dhollander, T De Bie, P Monsieurs, K Engelen, B Smets, J Winderickx, B De Moor, and K Marchal. Inferring transcriptional modules from ChIP-chip, motif and microarray data. Genome Biol, 7:R37, 2006.
- [4] M Bansal, V Belcastro, A Ambesi-Impiombato, and D di Bernardo. How to infer gene networks from expression profiles. Mol Syst Biol, 3:78, 2007.
- [5] H J Bussemaker, B C Foat, and L D Ward. Predictive modeling of genome-wide mRNA expression: from modules to molecules. Annu Rev Biophys Biomol Struct, 36:329–347, 2007.
- [6] AJ Butte and IS Kohane. Mutual information relevance networks: Functional genomic clustering using pairwise entropy measurements. Pac Symp Biocomputing, 5:415–426, 2000.
- [7] K Basso, A A Margolin, G Stolovitzky, U Klein, R Dalla-Favera, and A Califano. Reverse engineering of regulatory networks in human b cells. Nat Genet, 37:382–390, 2005.
- [8] J J Faith, B Hayete, J T Thaden, I Mogno, J Wierzbowski, G Cottarel, S Kasif, J J Collins, and T S Gardner. Large-scale mapping and validation of Escherichia coli transcriptional regulation from a compendium of expression profiles. PLoS Biol, 5:e8, 2007.
- [9] E Segal, M Shapira, A Regev, D Pe’er, D Botstein, D Koller, and N Friedman. Module networks: identifying regulatory modules and their condition-specific regulators from gene expression data. Nat Genet, 34:166–167, 2003.
- [10] M A Beer and S Tavazoie. Predicting gene expression from sequence. Cell, 117:185–198, 2004.
- [11] R Bonneau, D J Reiss, P Shannon, M Facciotti, L Hood, N S Baliga, and V Thorsson. The Inferelator: an algorithm for learning parsimonious regulatory networks from systems-biology data sets de novo. Genome Biol, 7:R36, 2006.
- [12] T Van den Bulcke, K Lemmens, Y Van de Peer, and K Marchal. Inferring transcriptional networks by mining ‘omics’ data. Current Bioinformatics, 1:301–313, 2006.
- [13] T G Dietterich. Machine learning research: four current directions. AI Magazine, 18(4):97–136, 1997.
- [14] T Michoel, S Maere, E Bonnet, A Joshi, Y Saeys, T Van den Bulcke, K Van Leemput, P van Remortel, M Kuiper, K Marchal, and Y Van de Peer. Validating module networks learning algorithms using simulated data. BMC Bioinformatics, 8:S5, 2007.
- [15] Z. Bar-Joseph, G.K. Gerber, T.I. Lee, N.J. Rinaldi, J.Y. Yoo, F. Robert, D.B. Gordon, E. Fraenkel, T.S. Jaakkola, R.A. Young, and D.K. Gifford. Computational discovery of gene modules and regulatory networks. Nat. Biotechnol., 21:1337–1342, Nov 2003.
- [16] X Xu, L Wang, and D Ding. Learning module networks from genome-wide location and expression data. FEBS Lett, 578:297–304, 2004.
- [17] F Gao, B C Foat, and H J Bussemaker. Defining transcriptional networks through integrative modeling of mrna expression and transcription factor binding data. BMC Bioinformatics, 5:31, 2004.
- [18] W-S Wu, W-H Li, and B-S Chen. Computational reconstruction of transcription regulatory modules of the yeast cell cycle. BMC Bioinformatics, 7:421, 2006.
- [19] T Michoel, R De Smet, A Joshi, Y Van de Peer, and K Marchal. Topological and evolutionary characterization of Escherichia coli transcriptional modules inferred from expression data. Submitted, 2008.
- [20] A Joshi, R De Smet, K Marchal, Y Van de Peer, and T Michoel. Module networks revisited: computational assessment and prioritization of model predictions. Bioinformatics (to appear), 2009.
- [21] A Joshi, Y Van de Peer, and T Michoel. Analysis of a Gibbs sampler for model based clustering of gene expression data. Bioinformatics, 24(2):176–183, 2008.
- [22] H Salgado, S Gama-Castro, M Peralta-Gil, E Diaz-Peredo, F Sanchez-Solano, A Santos-Zavaleta, I Martinez-Flores, V Jimenez-Jacinto, C Bonavides-Martinez, J Segura-Salazar, A Martinez-Antonio, and J Collado-Vides. RegulonDB (version 5.0): Escherichia coli K-12 transcriptional regulatory network, operon organization, and growth conditions. Nucleic Acids Res, 34:D394–397, 2006.
- [23] I M Keseler, J Collado-Vides, S Gama-Castro, J Ingraham, S Paley, I T Paulsen, M Peralta-Gil, and P D Karp. EcoCyc: a comprehensive database resource for Escherichia coli. Nucleic Acids Res, 33(Database issue):334–337, 2005.
- [24] A Tramonti, P Visca, M De Canio, M Falconi, and D De Biase. Functional characterization and regulation of gadX, a gene encoding an AraC/XylS-like transcriptional activator of the Escherichia coli glutamic acid decarboxylase system. J Bacteriol, 184(10):2603–2613, 2002.
- [25] D L Tucker, N Tucker, Z Ma, J W Foster, R L Miranda, P S Cohen, and T Conway. Genes of the GadX-GadW regulon in Escherichia coli. J Bacteriol, 185(10):3190–3201, 2003.
- [26] J W Foster. Escherichia coli acid resistance: tales of an amateur acidophile. Nat Rev Microbiol, 2(11):898–907, 2004.
- [27] J R Landgraf, J A Boxer, and J M Calvo. Escherichia coli Lrp (leucine-responsive regulatory protein) does not directly regulate expression of the leu operon promoter. J Bacteriol, 181(20):6547–6551, 1999.
- [28] S Hung, P Baldi, and G W Hatfield. Global gene expression profiling in Escherichia coli K12. The effects of leucine-responsive regulatory protein. J Biol Chem, 277(43):40309–40323, 2002.
- [29] S N Peterson, F W Dahlquist, and N O Reich. The role of high affinity non-specific DNA binding by Lrp in transcriptional regulation and DNA organization. J Mol Biol, 369(5):1307–1317, 2007.
- [30] U Pul, R Wurm, and R Wagner. The role of LRP and H-NS in transcription regulation: involvement of synergism, allostery and macromolecular crowding. J Mol Biol, 366(3):900–915, 2007.