The active nuclei of 3CRR radio sources
Abstract
We combine Chandra and XMM-Newton X-ray data from our previous papers with new X-ray observations and with Spitzer mid-infrared data in order to study the nature of the nuclei of radio galaxies and radio-loud quasars with from the 3CRR sample. The significant increase in sample size over our previous work, the reduction of bias in the sample as a result of new observations, and the availability of more mid-infrared data allow us to show conclusively that almost all objects classed as low-excitation radio galaxies in optical spectroscopic studies lack a radiatively efficient active nucleus. We show that the distribution of absorbing columns in the narrow-line radio galaxies differs from the population of X-ray-selected radio-quiet type-2 quasars and from that in local Seyfert 2s. We comment on the current evidence for the nature of the soft X-ray component in radio-galaxy nuclear spectra, concluding that a jet origin for this component is very hard to evade. Finally, we discuss the recently discovered ‘fundamental plane’ of black hole activity, showing that care must be taken when placing radio-loud AGN on such diagnostic diagrams.
keywords:
galaxies: active – X-rays: galaxies1 Introduction
The nature of the active nuclei of radio galaxies and radio-loud quasars has been a puzzle ever since large samples with optical identification and spectroscopy began to be constructed in the 1970s. Early work connected extragalactic radio sources with a bewildering variety of host objects, ranging in the local universe from recent merger remnants like the host galaxy of Centaurus A, NGC 5128, to quiescent ellipticals like M87, and in the more distant universe from undistinguished ellipticals with only stellar features in their optical spectra to the most powerful quasars known. Key steps in the understanding of this diversity included the discovery by Fanaroff & Riley (1974) that large-scale radio structure has a strong relationship to radio luminosity: their division of radio sources into centre-brightened (FRI) and edge-brightened (FRII) classes clearly encodes some important jet physics. Equally important, though far less widely cited, was the discovery by Hine & Longair (1979) that the optical emission lines from the nuclei of radio galaxy hosts could also be classified as ‘weak’ or ‘strong’, with a relationship to radio luminosity (weak-lined objects, hereafter low-excitation radio galaxies or LERGs tend to have low radio luminosity; strong-lined objects, hereafter high-excitation radio galaxies or HERGs, tend to have high radio luminosities) but, crucially, no one-to-one correspondence with the Fanaroff-Riley morphological classes.
The development of unified models, beginning with the realization that both relativistic jets (e.g. Scheuer & Readhead 1979; Orr & Browne 1982) and active nuclei (e.g. Antonucci 1982) would have different appearances depending on the orientation of the observer, and culminating in quantitative constraints on source properties through population statistics (e.g. Barthel 1989; Urry, Padovani & Stickel 1991; Padovani & Urry 1992; Hardcastle et al. 2003) greatly simplified the picture (see Antonucci 1993 and Urry & Padovani 1995 for contemporary reviews). It became clear that quasars and high-power narrow-line radio galaxies (NLRGs) were likely to be the same population, seen at different orientations, and that low-power radio galaxies, which are generally LERGs (Hine & Longair 1979) could form the parent population of the mostly lineless BL Lac objects. A tendency to think of these models respectively as ‘FRII’ and ‘FRI’ unification, after the objects which dominate the HERG and LERG populations, has confused the literature ever since, and led to much work on physical differences in the nuclei of FRI and FRII radio galaxies. In fact as Hine & Longair showed, and as has been repeatedly pointed out over the ensuing decades (e.g. Barthel 1994; Laing et al. 1994; Jackson & Rawlings 1997; Chiaberge, Capetti & Celotti 2002; Hardcastle 2004; Whysong & Antonucci 2004) there is a population of FRII radio galaxies with low-excitation optical spectra, which modellers should not ignore; in fact, such low-excitation FRIIs are required to participate in low-luminosity unified models in order to explain the numerous BL Lac objects with FRII radio structure (e.g. Rector & Stocke 2001). There are clearly also radio sources with FRI structure but high-excitation optical characteristics (e.g. the broad-line FRI radio galaxy 3C 120, or the FRI quasar of Blundell & Rawlings 2001), although such objects are rarer in radio-selected samples.
The key unanswered question is therefore not ‘what causes the differences between FRI and FRII radio structures?’ – that can be adequately explained by the interactions between jets of different powers and their environments, see e.g. Bicknell (1995) – but ‘what is the nature and the cause of the differences between the low-excitation and high-excitation active nuclei?’. This question has taken on a new urgency with the advent of large surveys which provide populations of homogeneously selected AGN, both radio-loud and radio-quiet, and show significant differences between their host galaxies and environments as a function of radio power (e.g. Best et al. 2006). Recently a consensus has started to emerge (Chiaberge et al. 2002; Whysong & Antonucci 2004; Hardcastle, Evans & Croston 2006, hereafter H06) that the LERGs in fact lack any of the conventional apparatus of an AGN – radiatively efficient accretion disc, X-ray emitting corona, and obscuring, mid-infra-red luminous torus – and that their radio through X-ray nuclear emission, and even such nuclear emission lines as are seen, can be explained purely as a result of the properties of the small-scale jet. In this picture some feature of the AGN and/or its fuel supply must account for the difference between the LERGs and the HERGs (i.e. NLRGs, broad-line radio galaxies (BLRGs) and quasars). We recently proposed (Hardcastle, Evans & Croston 2007, hereafter H07) that the low-excitation objects are those fuelled by accretion directly from the hot intergalactic medium, as is required in models in which cooling from the hot phase triggers AGN activity and re-heats the cold gas, while the high-excitation objects (where large amounts of cold gas close to the AGN are required in order to produce the observed torus and the inferred thin, radiatively efficient accretion disc) are produced by accretion of cold gas, presumably driven by interaction or mergers. We showed quantitatively that ‘hot-mode’ accretion could power nearby FRI LERGs (an aspect of the model subsequently tested in more detail by Balmaverde et al. 2008) but that it was not sufficient to power the most powerful NLRGs. The H07 model appears to be supported by studies relating the AGN properties and environments of radio sources in large surveys (e.g. Tasse et al. 2008).
However, more work remains to be done on the nature of AGN in both low- and high-excitation radio sources. To date studies that have shown evidence for radiative inefficiency in LERGs have concentrated on a single wavelength, either optical (Chiaberge et al. 2002), infra-red (Whysong & Antonucci 2004; Ogle et al. 2006) or X-ray (H06). At the same time, they have necessarily relied on small samples, since the relevant data are slow to accumulate for all-sky samples of radio sources, such as the 3CRR sample (Laing, Riley & Longair 1983), the sample that formed the basis of our earlier work (Evans et al. 2006; H06; Belsole et al. 2006). Over the past few years we have been carrying out a programme of X-ray observations of 3CRR objects, primarily with XMM-Newton (see Evans et al. 2008 for a discussion of some of these). At the same time, observations by others in both X-ray and mid-infra-red (using Spitzer) have substantially increased the coverage of the 3CRR sample from the situation in 2006, which allows us for the first time to take a truly multi-wavelength view of a large sample. In the present paper we therefore present an update on the 3CRR sample discussed in our previous papers. Using newly analysed and existing X-ray and infra-red data, we revisit the nature of low-excitation objects and the relationship between the high-excitation population and conventional radio-quiet AGN. We discuss the distribution of absorbing column in the narrow-line radio galaxies and their relationship to the population of radio-quiet type-2 quasars, the current state of the evidence for a jet origin of the soft X-ray component in radio-galaxy nuclear spectra, and the correct approach to positioning radio galaxies on the ‘fundamental plane’ of black hole activity (e.g. Merloni, Heinz & di Matteo 2003).
Throughout the paper, we use a concordance cosmology with km s-1 Mpc-1, and . Where luminosities tabulated by others are used, they may be assumed to have been corrected to this cosmology.
2 Data and analysis
2.1 Sample
Our parent sample is the 3CRR catalogue (Laing, Riley & Longair 1983; hereafter LRL). In this paper, to ensure good X-ray coverage, we consider all the 3CRR objects with . This redshift range allows us to include data from the previous X-ray work by Evans et al. (2006), H06 and Belsole et al. (2006). In the infrared (IR), the 3CRR objects in this redshift range have been studied by Ogle et al. (2006) and Cleary et al. (2007). To obtain the largest possible sample, we supplement the published X-ray and radio data with new data from the Chandra, XMM-Newton and Spitzer archives, as described in the following subsections. By definition, 3CRR objects have a known low-frequency radio luminosity, and all now have a known redshift and a measurement of core flux density at or near 5 GHz111See http://3crr.extragalactic.info/ for a compilation of these values.: in addition, emission-line fluxes and galaxy magnitudes are available for many of them. LRL qualitatively classified the emission-line types for all the objects in the sample, and for consistency with our earlier work we adopt their classifications here. Emission-line luminosities for the sample were compiled by Willott et al. (1999), although emission-line studies of 3CRR objects are still hampered by the lack of homogeneous optical/near-IR spectroscopic information.
There are 135 sources in the 3CRR sample with , excluding the starburst galaxy M82 (3C 231). Of those, at the time of writing, 73 have been observed in imaging spectroscopy modes with Chandra and 39 with XMM, giving a total of 89 (66 per cent) with current-generation X-ray observations. We choose to use only Chandra and XMM data to avoid the problems of contamination imposed by the very low resolution of instruments such as ASCA. 100 3CRR sources have been observed with Spitzer in the IRS ‘Staring’ mode, which gives us access to mid-IR photometry, and there are 69 objects with both X-ray and IRS-S observations. Nearly all the archival data are publicly available. In terms of emission-line classifications, 27/34 LERGs, 40/66 NLRGs, 7/10 BLRGs and 15/24 quasars have been observed in the X-ray, while 25/34 LERGs, 45/66 NLRGs, 8/10 BLRGs and 22/24 quasars have IRS-S data. From this it can be seen that there is no longer significant bias in terms of emission-line type in the X-ray sample, partly as a result of our observing programmes specifically aimed at removing that bias (see the following subsection). In the mid-IR, there is a bias towards broad-line objects that can be understood when one considers that several large-sample Spitzer studies have been carried out with the aim of testing unified models.
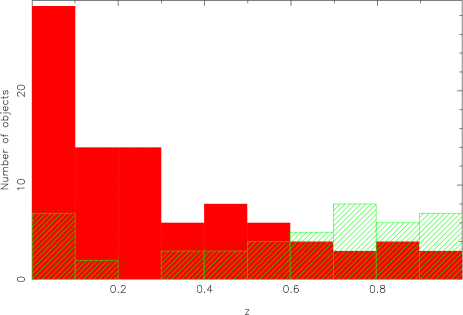
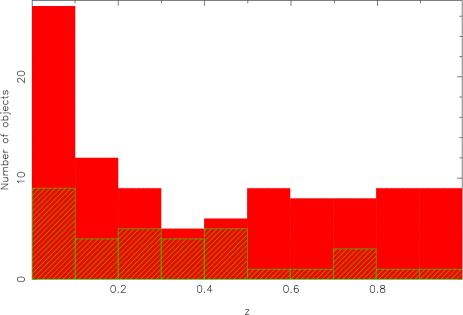
The samples observed are, however, biased in terms of their redshift distribution. Fig. 1 shows that, while X-ray observations approach completeness for the subsample, they are very much less complete for . By contrast, the Spitzer data are more complete at high redshifts than at intermediate ones. Again, this seems likely to be a consequence of the different purposes for which the X-ray and IR data have been taken.
2.2 X-ray data
The majority of the X-ray data comes from earlier work by Evans et al. (2006), H06, Belsole et al. (2006) and Evans et al. (2008). Belsole et al. (2006) did not determine upper limits on heavily-absorbed nuclear components for those sources where they did not fit a two-component model, and so we re-analysed their data for such sources. We also scaled their error estimates to 90 per cent confidence errors for consistency with the approach taken by the other papers.
However, a significant fraction of our sample (31 objects) were too recently observed to be covered by these papers. Observational details for these objects are listed in Table 2.2. A significant fraction of the data comes from the Chandra 3CR snapshot survey (Massaro et al. in prep.; data for 3C 33.1, 132, 153, 171, 184.1, 293, 300, 315 and 381) while some is from our dedicated XMM programme targeting LERGs and NLRGs (4C 12.03, 3C 16, 3C 20, 4C 14.11, 3C 244.1, 3C 349). For these objects we analysed the data (either from the archives or from our own observations) in the manner we described in H06, using ciao 3.4 and CALDB 3.4 for the Chandra data, and sas 7.1.0 for the XMM data. Data preparation and filtering and spectral extraction all exactly duplicate the approach of H06, and are described there.
Spectral fitting, in the energy range 0.4-7.0 keV (for Chandra data) or 0.3-8.0 keV (XMM-Newton), was also exactly the same as for H06. That is, we first fitted a single power law with fixed Galactic absorption to the data (see Table 2.2 for the Galactic column densities used). For those sources where a second component of X-ray emission was clearly required (seen in large residuals and poor values) we then added a second power law with a free, but initially large, absorbing column at the redshift of the source. This gave rise to good fits in almost all the sources where the was initially poor, though occasionally it was necessary to fix the index of the unabsorbed power-law to to get good constraints on its normalization. If a single power law provided a good fit to the data, we added a heavily absorbed power law with fixed and an absorbing column cm-2 at the redshift of the source and re-fitted for the normalization of this new component. If the 90 per cent uncertainty on the normalization was consistent with zero, we treated the upper bound as an upper limit on a heavily absorbed component. If, on the other hand, the fit was improved with a non-zero normalization for this component, we allowed the absorbing column and, if well-constrained, the photon index of the second power law to vary, and treated the resulting model as a detection of a second component. Throughout the rest of the paper we refer, following H06, to the first component as the ‘unabsorbed’ component – since it has little or no intrinsic absorption – and the second, heavily absorbed component as the ‘accretion-related’ component. We refer to the absorption-corrected luminosities of these components as and respectively. In quasars and BLRGs where a single power-law model is fitted, and where we have reason to believe that we may be seeing the accretion disc directly, we use as our best estimate of : thus for a few sources by definition, but in most cases the two luminosities are largely independent.
Results of the spectral fits for each of the newly analysed sources are given in Table 2.2; as in H06, errors on the fitted parameters are 90 per cent confidence for one interesting parameter (), though in all other contexts that errors are quoted in this paper they are the conventional errors (corresponding to ). Individual sources are discussed, and references to previous work given, in Appendix A.
| Source | Emission- | Galactic | Telescope | Observation | Livetime | |
|---|---|---|---|---|---|---|
| line type | ( cm-2) | ID | (s) | |||
| 4C 12.03 | 0.156 | LERG | 5.26 | XMM-Newton | 0551760101 | 10324, 10974, 5307 |
| 3C 6.1 | 0.8404 | NLRG | 17.49 | Chandra | 3009, 4363 | 56390 |
| 3C 16 | 0.405 | LERG | 4.89 | XMM-Newton | 0551760201 | 12179, 13197, 5049 |
| 3C 20 | 0.174 | NLRG | 17.93 | XMM-Newton | 0551760501 | 25303, 26532, 14182 |
| 3C 33.1 | 0.181 | BLRG | 22.50 | Chandra | 9295 | 8068 |
| 3C 48 | 0.367 | Q | 4.80 | Chandra | 3097 | 9225 |
| 3C 61.1 | 0.186 | NLRG | 7.57 | XMM-Newton | 0500910101 | 25388, 25239, 13143 |
| 3C 76.1 | 0.0324 | LERG | 10.10 | XMM-Newton | 0201860201 | 17762, 18165, 10961 |
| 4C 14.11 | 0.206 | LERG | 15.51 | XMM-Newton | 0501620101 | 15791, 15788, 9533 |
| 3C 132 | 0.214 | NLRG | 22.14 | Chandra | 9329 | 7692 |
| 3C 153 | 0.2769 | NLRG | 17.40 | Chandra | 9302 | 8065 |
| 3C 171 | 0.2384 | NLRG | 6.60 | Chandra | 10303 | 59461 |
| 3C 184.1 | 0.1187 | NLRG | 3.35 | Chandra | 9305 | 8022 |
| 3C 220.1 | 0.61 | NLRG | 1.93 | Chandra | 839 | 18922 |
| 3C 228 | 0.5524 | NLRG | 3.28 | Chandra | 2095, 2453 | 24391 |
| 3C 234 | 0.1848 | NLRG | 1.90 | XMM-Newton | 0405340101 | 35698, 36050, 28758 |
| 3C 244.1 | 0.428 | NLRG | 0.67 | XMM-Newton | 0501621501 | 8646, 8867, 2417 |
| 3C 274.1 | 0.422 | NLRG | 2.06 | Chandra | 0551760601 | 15246 |
| 3C 277.2 | 0.766 | NLRG | 1.93 | XMM-Newton | 0082990101 | 41089, 41320, 29950 |
| 3C 288 | 0.246 | LERG | 0.81 | Chandra | 9275 | 39642 |
| 3C 293 | 0.0452 | LERG | 1.29 | Chandra | 9310 | 7814 |
| 3C 300 | 0.272 | NLRG | 2.44 | XMM-Newton | 0500910601, 0500910901, 500911101 | 19699, 42415, 42344 |
| 3C 315 | 0.1083 | NLRG | 4.62 | Chandra | 9313 | 7670 |
| 3C 325 | 0.86 | Q | 1.74 | Chandra | 4818, 6267 | 58308 |
| 3C 349 | 0.205 | NLRG | 1.99 | XMM-Newton | 0501620301 | 22533, 22089, 15170 |
| 3C 381 | 0.1605 | BLRG | 5.87 | Chandra | 9317 | 8065 |
| 3C 427.1 | 0.572 | LERG | 11.60 | Chandra | 2194 | 39452 |
| 3C 433 | 0.1016 | NLRG | 9.15 | Chandra | 7881 | 37172 |
| 3C 442A | 0.027 | LERG | 5.08 | Chandra | 5635 | 27006 |
| 3C 457 | 0.428 | NLRG | 5.06 | XMM-Newton | 0502500101 | 52172, 52185, 29735 |
2.3 Infrared data
Our approach in determining mid-IR luminosities follows that described by Ogle et al. (2006). They measured the rest-frame 15-m luminosity, on the basis that this samples the continuum without being contaminated by any of the known spectral features in the mid-IR band. Cleary et al. (2007) also tabulate 15-m luminosities for the sources in their sample, unfortunately without quoting errors (for the purposes of regression we assign IR luminosities from this source an arbitrary error of 0.01 dex, or per cent). We have measured new values of the 15-m flux density only for the 32 objects that have available Spitzer IRS data and that do not have a quoted value either in Ogle et al. or Cleary et al.; otherwise we use published data.
To measure the flux densities we used the ‘post-BCD’ spectra available from the Spitzer archive. Although in general these are not recommended for science analysis, the only significant difference between the BCD and post-BCD IRS data is that the post-BCD data are background-subtracted: two positions are observed for each spectrum and the background subtraction for each channel and spectral order involves subtracting the image from one position from the image at the other position. Since the automated procedure used to produce the post-BCD data is exactly what we would have done ourselves in any case, we feel justified in using post-BCD data for the analysis. We extracted spectra from all available orders using spice and then merged them (taking the weighted mean of duplicated data points where the wavelength ranges of different modules overlapped) to give a single table of flux density and error as a function of frequency: we then used the weighted mean of the flux density around rest-frame 15 m (exactly as described by Ogle et al. 2006) to determine the 15-m flux density and its error. We verified for a number of test cases that this gave flux densities in agreement with those tabulated by Ogle et al. (2006). The flux densities we measure and their errors are shown in Table 2.3.
3 Results
The results of our analysis are summarized as a table of luminosities for different aspects of the AGN activity (Table LABEL:lumtab). Our X-ray luminosities or upper limits are measured in the 2–10 keV band, while we have luminosity densities for the whole source at 178 MHz, the radio core at 5 GHz, and the AGN at 15 m. We also have emission-line powers in the [OIII] and [OII] lines. At redshifts we use the virtually complete, homogeneous database of Buttiglione et al. (2009) for [OIII], while emission-line powers for higher-redshift objects and for [OII] are taken from the online table222Now at http://www.science.uottawa.ca/cwillott/3crr/3crr.html . of Willott et al. (1999), converted to the cosmology used here. For convenience we convert all luminosity densities into form so that all numbers are roughly commensurate. Missing entries in the table indicate a lack of observations in the corresponding band: only the radio luminosities are complete for all objects.
To derive results about the physics of the radio-loud AGN in our sample we must consider the relationships between the various luminosities we have available. We emphasise that we already know that none of these luminosities is expected to provide a guaranteed insight into the physical processes in the central engine. The low-frequency radio luminosity is related to time-averaged jet kinetic power, but also to the age of the source and to properties of the external environment. The core radio luminosity is related to the instantaneous jet power, but must necessarily be strongly affected by beaming for all sources if unified models are correct. The mid-IR luminosities tell us something about the emission from a torus, if present, but it is widely thought (e.g. Heckman, Chambers & Postman 1992; Hes, Barthel & Hoekstra 1995; Cleary et al. 2007) that there is an orientation-dependent component to the mid-IR luminosity of 3CRR sources, a point we will return to later in the paper, while at low luminosities there is the potential for contamination with other sources of mid-IR emission. The optical emission lines provide some measure of the accretion disc photoionizing luminosity, if a disc is present, but there is disagreement in the literature (e.g. Jackson & Browne 1990; Hes, Barthel & Fosbury 1993; Simpson 1998) about whether these are radiated isotropically and which is the best proxy for non-stellar continuum strength, while again there is the possibility of contamination by emission-line material not photoionized by the accretion disc (e.g. either shock ionization or photoionization by the jet); moreover, the dependence of line luminosity on photoionizing luminosity is non-linear in general and depends on the detailed properties of the photoionizing spectrum and the material being ionized (e.g. Tadhunter et al. 1998). Finally, our X-ray luminosities for the absorbed and unabsorbed components suffer from contamination by each other (especially if there is little absorption) and from uncertainty about the level of upper limits on absorbed emission; and, while an absorbed nuclear component seems likely to give us information about the luminosity of the accretion disc, there is still disagreement about the nature of the unabsorbed components, although it has been clear for some time that the jet is likely to dominate the X-rays in core-dominated quasars (e.g. Worrall et al. 1987; for more discussion of the possible origins of this component see Section 4.3).
In this section of the paper we therefore consider the relationships between the different luminosities, and see what conclusions can be drawn from them, without attempting to test particular models in detail. At the end of the section we summarize our view of the implications of these relationships for the physics of radio-loud AGN. We address several more detailed aspects of the results in Section 4.
Throughout the section we use consistent methods for correlation and regression analysis. Since 3CRR is a flux-limited sample at 178 MHz, and since there are also effectively flux or flux-density limits at all other wavebands, we expect to see correlations at some level in any luminosity-luminosity plot we can produce. We account for this by testing for partial correlation in the presence of redshift in all our correlation analysis: we do this using the code of Akritas & Seibert (1996), which can take into account the presence of upper limits in the data. Where we carry out linear regression we use a Bayesian code, based on the Markov Chain Monte Carlo algorithm, which takes account of both errors and upper limits and which determines, as well as slope and intercept, the width of a log-normal dispersion about the regression line: it is the width of this dispersion (rather than the formal uncertainty) that is indicated on the plots. We adopt uniform (uninformative) priors for all three fitted quantities. Correlation coefficients and parameters for the regression lines are tabulated in Tables 5 and 6.
3.1 X-ray data and radio/X-ray correlations
As discussed above, for each X-ray observed source we have a measurement of, or limit on, the luminosity of an unabsorbed or weakly absorbed component () and an ‘accretion-related’ component (), defined in the same way as in H06.
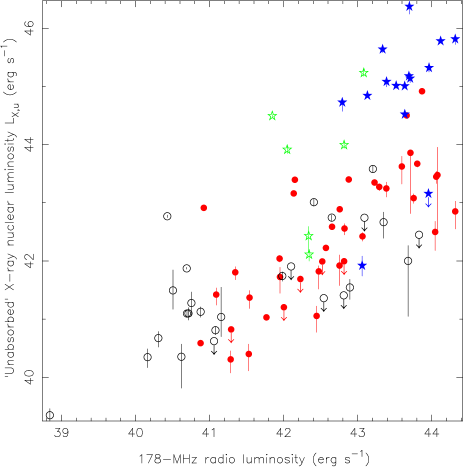
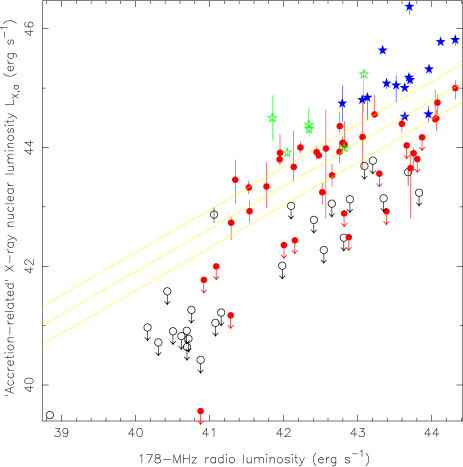
In Figs 2 and 3 (corresponding to figs 2 and 3 of H06) we plot these two quantities as a function of the total radio luminosity at 178 MHz, . It will be seen that there is a good deal more scatter in the relation at high radio luminosities than in the corresponding relation for . Indeed, the null hypothesis of no intrinsic correlation cannot be rejected at the level for the relation, whereas and are significantly correlated even in the presence of the common correlation with redshift (as found by H06 for their smaller sample). This suggests no very strong physical relationship between the unabsorbed X-ray power, before correcting for beaming, and the power of the AGN as measured by the total radio luminosity. Individual emission-line classes of source, such as the NLRGs, appear better correlated on the plot, but partial correlation analysis shows that we cannot rule out the null hypothesis of no intrinsic correlation for any of the emission-line classes on Fig. 2. By contrast, the NLRGs (though no other individual class) are significantly correlated on the partial correlation test in Fig. 3. Separation of the sources by emission-line type can also be seen in both plots: quasars and BLRGs tend to have much higher , and somewhat higher , for a given , while the upper limits on for the LERGs lie systematically below the luminosities for detected NLRGs. We illustrate this by plotting the regression line for the NLRGs only on Fig. 3.
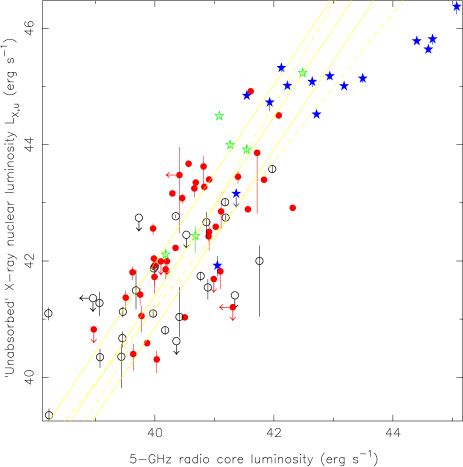
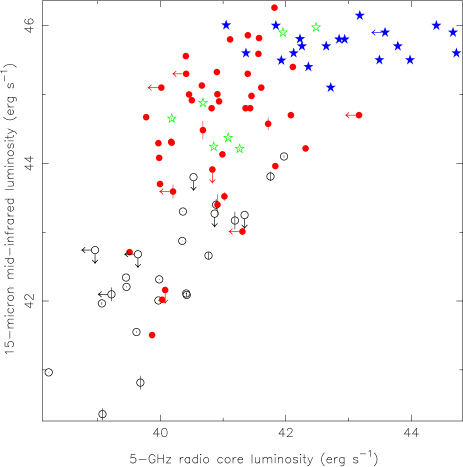
Figs 4 and 5 show the corresponding plots of the X-ray quantities as a function of the 5-GHz nuclear luminosity, . Both of these correlations are formally significant in the presence of common correlation with redshift, but the correlation between and is by far the stronger of the two (Table 5), though there is still a good deal of scatter in the relationship, and the correlation between and vanishes if the quasars are excluded – the quasars in the top right of both figures are objects for which we cannot perform a good separation of and – while the correlation of Fig. 4 remains significant. The LERGs and NLRGs have individually significant correlations between and , while no individual emission-line class has a correlation between and . Regression analysis shows that the regression lines for LERGs and NLRGs are consistent (Fig. 4; Table 6), whereas by eye they are widely separated on the plot involving .
As we have argued previously (e.g. Hardcastle & Worrall 1999) much of the dispersion in must originate in beaming if unified models are correct. We would expect beaming to introduce two to three orders of magnitude scatter in any correlation between beamed and unbeamed quantitues for the LERG population (for plausible Lorentz factors), and so any strong correlation between and some other quantity without this scatter forces us to the conclusion that much of that other quantity is also beamed, and so must originate in the jet. Beaming will introduce considerably less scatter for the NLRGs, which occupy a restricted range of angles to the line of sight, but where they lie on the same correlation as the LERGs, the argument for a jet origin can be applied to the entire population. The data are thus consistent with the model in which originates in the jet while originates in the accretion disc. Our inability to separate the two sources of X-ray luminosity in the BLRGs and quasars accounts for their tendency to lie above the regression line for the NLRGs in Fig. 3. The fact that the quasars with the largest radio core luminosities seem to have lower X-ray to radio ratios in Fig. 4 (illustrated by their deviation from the regression line for NLRGs and LERGs) is also seen in the ROSAT analysis of Hardcastle & Worrall (1999); it is possible that it reflects different effective speeds for the beaming of the radio and X-ray emission components (e.g. Ghisellini & Maraschi 1989). We return to the question of the origin of the unabsorbed component in Section 4.3.
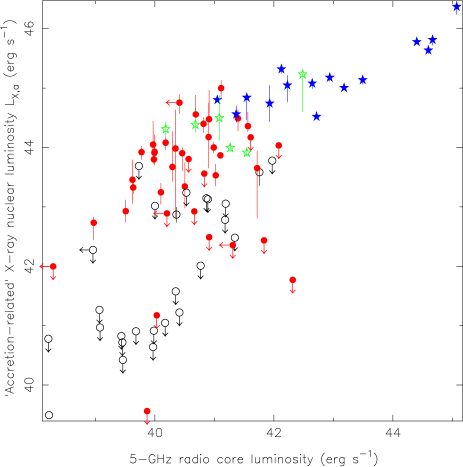
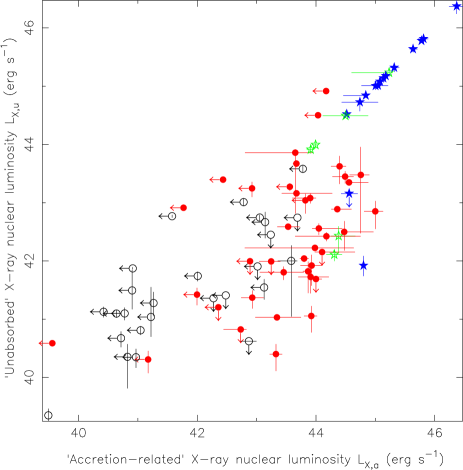
Finally, we plot the two X-ray luminosities against each other (Fig. 6). No significant correlation between the two luminosities exists for NLRGs when the common correlation with redshift is taken into account. For some BLRGs and quasars our best estimates of and are equal and so these appear well correlated.
3.2 Radio/IR correlations
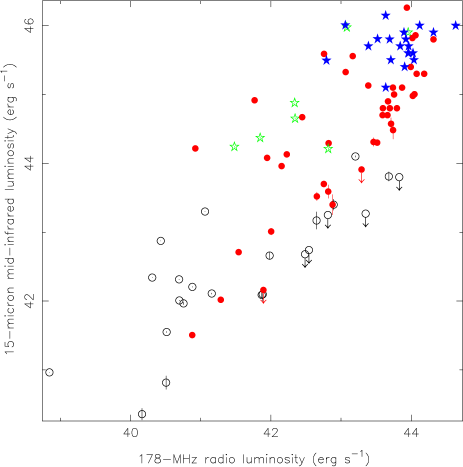
In Figs 7 and 8 we plot the relationships between total 15-m luminosity () and the radio total and core luminosity for the objects in our sample with IR flux density measurements. Both these plots show correlations that are formally highly significant even in the presence of the common correlation with redshift. Fig. 7 may be compared with figs 8 and 9 of Cleary et al. (2007). The clearest trend in this figure is for the broad-line objects to lie systematically above the NLRGs at a given radio luminosity/redshift. This trend was also noted by Cleary et al. (2007), and, in a sample of high- 3CRR objects, by Haas et al. (2008). We also see that the LERGs tend to lie below the NLRGs. Cleary et al. explain the tendency for the BLRGs and quasars to have higher IR luminosities than the NLRGs in terms of two effects: a contamination of the IR by non-thermal (i.e. synchrotron) emission, and excess line-of-sight absorption in the NLRGs that is not present in the quasars. If these effects are accounted for, Cleary et al. show that the correlation is improved: since it is already strong, these observations imply that there is a physical relationship between and for the high-excitation objects, but that the same relationship does not hold for the LERGs. Dicken et al. (2008) see no evidence for a tendency for quasars to lie above radio galaxies in the IR in their analysis of an independent, complete sample, but we note that they use total radio luminosities at 5 GHz to estimate radio power; although their selection criteria at 2.7 GHz are intended to exclude objects dominated by beaming, any tendency for quasars to have higher 5-GHz luminosities than radio galaxies of similar low-frequency luminosity would tend to suppress a difference between the classes on a plot analogous to Fig. 7.
In Fig. 8 the distinction between broad-line objects and NLRGs is not so apparent, since the broad-line objects have systematically higher and . This is certainly consistent with the idea that non-thermal emission in the IR plays a significant role in the BLRGs and quasars. As with Fig. 4, we see a flattening of the correlation at the highest radio luminosities. In this figure the partial correlation for the LERGs alone is significant; this is not true for any other individual class of source.
3.3 IR/X-ray correlations
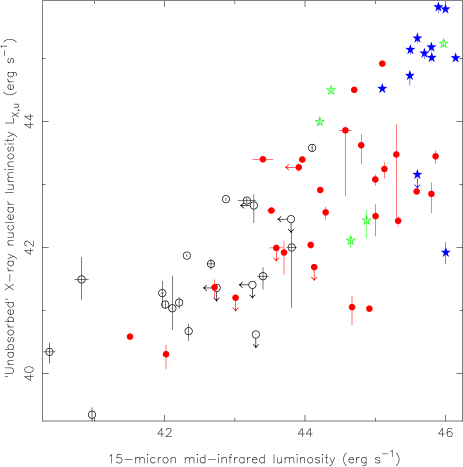
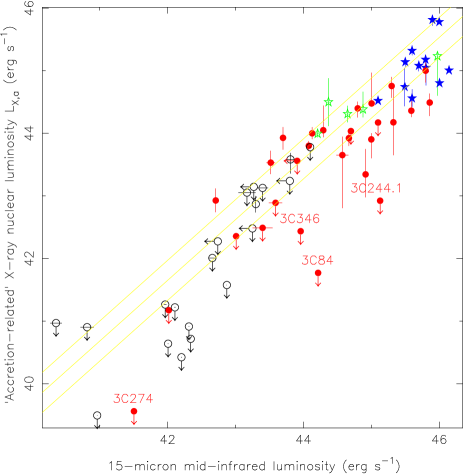
Figs 9 and 10 show the relationships between 15-m IR luminosity and the unabsorbed and ‘accretion-related’ X-ray emission components, respectively. These are both formally significant correlations, but the correlation between and is much the stronger of the two, and has a slope consistent with unity (Tables 5 and 6). (For the regression we only consider objects with measurements of : it is not appropriate to incorporate the upper limits on in the regression because these are dependent on the assumed absorbing column, a point we return to in Section 4.2.) This strong, approximately linear correlation (whose significance is improved still further if the LERGs are excluded) is very strong evidence that and are measuring closely related quantities, linked by the overall power of the accretion disc. Quasars and BLRGs lie above NLRGs of similar in Fig. 10, which implies that is more severely contaminated by non-thermal/beamed emission than is . The limits on LERGs tend to lie on, or below, the correlation for the detected objects. Compton-thick objects (i.e. those with cm-2) would have X-ray upper limits that are below/to the right of the regression line in Fig. 10, because our X-ray upper limits in this case would be based on an incorrect, low value. For the FRII LERGs, with erg s-1, we see no objects for which this seems likely to be true, although several NLRG upper limits do lie a long way below the line. We discuss the implications of this plot for the nature of LERGs in Section 4.1 and the case of the NLRG outliers in Section 4.2.
The approximately linear correlation between mid-IR and X-ray power after correction for absorption is very similar to that found in lower-power objects (mostly radio-quiet Seyferts) by Gandhi et al. (2009) using 12.3 m ground-based IR observations: above erg s-1 our objects lie in an identical region of the IR/X-ray luminosity plot, and our regression slope is consistent with theirs within the joint errors.
In Fig. 9 we see a large amount of scatter for a given , with quasars and broad-line objects clearly having significantly higher X-ray luminosity; this is consistent with the idea that here we are plotting a beamed quantity (, see above) against one that is basically unaffected by beaming.
3.4 Emission-line power
Data on the luminosity of the [Oiii] and [Oii] emission lines are available in the compilation of Willott et al. (1999) and in the more recent work of Buttiglione et al. (2009). 88 sample sources have [Oiii] luminosities and 86 [Oii] (Table LABEL:lumtab). Because of the longer wavelength of the [Oiii] line, high-redshift, high-luminosity sources are more likely to have [Oii] data than [Oiii], a fact that must be borne in mind in interpreting the results in this section.
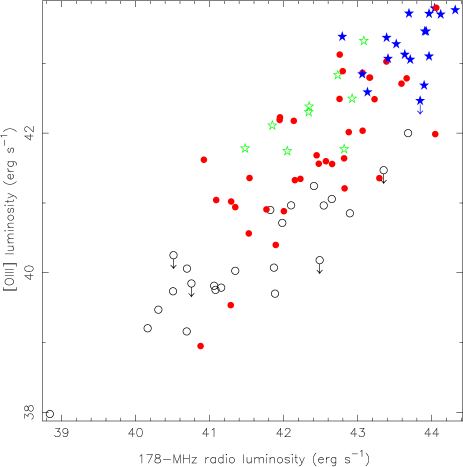
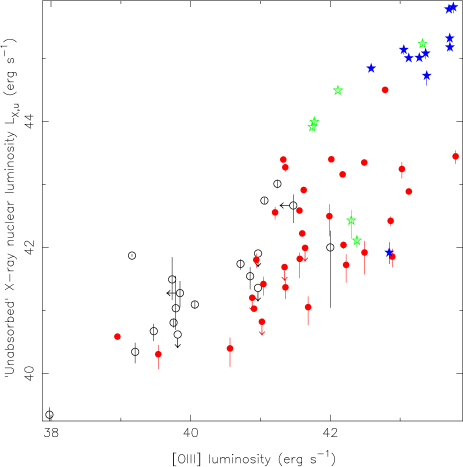
Fig. 11 shows the luminosities of the two emission lines as a function of 178-MHz luminosity for the sample: this illustrates the well-known fact that broad-line objects have systematically higher [Oiii] luminosities than narrow-line objects of similar luminosity (Jackson & Browne 1990), while the [Oii] luminosities are similar (Hes, Barthel & Fosbury 1993). In addition, we see that the few LERGs with emission-line data lie at the very bottom of the observed luminosity range. Since line emission is supposed to be driven by the ionizing luminosity of the accretion disc, we might expect to see a better correlation with and , and this is in fact what we do see for [Oiii] (Figs 12 and 13), with a highly significant correlation even after accounting for the common correlation with redshift. Similar results for the [Oiii]-IR correlation have recently been obtained for the 2Jy sample of radio galaxies by Dicken et al. (2008). The LERGs in Fig. 13 lie on or below the regression line: that is, the limits on X-ray accretion-related luminosity are less even than we would predict from their (low) emission-line luminosities. However, the – correlation is much weaker (though still significant) and the – correlation is not significant after common correlation with redshift is accounted for. This may be explained in terms of the relatively weak expected dependence of [OII] luminosity on ionizing luminosity (e.g. Simpson 1998; Tadhunter et al. 1998) coupled with the scatter in the – relation. The partial correlations between [Oiii] and IR/accretion-related X-ray remain highly significant if the LERGs are excluded, while the corresponding correlations involving [Oii] are not significant.
It is striking that the quasars lie on what appears to be a reasonable extrapolation of the trend seen for NLRGs in Figs 12 and 13. We know that the quasars are systematically brighter than radio galaxies of comparable luminosity in X-ray (e.g. Belsole et al. 2006; Fig. 3) IR (Cleary et al. 2007; Fig. 7) and [Oiii] (Jackson & Browne 1990; Fig. 11) but Figs 12 and 13 show that the typical factors by which they exceed the expected luminosities are comparable at the three different wavebands (i.e. a factor of a few in each case); in simple unified models, this is a coincidence, since the explanations for the quasar excess are different in each case. In principle, the receding torus model (Simpson 1998) provides a more natural explanation for at least the [Oiii] and X-ray excesses; we will discuss modified unification of this kind in more detail in Section 3.5.
The relationship between [OIII] and ‘accretion-related’ X-ray emission plotted here is in excellent agreement with that found for other classes of AGN. For example, Panessa et al. (2006) tabulate 2-10 keV X-ray and [OIII] luminosities for a sample of low-luminosity Seyferts and establish a correlation between the two which extends up to intermediate-luminosity Seyfert 1s and PG quasars. The NLRGs in our sample lie in an identical region of parameter space to the high-luminosity objects in their fig. 4 and so on an extension of their correlation. This strengthens the evidence that the ‘accretion-related’ X-ray emission in the 3CRR sources really does trace intrinsic properties of the AGN in a way which is independent of the properties of the jet.


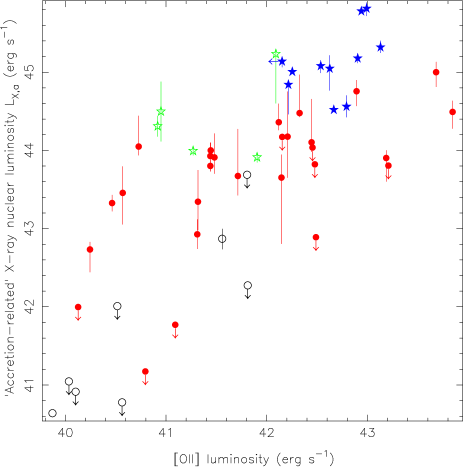

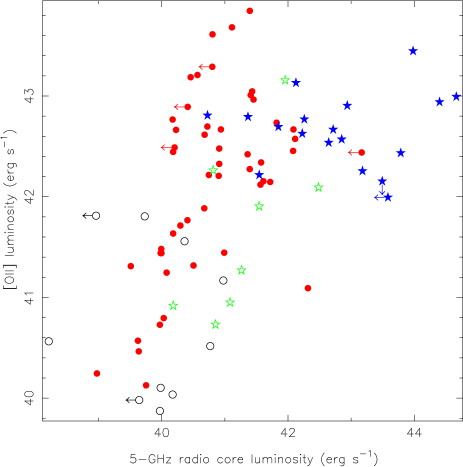
Finally, we examine the relationship between supposed beamed quantities and optical emission lines. The relationship between radio core luminosity and emission-line power is shown in Fig. 14. There is a significant correlation overall between the radio core luminosity and the [Oiii], but not the [Oii] luminosities; we can interpret this as being driven by the quasars with their higher emission-line luminosities and core fluxes. Both correlations are weaker than the corresponding correlations with , and the correlation for the NLRGs and LERGs alone is not significant in either plot. However, if we consider the relationship between emission lines and , an interesting trend emerges (Fig. 15): again, the overall [Oiii] relationship shows a significant correlation and the [Oii] does not, but here there is a significant correlation for the NLRGs and LERGs alone between and , although it is not as strong as the correlation for the same objects between and . In the model in which the scatter in is mostly due to beaming, this could perhaps be accounted for by a common correlation with orientation angle coupled with the orientation-dependent obscuration of [Oiii] invoked by Jackson & Browne (1990) to explain the position of quasars on these plots. Alternatively it could indicate some direct connection between and emission-line power. We return to this point in Section 4.3.


3.5 Luminosity correlations and their origins
Tables 5 and 6 list the correlations and regressions discussed in the preceding subsections. To summarize, we have argued that and are beamed quantities, showing a good correlation with each other but generally a poor correlation, showing separation between radio galaxies and quasars, with other quantities such as or that are expected a priori to be unaffected by beaming. The implications of this result will be discussed in Section 4.3. The total radio luminosity, , is reasonably well correlated with all quantities (, , …) that might be expected to be unbeamed indicators of AGN power, but generally we find non-linear correlations and relatively large dispersion in the relationship, which in the standard picture is an indication of the complex relationship between accretion power, jet power and radio luminosity (see, e.g., Rawlings & Saunders 1991 for a discussion in the context of emission-line power). The best correlation, with a relatively small dispersion and a slope consistent with being linear, is that between and (as previously noted, using a much smaller sample, by H06). This strongly supports the idea that in we have a largely uncontaminated indicator of AGN power.
In the simplest unified models we might expect all AGN-related luminosities to correlate linearly with each other. As we have already noted, however, the situation is more complex in the case of the emission-line luminosities and . The tendency for to be higher in quasars than in radio galaxies of the same radio luminosity (Fig. 11) is explained by Jackson & Browne (1990) in terms of higher absorption in radio galaxies, and by Simpson (1998) in terms of the receding torus model, in which more intrinsically luminous objects have smaller torus covering fractions and therefore are more likely to be identified as quasars. Since the covering fraction of the torus determines the fraction of accretion disc radiation intercepted by it and re-radiated in the mid-IR, a prediction of the simplest versions of this model is that the mid-IR luminosity should have a weaker than linear dependence on the overall AGN luminosity, (Dicken et al. 2008). If we assume that the accretion-related X-ray luminosity scales linearly with , then our results provide no obvious support for this model – the correlation between and is consistent with being linear, and a model in which is ruled out by our fits. Equivalently, we see no significant trend in a plot of against or : there is a negative trend for the quasars but this seems mostly likely to be explained by contamination of by jet-related emission in the most luminous, core-dominated objects. Investigating other diagnostic plots of this kind, the only strong trend we find is that strongly increases with , which is in the opposite sense to the prediction of the simple receding torus model in which should have a similar dependence on bolometric luminosity to (Tadhunter et al. 1998). We conclude that, while the simplest form of the receding torus model may provide a better explanation of the emission-line properties of the radio galaxies, it is not consistent with our IR and X-ray data unless (1) does not correlate linearly with (which we cannot test directly for our sample) and/or (2) the IR properties of the torus do not scale in the simplest possible way. On different grounds Dicken et al. (2008) suggest that (2) is the case for their independent sample of radio galaxies.
| Abscissa | Ordinate | Figure | Subsample | Number | Correlation? | |
|---|---|---|---|---|---|---|
| 2 | All | 87 | N | 2.77 | ||
| LERG | 26 | N | 1.13 | |||
| NLRG | 40 | N | 1.56 | |||
| BLRG | 6 | N | 0.09 | |||
| Q | 15 | N | 0.62 | |||
| 3 | All | 87 | Y | 3.75 | ||
| LERG | 26 | N | 0.68 | |||
| NLRG | 40 | Y | 3.37 | |||
| BLRG | 6 | N | -1.08 | |||
| Q | 15 | N | 0.65 | |||
| 4 | All | 87 | Y | 8.10 | ||
| Q excluded | 72 | Y | 5.84 | |||
| LERG | 26 | Y | 4.08 | |||
| NLRG | 40 | Y | 3.56 | |||
| BLRG | 6 | N | 2.39 | |||
| Q | 15 | N | 2.37 | |||
| NLRG/LERG with [Oiii] | 50 | Y | 3.97 | |||
| 5 | All | 87 | Y | 4.27 | ||
| Q excluded | 72 | N | 1.45 | |||
| LERG | 26 | N | 1.38 | |||
| NLRG | 40 | N | -0.08 | |||
| BLRG | 6 | N | -0.01 | |||
| Q | 15 | N | 2.13 | |||
| 6 | NLRG | 40 | N | -0.13 | ||
| 7 | All | 94 | Y | 4.89 | ||
| 8 | All | 94 | Y | 7.18 | ||
| LERG | 24 | Y | 3.71 | |||
| NLRG | 43 | N | 1.98 | |||
| BLRG | 7 | N | 0.45 | |||
| Q | 20 | N | 0.21 | |||
| 9 | All | 65 | Y | 4.92 | ||
| LERG excluded | 45 | Y | 3.19 | |||
| 10 | All | 65 | Y | 8.95 | ||
| LERG excluded | 45 | Y | 9.25 | |||
| 11 | All | 86 | Y | 3.86 | ||
| 11 | All | 88 | Y | 5.31 | ||
| 12 | All | 62 | Y | 3.60 | ||
| LERG excluded | 56 | N | 2.66 | |||
| 12 | All | 66 | Y | 7.08 | ||
| LERG excluded | 47 | Y | 6.47 | |||
| 13 | All | 52 | N | 1.66 | ||
| LERG excluded | 44 | N | 0.93 | |||
| 13 | All | 67 | Y | 6.15 | ||
| LERG excluded | 49 | Y | 5.22 | |||
| 14 | All | 86 | N | 2.69 | ||
| NLRG and LERG | 60 | N | 1.66 | |||
| 14 | All | 88 | Y | 4.69 | ||
| NLRG and LERG | 61 | N | 2.31 | |||
| 15 | All | 52 | N | 1.78 | ||
| NLRG and LERG | 36 | N | 1.54 | |||
| 15 | All | 67 | Y | 5.11 | ||
| NLRG and LERG | 50 | Y | 3.22 |
| Abscissa | Ordinate | Figure | Subsample | Number | Slope | Intercept | Scatter |
|---|---|---|---|---|---|---|---|
| 3 | Detected NLRGs | 27 | |||||
| 4 | NLRGs and LERGs | 66 | |||||
| LERGs | 26 | ||||||
| NLRGs | 40 | ||||||
| 7 | All | 94 | |||||
| 10 | X-ray detected | 36 | |||||
| 11 | All | 86 | |||||
| 11 | All | 88 | |||||
| 12 | All | 62 | |||||
| 12 | All | 66 | |||||
| 13 | X-ray detected | 40 |
4 Discussion
4.1 The nature of LERGs and NLRGs revisited
We begin by acknowledging again (see H06) the arbitrary nature of the optical emission-line classification that we rely on to identify the LERG population. In the case of the 3CRR galaxies the problem is particularly acute, as the only information we have in many cases comes from the qualitative description of poor-quality spectra given in the original 3CRR catalogue (LRL). Even when this is not the case, ‘nuclear’ narrow emission lines cannot be unambiguously associated with the classical narrow-line region, photoionized by an accretion disc; as discussed by Evans et al. (2008), there is likely to be contamination both with extended emission-line regions affected by the passage of the jet and with material photoionized by the jet itself. Thus while the absence of strong high-excitation emission lines (neglecting cases where there is strong foreground obscuration) is a reasonable indicator that there is no radiatively efficient active nucleus present to photoionize them, the presence of such emission lines does not necessarily imply the presence of a radiatively efficient nucleus.
We therefore initially consider the X-ray properties of the sources classed as LERGs by LRL. Of the 26 in our sample with X-ray data, only two show any evidence for a heavily obscured, luminous component in the X-ray spectrum, and one of these is 3C 123, whose emission-line spectrum is known to be severely affected by foreground (Galactic) reddening (H06). The other is the peculiar object 3C 293, which is almost certainly misclassified in LRL given the strong high-excitation emission lines reported in subsequent work (e.g. van Breugel et al. 1984). Thus it remains the case (as reported in H06) that a genuine low-excitation optical spectrum is an excellent predictor of the absence of a heavily absorbed, ‘accretion-related’ component in the X-ray. We would argue that both 3C 293 and 3C 123 should really be classed as NLRGs; their IR properties (Fig. 10) are entirely consistent with the regression line fitted to the NLRGs.
On the other hand, of the 40 objects classified as NLRGs in our sample with X-ray data, there are 13 where we have not detected a heavily absorbed nucleus, i.e., where either the source is not detected at all or a two-power-law model does not give an improvement in the fit to the X-ray data. These 13 can be divided into FRIs (3C 274 = M87, 3C 84 = Perseus A, 3C 305, 3C 338, 3C 315 and 3C 346) and FRIIs (3C 153, 3C 300, 3C 274.1, 3C 244.1, 3C 220.1, 3C 277.2 and 3C 6.1), in order of 178-MHz radio luminosity. The low-luminosity cases have already been discussed by Evans et al. (2008): as we pointed out in that paper, we are particularly liable in these systems to contamination of the optical emission-line spectrum by material not directly associated with photoionization by the nucleus, and this is especially true in the cases of objects such as 3C 274, 3C 84 and 3C 338 which lie in the centres of clusters. 3C 315 is a non-detection in the 8-ks Chandra snapshot and it seems possible that a deeper observation might reveal a hidden nucleus. Of the high-luminosity cases, 3C 153 only has poor-quality X-ray data and is a non-detection in the X-ray. [We note also that the emission-line classification of 3C 153 is disputed: Willott et al. (1999) classify it as a LERG on the basis of the high-quality spectroscopy of Lawrence et al. (1996), which would be consistent with the X-ray results, since no radio nucleus is seen.] More interesting are the six NLRG FRIIs with comparatively sensitive X-ray data but with no evidence for a heavily obscured nucleus, 3C 6.1, 3C 220.1, 3C 244.1, 3C 274.1, 3C 277.2 and 3C 300. We return to these objects below.
Mid-IR emission is key to a discussion of obscured nuclei, since it gives us the ability to distinguish between a very heavily obscured but still radiatively efficient nucleus and one which is simply not present, or at least not radiatively efficient (e.g. Whysong & Antonucci 2004). An important advance over the situation we described in H06 is that mid-IR information is available for a large fraction of the X-ray-observed 3CRR sources, as discussed in Section 3.3. Fig. 10 is the relevant diagnostic plot. This shows a very good relationship between mid-IR and X-ray luminosity for sources where an obscured X-ray component is detected. Since we assume cm-2 in calculating upper limits on accretion-related luminosity, any object that follows that relationship but in fact has a higher column density (e.g. Compton-thick objects with cm-2) should appear as an upper limit in X-ray lying below/to the right of the regression line in Fig. 10.
Considering the LERGs first, we see that powerful LERGs ( erg s-1) tend to lie close to the regression line, whether they are detections or upper limits in the IR. This implies that none of these objects is Compton-thick. Conceivably some have hidden X-ray nuclei that are close to the current upper limits, but none is a powerful, heavily obscured AGN. This supports similar conclusions by Ogle et al. (2006) and Dicken et al. (2008). Low-power LERGs, including most of the nearby FRI radio galaxies, tend to lie below the regression line. However, in these cases, contamination of the mid-IR by galactic and jet-related emission (cf. Whysong & Antonucci 2004) may be very important. The slit width for the Spitzer spectroscopy at zero redshift is 10.5 arcsec, corresponding to kpc at (the redshift of a typical FRI in our sample), so the measured flux densities include a significant contribution from stars and small-scale dust and are not a reliable measure of AGN luminosity alone. Some evidence for jet contamination in the LERGs (only) is provided by the significant correlation between and for these objects discussed in Section 3.2. For these objects detailed analysis of the mid-IR spectroscopic and imaging data (Birkinshaw et al. in prep.) is required to constrain the nature of the IR emission, and accordingly we do not consider them further.
Several objects classed as NLRGs lie well below the regression line in Fig. 10 and are labelled in that figure. The lowest-luminosity of these is M87 (3C 274), which lies in much the same region of parameter space as several of the LERG FRIs discussed above. In this particular case we know unambiguously that the Spitzer flux density measurement must be contaminated by non-nuclear emission, since Whysong & Antonucci (2004), using ground-based imaging, measured a point-like flux density of mJy at 11.7 m, explicitly noting that wide-aperture photometry with IRAS gave a larger result; we also see a clear difference of a factor between the fluxes measured in the short-wavelength Spitzer spectroscopy (with its 3.7-arcsec slit) and the long-wavelength spectroscopy at 15 m, showing without doubt that the longer-wavelength data are dominated by extended emission. As with other low-power objects, jet-related mid-IR emission is also a serious potential contaminant. The other significant outliers on this plot are 3C 84 (NGC 1275, Perseus A), 3C 346, and 3C 244.1. 3C 84 is diversely classified in the literature as a Seyfert 2 (NLRG) or a Seyfert 1 (BLRG); the detection of broad H emission (Fillipenko & Sargent 1985) would put it in the BLRG class, in which case it would not be relevant here (for a BLRG we would consider the much higher unabsorbed X-ray luminosity, erg s-1, as our best estimate of the accretion-related X-ray). Weedman et al. (2005) argue on the basis of the silicate feature at 10 m that the Spitzer emission comes from dust rather than non-thermal (i.e. jet-related) AGN emission, but it is not clear whether the dust emission is truly nuclear or is related to the gas and star formation known to be present in the nucleus of NGC 1275. In any case, INTEGRAL observations (Bassani et al. 2006) suggest that we are not missing very heavily absorbed emission in 3C 84. 3C 346 has an unusually strong unabsorbed X-ray luminosity for its radio luminosity (lying in the region populated by BLRGs and quasars) and it seems possible either that it is a previously undentified broad-line object or that it is a LERG with emission lines related to the active nucleus: Chiaberge et al. (2002) show that it lies in the same region as broad-line objects and LERGs in their diagnostic plot relating [OIII] equivalent width to optical/radio core flux density ratio.
The most interesting of the four outliers is 3C 244.1, which is a normal FRII radio galaxy with a very luminous mid-IR detection, lying more than an order of magnitude in X-ray luminosity below the regression line. It is also a clear outlier on the plot of X-ray versus [Oiii] luminosity (Fig. 13). It seems highly likely that this is a genuine example of a Compton-thick FRII. To make it lie on the IR/X-ray regression line we determine (using xspec) that we would require cm-2. As we will discuss in the next section, this is not an unreasonably large column density for a NLRG. Other NLRG FRIIs without detected heavily absorbed components but with IR observations (3C 6.1, 3C 220.1, 3C 274.1 and 3C 300) lie close to the regression line in Fig. 10 for the assumed limiting column density of cm-2, and so could be brought back to the line without requiring Compton-thick values. 3C 277.2, the remaining powerful FRII without a detection of heavily absorbed X-rays, has no Spitzer data.
4.2 Absorbing columns in NLRGs and type-II quasars
We now have enough examples of objects with significant intrinsic absorbing columns to begin to ask questions about the distribution of values. In total we have 40 objects with measured values of (Table 4.2). This includes four FRI LERGs where an additional absorbing component, presumably related to large-scale dust rings in the host galaxy, is required to allow a good single power-law fit (e.g. Hardcastle et al. 2002; Hardcastle, Sakelliou & Worrall 2005): as this is a rather different situation to genuine nuclear absorption we do not include these in the analysis that follows, though we do include the two powerful LERGs (3C 123 and 3C 293) which we have argued are misclassified in LRL (Section 4.1). It also includes three objects classed as BLRGs (3C 33.1, 3C 109, 3C 381) and four quasars (3C 47, 3C 249.1, 3C 325, 3C 351) where a two-power-law model is required for a good fit to the X-ray spectrum. Of the broad-line objects, only 4 have a best-fitting column density cm-2; one of these (3C 381) is almost certainly not a genuine BLRG (see Section A.13). On the other hand, no NLRG with detected obscured emission has a best-fitting value below cm-2.
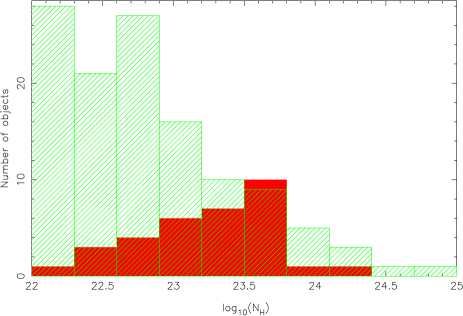
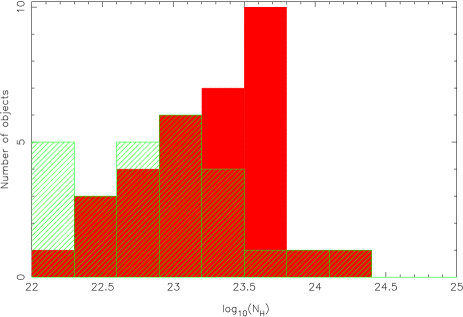
It is interesting to compare the distribution of values for these radio-selected obscured AGN with the distribution obtained for X-ray-selected objects (X-ray selection, coupled with spectroscopic or photometric redshifts, is necessary if we are to obtain a large database of values). Fig. 16 shows a histogram of our data for NLRGs (plus 3C 123 and 3C 293) with cm-2 superposed on the column densities of candidate type 2 quasars (selected on the basis that erg s-1 and cm-2) from the COSMOS survey (Mainieri et al. in prep.)333We use these unpublished data because of the large number of obscured objects that have been detected; we note that the distributions of the COSMOS objects are in good qualitative agreement with the published results of other surveys, e.g. Tajer et al. (2007). The most striking result here is the almost complete absence of absorbed radio-loud sources with low column densities (less than a few cm-2), a difference that is clearly significant on a Kolmogorov-Smirnov test. This is very hard to explain as a selection effect, since the plot includes all the NLRGs with measured values. The handful of NLRGs with no measured values are clearly not enough to make up for the discrepancy. Although some (about 1/4) of the NLRGs in our sample would not have passed the luminosity selection applied to the COSMOS objects, it is hard to see how this could significantly affect the results. Similarly, although the X-ray selection of the COSMOS objects does imply some bias away from heavily obscured objects, very large numbers of objects would have had to be missed in order to make the true distribution of type 2 quasars match that of the radio galaxies. Because the COSMOS sample extends to high redshifts, they include some high-column density objects whose we would not have been able to measure (see discussion of 3C 244.1, above) but this cannot account for the difference in distributions either, as we can see by restricting the comparison to the COSMOS objects (Fig. 16, bottom panel). The only difference would seem to be radio luminosity; while some of the COSMOS objects have radio detections, the maximum radio luminosity in the sample is 2-3 orders of magnitude below that found in 3CRR objects, and most are radio-quiet. Accordingly we propose that this is a real physical difference between the populations of radio- and X-ray selected type 2 quasars; at least the most luminous radio-loud objects (as represented by the 3CRR sample) have significantly higher obscuring column densities than the population as a whole. This could have implications for the nature of the cold accreting material in the powerful 3CRR objects. More detailed analysis must await the availability of full data on the COSMOS objects or other large samples of X-ray selected type 2 quasars.
Our column density distribution for the 3CRR objects may also be compared to the work on nearby Seyferts by e.g. Risaliti, Maiolino & Salvati (1999) or Cappi et al. (2006). Although the sample sizes of these papers are generally small, the selection criteria are more similar to those we employ, since they involve X-ray spectroscopic observations of samples selected at other wavebands. Statistical comparisons here are difficult, since there are many Compton-thick low-luminosity Seyferts (1/3 or more of Seyfert 2s; Cappi et al. 2006), implying lower limits on the X-ray-measured values, whereas (as we argue above) few radio galaxies for which data are available are Compton-thick. Qualitatively it seems that the distribution of measured values for 3CRR objects, peaking at a few cm-2 is similar to the measured distribution determined by Risaliti et al. (1999) for objects denoted ‘strict Seyfert 2s’. However, the Seyfert population as a whole, including Seyfert 1s and intermediate Seyfert types, shows a continuous distribution of values down to values of cm-2 (Cappi et al. 2006), rather like the COSMOS quasar-2 candidates, and we clearly do not observe this in the 3CRR objects.
There is no evidence for variation in the distribution of values for the 3CRR objects with redshift. Dividing the sample with measured cm-2 at the median redshift of 0.2, there are no significant differences in the distribution on a K-S test. This is unsurprising since our NLRG sample is dominated by low-redshift objects; we do not have enough objects at high redshift and luminosity to search for cosmological or (equivalently, in this sample) luminosity evolution effects. This situation would change if the 3CRR radio galaxies with Chandra or XMM-Newton observations were included in our analysis, and we expect to return to this point in a future paper.
4.3 The unabsorbed component of the X-rays
NLRG (and some BLRG/quasar) X-ray spectra almost universally show a ‘soft excess’ over a simple absorbed power-law model, represented by the unabsorbed X-ray component described in the previous sections. This excess can usually be fitted by power-law models, although generally the statistics are quite poor and the power-law index is often unconstrained.
Three classes of model for this emission are encountered in the literature:
-
1.
It is thermal or line emission either from the IGM of the host system or from photoionized material close to the nucleus.
-
2.
It is non-thermal, power-law emission arising from the central AGN and visible to us either via scattering or in partial-covering models.
-
3.
It is non-thermal, power-law emission related not directly to the central AGN but to the unresolved nuclear jet (either from synchrotron or from inverse-Compton emission).
In model (i), we need to distinguish between thermal/line emission arising from the IGM and from material close to the nucleus. The former is expected in all observations where a spatially large aperture has to be used (i.e. essentially all XMM, ROSAT or ASCA observations of moderate-redshift radio galaxies in our sample) but of course is expected to be removed by small-aperture spectroscopy with local background subtraction, as is possible with Chandra. More interesting is the case where line emission arises on scales comparable to that of the NLR, as is known in some Seyferts even in the presence of radio jets (e.g. Evans et al. 2006b); grating spectroscopy shows that the soft X-rays can be completely dominated by emission lines from material photoionized by the AGN (e.g. Guainazzi & Bianchi 2007). In radio galaxies the clearest evidence that this can be important is seen in XMM spectroscopy of the non-3CRR BLRG 3C 445 (Sambruna, Reeves & Braito 2007) where many strong emission-line features are seen below 2 keV. Even in this model, though, a soft power-law component (represented by Sambruna et al. using a partial covering model) is required and this power-law emission dominates the soft part of the spectrum. The only argument that the soft X-ray emission is dominated by lines in a radio galaxy comes from the analysis of 3C 234 by Piconcelli et al. (2008). However, as we show in Section A.8, it is perfectly possible to obtain good fits to the XMM data on this object with models that are dominated by a power law at soft energies, while still containing line emission. The general picture that we derive from detailed individual observations of this emission-line component, i.e., that it is present in some sources but not dominant, is consistent with the observed correlation between and the [Oiii] emission-line luminosity in LERGs and NLRGs (Section 3.4); the fact that this correlation is present could be interpreted as indicating that an emission-line component of the soft X-ray spectrum is important in the population as a whole, but the fact that it is weaker than the correlation with (even in a matched sample: Table 5), while and are not correlated at all, suggests that it does not dominate the X-ray emission. Thus we can conclude that, while thermal/line emission at soft energies can be energetically important and must be considered as a contaminant of any non-thermal soft component, it remains most likely at present that all radio galaxies require a power-law component that must be understood in terms of models (ii) or (iii).
Distinguishing between models (ii) and (iii) with observations of individual sources is more difficult. The principal argument in favour of model (ii) is that partial covering/reflection models have been successfully invoked in radio-quiet systems where a jet is not present; therefore, it can be argued, invoking a jet-related X-ray emission component is disfavoured by Occam’s razor. The principal arguments in favour of model (iii) are as follows:
-
•
As shown above, in our previous work on the 3CRR Chandra/XMM dataset, and in many other papers (e.g. Worrall & Birkinshaw 1994; Edge & Röttgering 1995; Worrall 1997; Canosa et al. 1999; Hardcastle & Worrall 1999; Balmaverde et al. 2006) there is a strong correlation between the nuclear radio emission and the unabsorbed X-ray component (which extends to the optical in the case of FRI LERGs: Hardcastle & Worrall 2000). We know that the radio emission is beamed and originates in the jet, so it is very hard to escape from a model in which the X-ray does likewise. The unabsorbed component is not significantly correlated with total radio power (Fig. 2) and in general very poorly correlated with other indicators of total AGN power where available (e.g. Fig. 9) which is consistent with the idea that it is strongly related to beaming.
- •
-
•
At least in low-power/low-excitation radio galaxies, a beamed component of X-ray emission is required for unification with BL Lac objects to operate, and the level of the observed component in radio galaxies is in agreement with widely accepted effective beaming speeds in unified models (Hardcastle et al. 2003). Similarly, a jet-related component of the X-ray emission in core-dominated quasars is required to explain their X-ray properties, and we might expect this to be present in the X-ray spectra of the non-aligned counterparts of core-dominated quasars, the NLRGs and BLRGs/lobe-dominated quasars. FRII NLRGs lie on a radio/X-ray correlation indistinguishable from LERGs and FRIs (Fig. 4) and so it seems very natural to suggest that we are observing the same jet-related component, with the same role in unified models, in both cases.
It seems to us very hard to construct a version of models (i) or (ii) that naturally predicts the strong correlation of with beamed quantities, the generally poor correlation with unbeamed quantities, and the agreement between the properties of LERG and NLRG, that we see in large samples such as the present one; nor is it obvious how such models would be compatible with unification of either low-power or high-power radio sources. Model (iii), in our view, remains clearly the strongest. Any challenge to model (iii) must address these sample-wide results rather than showing that individual objects may be modelled in some other way.
4.4 Interpreting the ‘fundamental plane’ of black-hole activity
Recently two independent groups (Merloni, Heinz & di Matteo 2003; Falcke, Körding & Markoff 2004) have presented evidence for a link between the accretion and jet properties of stellar-mass (XRB/microquasar) and supermassive (AGN) black hole systems, in the form of a non-linear relationship between black hole mass, X-ray and radio core luminosity, defining what has become known as the ‘fundamental plane’ of black-hole activity. The ability to extrapolate from the properties of Galactic black-hole systems, where exquisitely detailed timing studies are possible, to those of powerful AGN would be of great value in our understanding of both classes of object.
However, in deciding where radio-loud AGN should lie on the fundamental plane plot, great care must be taken to compare like with like. We know from the work described above that the nuclear X-ray luminosity of radio-loud AGN has two components, one related to the jet, the other (present only in some systems) related to a luminous accretion disc. Depending on the type of object being considered, one or the other may dominate, or both may contribute more or less equally to, the 2-10 keV X-ray luminosity used by Merloni et al. and Falcke et al. to establish the fundamental plane relationship (a point also made by Körding, Falcke & Corbel 2006). In fact, the two groups took rather different approaches to their selection of AGN: Falcke et al. used AGN where they believed the X-ray emission to be jet-dominated (including FRI radio galaxies and BL Lac objects) while Merloni et al. explicitly excluded jet-dominated systems like BL Lacs, and instead considered a rather mixed set of AGN, including Seyfert 1 and 2s and some powerful FRIIs like Cygnus A where we might expect the accretion-related X-ray component to dominate at 2-10 keV, as well as some FRIs where the present work shows that the jet-related component is the only one present. This choice is the key to the interpretation of the ‘fundamental plane’ relationship: is it telling us about the nature of jets (as Falcke et al. 2004 would suggest) or about the relationship between accretion power and jet production (as considered by Merloni et al. 2003)?
Our data on powerful radio galaxies can help to resolve these questions. NLRGs in particular offer us a very useful tool to distinguish between the two possible interpretations, since they appear to have both powerful jets and radiatively efficient accretion (see H07), and the X-ray data allow us to separate the two contributions to (see Section 4.3). Unfortunately, what we lack for these objects is good black-hole mass determinations. For want of anything better, we adopt the same approach in this paper as we did in H07, and use the Marconi & Hunt (2003) relationship between K-band absolute magnitude and , taking the K-band luminosities of 3CRR objects either from Willott et al. (2003) or from 2MASS. This allows us to plot LERGs and NLRGs on the ‘fundamental plane’ relation, albeit with large uncertainties given the scatter in the – relationship. (BLRGs and quasars are excluded since their black-hole masses cannot be estimated in this way.)
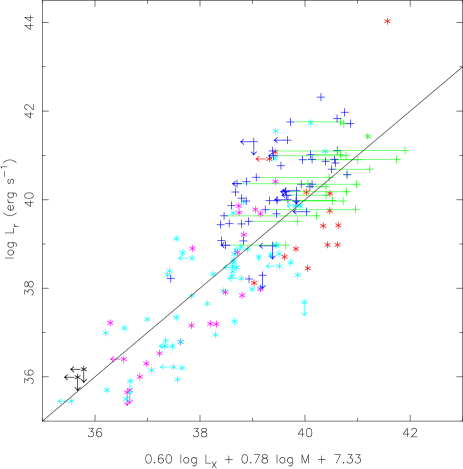
Fig. 17 shows the 3CRR sources with appropriate data plotted on a plane equivalent to that of Merloni et al. (2003)’s fig. 5. For the 29 objects (mostly LERGs) where we have only a single unabsorbed luminosity measurement, we take this to be and plot a single point. For the 22 objects (mostly NLRGs) with an estimated and a measured ‘accretion-related’ X-ray luminosity, , we compute using both quantities and plot the two results joined by a horizontal line. (For clarity, and for consistency with other treatments of the fundamental plane, no error bars are plotted.) It is clear that the choice of value makes a significant difference to the answers obtained. The best-fitting relation of Merloni et al. lies significantly closer to the points denoting the accretion-related luminosities than it does to the jet-related luminosities; the latter, almost without exception, lie above and to the left of the regression line. Given that the AGN in the analysis of Merloni et al. are dominated by Seyferts and quasars, which we would expect to show mostly accretion-related emission, this is not at all surprising. The Merloni et al. (2003) version of the fundamental plane involves an accretion and not a jet origin for the X-rays.
What is slightly more surprising is that the version of the fundamental plane relationship fitted to low-hard state XRB, LLAGN and FRI radio galaxies by Körding et al. (2006), which was explicitly intended to provide information about the nature of jets, fares no better at predicting the level of the jet-related X-ray emission of the LERGs (including most 3CRR FRIs) and NLRGs in our current sample (Fig. 18). Körding et al. used X-ray luminosities extrapolated from the optical rather than directly measured X-ray luminosities for the FRIs to which they fit their fundamental plane relations, on the basis that the X-ray emission from FRI nuclei may partly or wholly be inverse-Compton rather than synchrotron in origin. However, it is clear that this extrapolation from the optical must give X-ray flux densities which substantially exceed the true ones.
We conclude that systems where the jet and accretion-related emission can be separated give us a clear indication that the fundamental plane relationship as currently derived is a consequence of a relationship between accretion power and jet power, rather than arising purely from the nature of relativistic jets. This has the consequence that jet-dominated objects, such as FRI radio galaxies and BL Lac objects, should not be included in fits that attempt to derive parameters of the fundamental plane, and care should also be taken in using objects, such as NLRGs, that may contain a substantial contribution from the jet in the X-ray spectrum. The ‘fundamental plane conspiracy’ identified by Körding et al. (2006) – in which objects with clearly different X-ray emission processes tend to lie close to the fundamental plane – is more easily understood if the fundamental plane relation originates in accretion. Even for jet-dominated objects, the X-ray emission represents a fraction of the total (invisible) accretion power which, we infer, is not vastly different from the fraction represented by accretion-related X-ray emission (Fig. 6).

5 Summary and outlook
We have analysed new and archival X-ray and infra-red data to produce the most complete database yet of nuclear luminosities for the 3CRR (LRL) sample of radio-loud active galaxies. Our principal results may be summarized as follows:
-
1.
As in all our (and others’) previous work on the subject, we have found a good correlation between the unabsorbed component of X-ray luminosity, present in essentially every radio source, and the 5-GHz core radio luminosity (Section 3.1). We argue in Section 4.3 that the evidence that at least some, and in many cases all, of this soft component of radio-source X-ray spectra originates in the jet is now very hard to evade, although we do not rule out an additional significant role for unresolved X-ray emission-line material (either photoionized by the AGN or shock-ionized by the jet) as seen in detailed observations of some powerful FRIIs.
-
2.
Using the new infra-red data (Section 3.3), we have shown that it is very unlikely that low-excitation FRII radio galaxies can be heavily obscured (e.g. Compton-thick) normal AGN (Section 4.1). This closes a loophole in the argument of H06 regarding these objects: they must really have active nuclei that are either radiatively efficient, but intrinsically much fainter than their radio luminosity would imply, or radiatively inefficient. For low-power FRIs we cannot make such a definite statement because of contamination of the Spitzer spectra by extended emission, although individual sources have been discussed by others (e.g. Whysong & Antonucci 2004) with the same conclusions.
-
3.
On the other hand, we have shown (Section 3.3) that the heavily absorbed nuclear X-ray component, present in the vast majority of NLRG FRIIs in our sample, is very well correlated with the 15-m mid-IR luminosity from Spitzer. One case where there is no absorbed nuclear X-ray emission but strong IR emission is to our knowledge the best candidate so far for a Compton-thick NLRG (Section 4.2). The fraction of Compton-thick NLRGs is clearly significantly lower than that of Compton-thick local Seyferts, while the radio galaxies’ column density distribution is inconsistent with that of X-ray-selected type 2 quasars in the sense of having many objects with relatively high column densities. The reason for the differences in these column density distributions remains unclear.
-
4.
We argue that the X-ray and IR data taken together are not consistent with the simplest possible models of the IR emission from a receding torus (Section 3.5).
-
5.
Our discussion of the positioning of radio galaxies on the fundamental plane relationships of Merloni et al. (2003) and Falcke et al. (2004), presented in Section 4.4, suggests that this relationship is primarily related to accretion rather than to properties of the jets. Accordingly, care should be taken to use only accretion-related quantities when constructing such plots.
Although the 3CRR sample continues to suffer from incomplete observations and bias at all non-radio wavebands, we have shown in this paper that there has been a huge advance in the availability of X-ray data of sufficient quality to allow nuclear spectroscopy over the past few years, allowing significant advances in our ability to draw scientific conclusions. Considering the whole 3CRR sample (including objects not discussed in the present paper) the fraction of objects observed already significantly exceeds the fraction observed by ROSAT at the end of its lifetime (Hardcastle & Worrall 1999). There is a realistic prospect of being able to carry out unbiased, complete studies of the nuclei of these objects by the end of the Chandra and XMM missions; we and others have recently been awarded observations which will go a long way towards providing the necessary X-ray data, particularly at and . Unfortunately, the short lifetime of Spitzer prevents the same statement being made for the crucial mid-IR waveband, but far-IR observations with Herschel will provide important further constraints on models.
Acknowledgements
MJH thanks the Royal Society for a research fellowship. DAE acknowledges partial financial support from the NASA XMM-Newton GO program, through grants NNX07AQ52G and NNX08AX30G. We are very grateful to Vincenzo Mainieri for providing data on the COSMOS sample of X-ray-selected type 2 quasars in advance of publication, to Elmar Körding for discussion of the fundamental plane relation, to Matt Jarvis for discussion of the expectations from receding-torus models, and to Chiranjib Konar for allowing us to use XMM data on 3C 457 obtained for another purpose in this paper. We thank an anonymous referee for helpful comments on the paper. This work is partly based on observations obtained with XMM-Newton, an ESA science mission with instruments and contributions directly funded by ESA Member States and the USA (NASA).
Appendix A Notes on individual sources
Here we discuss any interesting features of previously unreported X-ray spectra, and give references to previous analyses.
A.1 3C6.1
Tabulated Chandra observing time here combines two observations taken on 2002 Aug 26 and 2002 Oct 15. There is no evidence for variation in the nuclear X-ray flux over this time period.
A.2 3C 48
A detailed analysis of the Chandra data for this quasar is given by Worrall et al. (2004). For simplicity here we fit a single power-law model which gives an adequate estimate of the total X-ray luminosity of the source.
A.3 3C 76.1
Details of the XMM analysis for this FRI radio galaxy are given by Croston et al. (2008).
A.4 3C 132
The short Chandra exposure of this source required us to bin the spectrum by a factor of 10, rather than our usual 20, in order to obtain enough bins for spectral fitting.
A.5 3C 171
Full details of the long Chandra observation of this object will be presented in a future paper (Hardcastle, Harris & Massaro in prep.).
A.6 3C 220.1
The Chandra data for this object were previously analysed by Worrall et al. (2001).
A.7 3C 228
Tabulated Chandra observing time here combines two observations taken on 2001 Apr 23 and 2001 Jun 03. There is no evidence for variation in the nuclear X-ray flux over this time period.
The evidence for an absorbed nuclear X-ray component in this source is marginal. Adding a second component to the fit clearly improves it, and the normalization of the second component is not consistent with zero at the 90 per cent confidence level: however, the column density of the intrinsic absorber is not constrained (Table 4.2). Accordingly there is a large uncertainty on the luminosity of the absorbed component.
A.8 3C 234
3C 234 is a NLRG that famously shows polarized broad emission lines in the optical (Antonucci 1982; Antonucci & Barvainis 1990); thus it is one of only a few objects to show unambiguous optical evidence for the presence of the ‘hidden quasar’ predicted by unified models. The long XMM-Newton observation of 3C 234 has been analysed by Piconcelli et al. (2008), who argue that there are strong soft emission lines in the spectrum and therefore that the soft excess in this object cannot be jet-related (see Section 4.3). We extracted spectra from the data in the standard way, fitting as usual in the well-calibrated 0.3-8.0 keV band, and confirm that our standard model (one power law with Galactic absorption only, one power law with Galactic and intrinsic absorption, and a Gaussian representing the Fe K feature) does not give an acceptable fit to the data: there are significant residuals at soft energies (Fig. 19). However, we find an acceptable fit ( for 320 degrees of freedom) if we add a single MEKAL model to the data, and a good fit ( for 318 degrees of freedom) with two MEKAL components, having and keV (with fixed abundances of 0.35 solar). The addition of the MEKAL models not only removes the soft residuals but also reduces those at the crossover between the two power laws at keV. Crucially, in these models, the power-law component dominates the soft X-ray emission from 3C 234, providing 60 per cent of the X-ray flux between 0.5 and 2.0 keV in the two-MEKAL model, while there is no evidence for soft residuals in the fit (Fig. 19). In other words, we find that the power-law component does dominate at such energies, and so the majority of the soft X-ray emission in 3C 234 can be associated with the jet. Indeed, we note that the temperature of one of the MEKAL models fitted by Piconcelli et al. is 8 keV, which effectively mimics a power law. We therefore cannot agree with their rejection of jet-related models for the soft excess in 3C 234 or in radio-loud AGN in general, as discussed in more detail in Section 4.3.


It is still of interest to ask whether these MEKAL models are physically realistic and, if so, what their physical origin is. As our 25-arcsec extraction circle has a radius of 70 kpc at the redshift of 3C 234, one obvious possibility is thermal emission from the large-scale environment. The bolometric X-ray luminosities of the two MEKAL models are erg s-1 (soft) and erg s-1 (hard) though of course most of the luminosity of the softer MEKAL ( keV) is emitted outside the XMM band and so is not directly observed. The hotter of the two MEKAL models is therefore entirely consistent in temperature and luminosity terms with being thermal emission from the IGM of a poor group environment (e.g. Helsdon & Ponman 2000) as has been observed for other NLRGs (e.g. Hardcastle et al. 2007b). However, the very luminous, soft MEKAL component certainly cannot have this origin: it may well arise from AGN-photoionized gas as suggested by Piconcelli et al. A deep Chandra observation of this system would have the capability to resolve some or all of the components seen here and so show which of them are truly associated with the active nucleus. Alternatively, it may be that the spectrum of 3C 234 is similar to that of 3C 445 (Sambruna et al. 2007) and would be better modelled with a combination of numerous emission lines arising from scattering from warm gas.
For consistency with our earlier fitting the results presented in the main body of the paper are those derived from the model with only one additional MEKAL component, which gives an acceptable fit to the data. The derived parameters for the two power-law components are very little affected by the addition of the second component.
A.9 3C 244.1
The XMM-Newton data for this source were unfortunately very badly affected by flaring, leaving us with only a short exposure time even after increasing our usual flare filtering threshold. The background-subtracted data were binned by a factor 10 to allow model fitting. However, we obtain very similar fits (including a very similar upper limit on the heavily absorbed component) if we fit to data which has not been flare-filtered at all, so we are confident that the unusually strong limit on this component is not an artefact of the low count rate in the filtered data. Neither a heavily absorbed power-law component nor an Fe K line are seen in the X-ray data.
A.10 3C 300
The XMM observations were taken in three roughly equal parts, on 28 Dec 2007, 30 Dec 2007, and 01 Jan 2008. There is no evidence for nuclear X-ray variability in this period. The data were affected by flaring but as they were originally quite deep the constraints on any absorbed nuclear component are good.
A.11 3C 325
Tabulated Chandra observing time here combines two observations taken on 2005 Apr 14 and 2002 Apr 17. There is no evidence for variation in the nuclear X-ray flux over this time period.
A.12 3C 349
Two XMM observations were carried out for this source, on 2007 Aug 07 and 2007 Oct 03. There was no evidence for variability in the data, and so the results tabulated come from a joint fit to the two datasets. The best-fitting column density for the obscured component is unusually low for a NLRG.
A.13 3C 381
3C 381 is classed as a BLRG in LRL, but as pointed out by Hardcastle et al. (1997) the evidence for this classification is very tenuous. Jackson & Rawlings (1997) classify it as a NLRG, based on the spectroscopy of Saunders et al. (1989), whose published spectrum shows no evidence for broad H. Our X-ray spectrum gives a well-constrained, high absorbing column. We infer that the classification of this source as a BLRG by LRL is likely to have been incorrect. For consistency, we retain its BLRG classification in the plots and tables in the present paper.
A.14 3C 433
The Chandra data for this object have been presented by Miller & Brandt (2009).
A.15 3C 442A
X-ray data for 3C 442A are as described by Hardcastle et al. (2007). This source is known to be variable in the X-ray: we use the X-ray data from the 2005 Jul 27 observation. As discussed by Hardcastle et al. (2007), intrinsic absorption may explain the flat photon index we obtain, but for consistency we use the Galactic value here.
A.16 3C 457
Details of the deep XMM observation of this object will be presented by Konar et al. (2009). The very flat photon index for the soft component probably indicates some excess absorption over the Galactic value used here; this issue will be discussed in more detail by Konar et al.
References
- [] Akritas, M.G., Siebert, J., 1996, MNRAS, 278, 919
- [] Antonucci, R., 1982, Nat, 299, 605
- [] Antonucci, R., 1993, ARA&A, 31, 473
- [] Antonucci, R., Barvainis, R., 1990, ApJ, 363, L17
- [] Balmaverde, B., Capetti, A., Grandi, P., 2006, A&A, 451, 35
- [] Balmaverde, B., Baldi, R.D., Capetti, A., 2008, A&A, 486, 119
- [] Barthel, P.D., 1989, ApJ, 336, 606
- [] Barthel, P.D., 1994, in Bicknell G.V., Dopita M.A., Quinn P.J., eds, The First Stromlo Symposium: the Physics of Active Galaxies, ASP Conference Series vol. 54, San Francisco, p. 175
- [] Bassani, L., et al., 2006, ApJ, 636, L65
- [] Belsole, E., Worrall, D.M., Hardcastle, M.J., 2006, MNRAS, 336, 339
- [] Best, P.N., Kaiser, C.R., Heckman, T.M., Kauffmann, G., 2006, MNRAS, 368, L67
- [] Bicknell, G.V., 1995, ApJS, 101, 29
- [] Blundell, K.M., Rawlings, S., 2001, ApJ, 562, L5
- [] Canosa, C.M., Worrall, D.M., Hardcastle, M.J., Birkinshaw, M., 1999, MNRAS, 310, 30
- [] Cappi, M., et al., 2006, A&A, 446, 459
- [] Chiaberge, M., Capetti, A., Celotti, A., 2002, A&A, 394, 791
- [] Cleary, K., Lawrence, C.R., Marshall, J.A., Hao, L., Meier, D., 2007, ApJ, 660, 117
- [] Croston, J.H., Hardcastle, M.J., Birkinshaw, M., Worrall, D.M., Laing, R.A., 2008, MNRAS, 386, 1709
- [] Dicken, D., et al., 2008, ApJ in press (arXiv:0810.5675)
- [] Edge, A.C., Röttgering, H., 1995, MNRAS, 277, 1580
- [] Evans, D.A., Worrall, D.M., Hardcastle, M.J., Kraft, R.P., Birkinshaw, M., 2006a, ApJ, 642, 96
- [] Evans, D.A., Lee, J.C., Kamanetska, M., Gallagher, S.C., Kraft, R.P., Hardcastle, M.J., Weaver, K.A., 2006b, ApJ, 653, 1121
- [] Evans, D.A., Hardcastle, M.J., Lee, J.C., Kraft, R.P., Worrall, D.M., Birkinshaw, M., Croston, J.H., 2008, ApJ, 688, 844
- [] Falcke, H., Körding, E., Markoff, S., 2004, A&A, 414, 895
- [] Fanaroff, B.L., Riley, J.M., 1974, MNRAS, 167, 31P
- [] Fillipenko, A.V., Sargent, W.L.W., 1985, ApJS, 57, 503
- [] Gandhi, P., Horst, H., Smette, A., Hoenig, S., Comastri, A., Gilli, R., Vignali, C., Duschl, W., 2009, A&A in press, arXiv:0902.2777
- [] Ghisellini, G., Maraschi, L., 1989, ApJ, 340, 181
- [] Guainazzi, M., Bianchi, S., 2007, MNRAS, 374, 1290
- [] Haas, M., Willner, S.P., Heymann, F., Ashby, M.L.N., Fazio, G.G., Wilkes, B.J., Chini, R., Siebenmorgen, R., 2008, ApJ, 688, 122
- [] Hardcastle, M.J., 2004, A&A, 414, 927
- [] Hardcastle, M.J., Worrall, D.M., 1999, MNRAS, 309, 969
- [] Hardcastle, M.J., Worrall, D.M., 2000, MNRAS, 314, 359
- [] Hardcastle, M.J., Alexander, P., Pooley, G.G., Riley, J.M., 1997, MNRAS, 288, 859
- [] Hardcastle, M.J., Worrall, D.M., Birkinshaw, M., Laing, R.A., Bridle, A.H., 2002, MNRAS, 334, 182
- [] Hardcastle, M.J., Evans, D.A., Croston, J.H., 2006, MNRAS, 370, 1893 [H06]
- [] Hardcastle, M.J., Evans, D.A., Croston, J.H., 2007a, MNRAS, 376, 1849 [H07]
- [] Hardcastle, M.J., Kraft, R.P., Worrall, D.M., Croston, J.H., Evans, D.A., Birkinshaw, M., Murray, S.S., 2007b, ApJ, 662, 166
- [] Hardcastle, M.J., Sakelliou, I., Worrall, D.M., 2005, MNRAS, 359, 1007
- [] Hardcastle, M.J., Worrall, D.M., Birkinshaw, M., Canosa, C.M., 2003, MNRAS, 338, 176
- [] Heckman, T.M., Chambers, K.C., Postman, M., 1992, ApJ, 391, 39
- [] Helsdon, S.F., Ponman, T.J., 2000, MNRAS, 315, 356
- [] Hes, R., Barthel, P.D., Fosbury, R.A.E., 1993, Nat, 362, 326
- [] Hes, R., Barthel, P.D., Hoekstra, H., 1995, A&A, 303, 8
- [] Hine, R.G., Longair, M.S., 1979, MNRAS, 188, 111
- [] Jackson, N., Browne, I.W.A., 1990, Nat, 343, 43
- [] Jackson, N., Rawlings, S., 1997, MNRAS, 286, 241
- [] Körding, E., Falcke, H., Corbel, S., 2006, A&A, 456, 439
- [] Laing, R.A., Jenkins, C.R., Wall, J.V., Unger, S.W., 1994, in Bicknell G.V., Dopita M.A., Quinn P.J., eds, The First Stromlo Symposium: the Physics of Active Galaxies, ASP Conference Series vol. 54, San Francisco, p. 201
- [] Laing, R.A., Riley, J.M., Longair, M.S., 1983, MNRAS, 204, 151 [LRL]
- [] Lawrence, C.R., Zucker, J.R., Readhead, A.C.S., Unwin, S.C., Pearson, T.J., Xu, W., 1996, ApJS, 107, 541
- [] Marconi, A., Hunt, L.K., 2003, ApJ, 589, L21
- [] Merloni, A., Heinz, S., Di, Matteo, T., 2003, MNRAS, 345, 1057
- [] Miller, B.P., Brandt, W.N., 2009, ApJ in press, arXiv:0901.0925
- [] Ogle, P., Whysong, D., Antonucci, R., 2006, ApJ, 647, 161
- [] Orr, M.J.L., Browne, I.W.A., 1982, MNRAS, 200, 1067
- [] Padovani, P., Urry, M., 1992, ApJ, 387, 449
- [] Piconcelli, E., Bianchi, S., Miniutti, G., Fiore, F., Guainazzi, M., Jimenez-Bailon, E., Matt, G., 2008, A&A, 480, 671
- [] Rawlings, S., Saunders, R., 1991, Nat, 349, 138
- [] Rector, T.A., Stocke, J.T., 2001, AJ, 122, 565
- [] Risaliti, G., Maiolino, R., Salvati, M., 1999, ApJ, 522, 157
- [] Sambruna, R.M., Reeves, J.N., Braito, V., 2007, ApJ, 665, 1030
- [] Saunders, R., Baldwin, J.E., Rawlings, S., Warner, P.J., Miller, L., 1989, MNRAS, 238, 777
- [] Scheuer, P.A.G., Readhead, A.C.S., 1979, Nat, 277, 182
- [] Simpson, C., 1998, MNRAS, 297, L39
- [] Tadhunter, C.N., Morganti, R., Robinson, A., Dickson, R., Villar-Martin, M., Fosbury, R.A.E., 1998, MNRAS, 298, 1035
- [] Tajer, M., et al., 2007, A&A, 467, 73
- [] Tasse, C., Best, P.N., Röttgering, H., Le Borgne, D., 2008, A&A in press
- [] Urry, C.M., Padovani, P., 1995, PASP, 107, 803
- [] Urry, C.M., Padovani, P., Stickel, M., 1991, ApJ, 382, 501
- [] van Breugel, W., Heckman, T., Butcher, H., Miley, G., 1984, ApJ, 277, 82
- [] Weedman, D.W., et al., 2005, ApJ, 633, 706
- [] Whysong, D., Antonucci, R., 2004, ApJ, 602, 116
- [] Willott, C.J., Rawlings, S., Blundell, K.M., Lacy, M., 1999, MNRAS, 309, 1017
- [] Willott, C.J., Rawlings, S., Jarvis, M.J., Blundell, K., 2003, MNRAS, 339, 173
- [] Worrall, D.M., 1997, in Ostrowski M., Sikora M., Madjeski G., Begelman M., eds, Relativistic jets in Active Galactic Nuclei, Astronomical Observatory of the Jagiellonian University, Cracow, p. 20 (astro-ph/9709165)
- [] Worrall, D.M., Birkinshaw, M., 1994, ApJ, 427, 134
- [] Worrall, D.M., Birkinshaw, M., Hardcastle, M.J., Lawrence, C.R., 2001, MNRAS, 326, 1127
- [] Worrall, D.M., Giommi, P., Tananbaum, H., Zamorani, G., 1987, ApJ, 313, 596
- [] Worrall, D.M., Hardcastle, M.J., Pearson, T.J., Readhead, A.C.S., 2004, MNRAS, 347, 632
| Source | Type | |||||||||||||
|---|---|---|---|---|---|---|---|---|---|---|---|---|---|---|
| 4C 12.03 | E | 0.156 | 42.10 | 40.00 | 41.91 | – | – | 43.02 | – | – | – | – | 40.97 | – |
| 3C 6.1 | N | 0.8404 | 43.87 | 41.61 | 44.92 | 44.89 | 44.94 | 44.17 | – | – | 45.100 | 0.010 | – | 42.15 |
| 3C 16 | E | 0.405 | 43.09 | 39.73 | 42.74 | – | – | 43.69 | – | – | – | – | – | 41.81 |
| 3C 19 | N | 0.482 | 43.25 | 40.14 | – | – | – | – | – | – | – | – | – | – |
| 3C 20 | N | 0.174 | 42.82 | 39.97 | 42.56 | 42.45 | 42.64 | 44.05 | 43.94 | 44.44 | 44.293 | 0.004 | 41.21 | 40.73 |
| 3C 22 | B | 0.938 | 43.96 | 41.95 | – | – | – | – | – | – | 45.900 | 0.010 | – | 43.16 |
| 3C 28 | E | 0.1952 | 42.54 | 38.96 | 41.36 | – | – | 42.27 | – | – | 42.740 | – | 40.96 | 41.81 |
| 3C 31 | E | 0.0167 | 40.31 | 39.45 | 40.67 | 40.52 | 40.79 | 40.72 | – | – | 42.341 | 0.002 | 39.47 | – |
| 3C 33 | N | 0.0595 | 41.95 | 39.98 | 42.04 | 41.98 | 42.09 | 43.80 | 43.73 | 43.87 | 44.080 | 0.012 | 42.19 | 41.44 |
| 3C 33.1 | B | 0.181 | 42.34 | 40.68 | 42.43 | 42.14 | 42.59 | 44.38 | 44.26 | 44.66 | 44.878 | 0.002 | 42.30 | – |
| 3C 34 | N | 0.689 | 43.70 | 40.80 | – | – | – | – | – | – | – | – | – | 43.61 |
| 3C 35 | E | 0.0677 | 41.35 | 39.77 | – | – | – | – | – | – | – | – | 40.03 | – |
| 3C 41 | N | 0.795 | 43.66 | 40.72 | – | – | – | – | – | – | – | – | – | 42.70 |
| 3C 42 | N | 0.395 | 43.07 | 40.67 | – | – | – | – | – | – | – | – | 42.04 | 41.89 |
| 3C 46 | N | 0.4373 | 43.16 | 40.75 | – | – | – | – | – | – | – | – | 42.80 | 42.22 |
| 3C 47 | Q | 0.425 | 43.52 | 42.23 | 45.01 | 44.97 | 45.04 | 45.05 | 44.77 | 45.21 | 45.805 | 0.004 | 43.28 | 42.63 |
| 3C 48 | Q | 0.367 | 43.64 | 43.18 | 45.00 | 45.00 | 45.01 | 45.00 | 45.00 | 45.01 | 46.145 | 0.002 | 43.12 | 42.25 |
| 3C 49 | N | 0.6207 | 43.44 | 41.54 | – | – | – | – | – | – | – | – | – | – |
| 3C 55 | N | 0.735 | 44.02 | 41.57 | – | – | – | – | – | – | 45.820 | 0.013 | – | 42.34 |
| 3C 61.1 | N | 0.186 | 42.76 | 40.00 | 41.92 | 41.58 | 42.10 | 43.93 | 43.74 | 44.10 | 43.700 | 0.030 | 42.49 | 41.44 |
| 3C 66B | E | 0.0215 | 40.69 | 39.97 | 41.10 | 41.03 | 41.15 | 40.64 | – | – | 42.008 | 0.004 | 40.06 | 39.87 |
| 3C 67 | B | 0.3102 | 42.73 | 40.82 | – | – | – | – | – | – | – | – | 42.83 | 42.26 |
| 3C 76.1 | E | 0.0324 | 40.75 | 39.07 | 41.28 | 41.05 | 41.47 | 41.26 | – | – | 41.966 | 0.017 | 39.85 | – |
| 3C 79 | N | 0.2559 | 43.07 | 40.90 | 42.42 | 42.34 | 42.49 | 44.18 | 43.65 | 44.75 | 45.326 | 0.004 | 42.86 | 42.21 |
| 3C 83.1B | E | 0.0255 | 40.88 | 39.46 | 41.13 | 41.03 | 41.21 | 40.42 | – | – | 42.205 | 0.004 | – | – |
| 3C 84 | N | 0.0177 | 40.92 | 42.32 | 42.91 | 42.88 | 42.94 | 41.77 | – | – | 44.217 | – | 41.62 | 41.09 |
| 3C 98 | N | 0.0306 | 41.29 | 38.97 | 40.82 | – | – | 42.73 | 42.44 | 42.83 | – | – | 41.02 | 40.24 |
| 3C 109 | B | 0.3056 | 43.08 | 42.48 | 45.23 | 45.18 | 45.29 | 45.23 | 44.60 | 45.29 | 45.975 | 0.001 | 43.32 | 42.09 |
| 4C 14.11 | E | 0.206 | 42.41 | 41.18 | 43.01 | 42.94 | 43.07 | 42.78 | – | – | – | – | 41.24 | – |
| 3C 123 | E | 0.2177 | 43.68 | 41.76 | 42.00 | 41.05 | 42.27 | 43.58 | 43.36 | 43.68 | 43.810 | 0.067 | 42.00 | – |
| 3C 132 | N | 0.214 | 42.52 | 40.10 | 41.99 | – | – | 43.25 | 43.04 | 43.40 | – | – | – | – |
| 3C 138 | Q | 0.759 | 43.92 | 42.85 | – | – | – | – | – | – | 45.800 | 0.010 | 43.46 | 42.57 |
| 3C 147 | Q | 0.5450 | 44.04 | 43.98 | – | – | – | – | – | – | 45.500 | 0.010 | 43.79 | 43.45 |
| 3C 153 | N | 0.2769 | 42.82 | 40.20 | 41.99 | – | – | 42.89 | – | – | 43.590 | 0.097 | 41.64 | 42.49 |
| 3C 171 | N | 0.2384 | 42.80 | 40.18 | 41.86 | 41.69 | 41.98 | 44.08 | 43.96 | 44.18 | – | – | 42.89 | 42.45 |
| 3C 172 | N | 0.5191 | 43.46 | 40.17 | – | – | – | – | – | – | 44.310 | 0.062 | – | 42.77 |
| 3C 173.1 | E | 0.292 | 42.90 | 40.89 | 41.55 | 41.34 | 41.69 | 43.13 | – | – | 43.400 | 0.079 | 40.85 | – |
| 3C 175 | Q | 0.768 | 43.96 | 42.26 | – | – | – | – | – | – | 45.700 | 0.010 | 43.10 | 42.77 |
| 3C 175.1 | N | 0.920 | 43.95 | 42.09 | – | – | – | – | – | – | – | – | – | 42.67 |
| 3C 184 | N | 0.994 | 44.08 | 40.41 | 43.48 | 42.48 | 43.95 | 44.76 | 44.57 | 44.90 | 45.300 | 0.010 | – | 42.89 |
| 3C 184.1 | N | 0.1187 | 41.95 | 39.99 | 41.73 | 41.45 | 41.89 | 43.91 | 43.70 | 44.22 | – | – | 42.23 | 41.48 |
| DA240 | E | 0.0356 | 41.08 | 40.17 | 40.81 | 40.73 | 40.87 | 41.05 | – | – | – | – | 39.76 | 40.04 |
| 3C 192 | N | 0.0598 | 41.54 | 39.51 | 41.37 | 41.18 | 41.49 | 42.93 | 42.74 | 43.12 | 42.710 | 0.028 | 41.36 | 41.31 |
| 3C 196 | Q | 0.871 | 44.63 | 41.84 | – | – | – | – | – | – | 46.000 | 0.010 | – | – |
| 3C 200 | E | 0.458 | 43.21 | 41.97 | 43.58 | 43.52 | 43.64 | 43.78 | – | – | 44.100 | 0.010 | – | – |
| 4C 14.27 | N | 0.3920 | 43.05 | 39.68 | – | – | – | – | – | – | – | – | – | – |
| 3C 207 | Q | 0.684 | 43.71 | 43.49 | 45.14 | 45.06 | 45.19 | 45.14 | 45.06 | 45.19 | 45.500 | 0.010 | 43.05 | 42.15 |
| 3C 215 | Q | 0.411 | 43.13 | 41.54 | 44.84 | 44.81 | 44.87 | 44.84 | 44.46 | 44.87 | – | – | 42.59 | 42.22 |
| 3C 217 | N | 0.8975 | 43.88 | 40.80 | – | – | – | – | – | – | – | – | – | 43.29 |
| 3C 216 | Q | 0.668 | 43.84 | 43.78 | – | – | – | – | – | – | 45.700 | 0.010 | 42.46 | 42.43 |
| 3C 219 | B | 0.1744 | 42.82 | 41.26 | 43.99 | 43.94 | 44.04 | 43.99 | 43.94 | 44.04 | 44.210 | 0.016 | 41.77 | 41.27 |
| 3C 220.1 | N | 0.61 | 43.66 | 42.08 | 44.50 | 44.48 | 44.52 | 44.04 | – | – | 44.700 | 0.010 | 42.79 | 42.46 |
| 3C 220.3 | N | 0.685 | 43.74 | 40.02 | – | – | – | – | – | – | 45.100 | 0.010 | – | – |
| 3C 223 | N | 0.1368 | 42.14 | 40.29 | 43.16 | 43.12 | 43.19 | 43.67 | 43.43 | 44.27 | – | – | 42.18 | 41.71 |
| 3C 225B | N | 0.58 | 43.74 | 40.68 | – | – | – | – | – | – | 44.483 | 0.129 | – | 42.62 |
| 3C 226 | N | 0.82 | 43.94 | 41.82 | – | – | – | – | – | – | 46.261 | 0.006 | – | 42.74 |
| 4C 73.08 | N | 0.0581 | 41.35 | 39.62 | 41.80 | 41.68 | 41.90 | 43.46 | 43.05 | 43.79 | – | – | 40.94 | 40.57 |
| 3C 228 | N | 0.5524 | 43.71 | 41.72 | 43.86 | 42.81 | 43.91 | 43.65 | 42.81 | 43.94 | 44.574 | 0.087 | – | 42.15 |
| 3C 234 | N | 0.1848 | 42.76 | 41.56 | 42.89 | 42.87 | 42.91 | 44.36 | 44.26 | 44.60 | 45.590 | 0.005 | 43.13 | 42.12 |
| 3C 236 | E | 0.0989 | 41.82 | 40.98 | – | – | – | – | – | – | – | – | 40.90 | 41.17 |
| 4C 74.16 | ? | 0.81 | 43.82 | 41.11 | – | – | – | – | – | – | – | – | – | – |
| 3C 244.1 | N | 0.428 | 43.39 | 40.66 | 43.25 | 43.10 | 43.35 | 42.92 | – | – | 45.130 | 0.009 | 43.03 | – |
| 3C 247 | N | 0.7489 | 43.63 | 41.41 | – | – | – | – | – | – | – | – | – | 43.01 |
| 3C 249.1 | Q | 0.311 | 42.79 | 41.93 | 44.72 | 44.57 | 44.77 | 44.74 | 44.43 | 45.04 | 45.493 | 0.001 | 43.38 | – |
| 3C 254 | Q | 0.734 | 43.96 | 42.13 | 45.32 | 45.25 | 45.40 | 45.32 | 45.25 | 45.40 | 45.600 | 0.010 | 43.71 | 43.13 |
| 3C 263 | Q | 0.652 | 43.69 | 42.94 | 45.18 | 45.12 | 45.24 | 45.18 | 45.12 | 45.24 | 45.800 | 0.010 | 43.71 | 42.90 |
| 3C 263.1 | N | 0.824 | 44.02 | 41.45 | – | – | – | – | – | – | 44.980 | 0.016 | – | 42.97 |
| 3C 264 | E | 0.0208 | 40.69 | 39.98 | 41.87 | 41.86 | 41.89 | 40.91 | – | – | 42.315 | 0.003 | 39.16 | 40.10 |
| 3C 265 | N | 0.8108 | 44.06 | 41.40 | 43.45 | 43.33 | 43.54 | 44.49 | 44.28 | 44.63 | 45.860 | 0.010 | 43.80 | 43.85 |
| 3C 268.1 | N | 0.9731 | 44.19 | 41.39 | – | – | – | – | – | – | 45.300 | 0.010 | – | 42.27 |
| 3C 268.3 | B | 0.371 | 42.92 | 40.24 | – | – | – | – | – | – | – | – | 42.49 | – |
| 3C 272.1 | E | 0.0029 | 38.84 | 38.22 | 39.35 | 39.24 | 39.46 | 39.49 | – | – | 40.964 | 0.001 | 37.98 | – |
| A1552 | E | 0.0837 | 41.59 | 40.34 | – | – | – | – | – | – | – | – | – | – |
| 3C 274 | N | 0.0041 | 40.88 | 39.87 | 40.59 | 40.56 | 40.61 | 39.56 | – | – | 41.506 | 0.003 | 38.95 | – |
| 3C 274.1 | N | 0.422 | 43.29 | 40.83 | 43.27 | 43.21 | 43.33 | 43.56 | – | – | 43.910 | – | 41.36 | – |
| 3C 275.1 | Q | 0.557 | 43.64 | 42.72 | 44.52 | 44.51 | 44.54 | 44.52 | 44.51 | 44.54 | 45.100 | 0.010 | – | 42.67 |
| 3C 277.2 | N | 0.766 | 43.81 | 40.57 | 43.67 | 43.61 | 43.72 | 43.81 | – | – | – | – | – | 43.21 |
| 3C 280 | N | 0.996 | 44.32 | 41.11 | 42.85 | 42.55 | 43.03 | 45.00 | 44.81 | 45.13 | 45.800 | 0.010 | – | 43.68 |
| 3C 284 | N | 0.2394 | 42.57 | 40.35 | 42.22 | 42.19 | 42.26 | 43.98 | 42.80 | 44.63 | – | – | 41.60 | – |
| 3C 285 | N | 0.0794 | 41.53 | 39.64 | 40.40 | 40.11 | 40.57 | 43.33 | 43.22 | 43.43 | – | – | 40.56 | 40.46 |
| 3C 286 | Q | 0.849 | 44.03 | 41.85 | – | – | – | – | – | – | 45.600 | 0.010 | – | 42.69 |
| 3C 288 | E | 0.246 | 42.81 | 41.34 | 41.41 | – | – | 42.48 | – | – | 43.250 | – | – | – |
| 3C 289 | N | 0.9674 | 43.99 | 42.11 | – | – | – | – | – | – | 45.400 | 0.010 | – | 42.57 |
| 3C 292 | N | 0.71 | 43.60 | 40.82 | 43.62 | 43.32 | 43.80 | 44.40 | 44.26 | 44.51 | 44.800 | 0.010 | – | – |
| 3C 293 | E | 0.0452 | 41.06 | 40.36 | 40.62 | – | – | 42.87 | 42.74 | 43.00 | 43.299 | 0.001 | 39.81 | 41.56 |
| 3C 295 | N | 0.4614 | 44.05 | 40.91 | 42.50 | 42.18 | 42.68 | 44.48 | 44.43 | 44.97 | 45.004 | 0.005 | 41.99 | 42.33 |
| 3C 296 | E | 0.0237 | 40.51 | 39.68 | 41.49 | 41.17 | 41.85 | 40.90 | – | – | 40.816 | 0.097 | 39.74 | – |
| 3C 299 | N | 0.367 | 42.98 | 40.23 | – | – | – | – | – | – | – | – | – | 42.66 |
| 3C 300 | N | 0.272 | 42.88 | 40.91 | 43.40 | 43.38 | 43.42 | 42.49 | – | – | 43.400 | 0.146 | 42.02 | 42.48 |
| 3C 303 | B | 0.141 | 42.05 | 41.54 | 43.91 | 43.85 | 43.97 | 43.91 | 43.85 | 43.97 | – | – | 41.74 | 41.90 |
| 3C 305 | N | 0.0417 | 41.09 | 39.75 | 41.42 | 41.24 | 41.54 | 42.00 | – | – | – | – | 41.04 | 40.13 |
| 3C 309.1 | Q | 0.904 | 44.12 | 44.40 | 45.78 | 45.76 | 45.79 | 45.78 | 45.76 | 45.79 | 46.000 | 0.010 | 43.70 | 42.94 |
| 3C 310 | E | 0.0540 | 41.87 | 40.42 | – | – | – | – | – | – | 42.089 | 0.032 | 40.07 | – |
| 3C 314.1 | E | 0.1197 | 41.88 | 39.22 | – | – | – | – | – | – | 42.098 | 0.097 | 39.70 | – |
| 3C 315 | N | 0.1083 | 42.00 | 41.31 | 41.20 | – | – | 42.36 | – | – | 43.010 | 0.048 | 40.88 | – |
| 3C 319 | E | 0.192 | 42.49 | 39.64 | – | – | – | – | – | – | 42.680 | – | 40.18 | 39.98 |
| 3C 321 | N | 0.096 | 41.77 | 40.50 | 41.03 | 40.98 | 41.07 | 43.34 | 42.98 | 43.75 | 44.916 | 0.001 | 40.91 | 41.32 |
| 3C 326 | N | 0.0895 | 41.89 | 40.08 | – | – | – | – | – | – | 42.160 | – | 40.40 | 41.25 |
| 3C 325 | Q | 0.86 | 43.96 | 41.37 | 43.16 | – | – | 44.56 | 44.43 | 44.70 | 45.600 | 0.010 | – | 42.79 |
| 3C 330 | N | 0.5490 | 43.76 | 40.46 | 43.08 | 42.99 | 43.15 | 43.90 | 43.60 | 44.00 | 45.000 | 0.010 | – | 43.19 |
| NGC 6109 | E | 0.0296 | 40.62 | 39.44 | 40.35 | 39.81 | 40.57 | 40.82 | – | – | – | – | – | – |
| 3C 334 | Q | 0.555 | 43.39 | 42.64 | 45.08 | 44.99 | 45.15 | 45.08 | 44.99 | 45.15 | 45.700 | 0.010 | 43.37 | 42.54 |
| 3C 336 | Q | 0.927 | 43.91 | 42.36 | – | – | – | – | – | – | 45.400 | 0.010 | 43.46 | – |
| 3C 341 | N | 0.448 | 43.17 | 40.41 | – | – | – | – | – | – | 45.558 | 0.002 | 42.80 | 41.77 |
| 3C 338 | N | 0.0303 | 41.29 | 40.03 | 40.31 | 40.08 | 40.45 | 41.17 | – | – | 42.018 | 0.007 | 39.54 | 40.79 |
| 3C 340 | N | 0.7754 | 43.67 | 40.94 | – | – | – | – | – | – | 44.900 | 0.010 | – | 42.67 |
| 3C 337 | N | 0.635 | 43.52 | 40.18 | – | – | – | – | – | – | 44.300 | 0.010 | – | 41.63 |
| 3C 343 | Q | 0.988 | 43.90 | 43.58 | – | – | – | – | – | – | 45.900 | 0.010 | 42.68 | 41.99 |
| 3C 343.1 | N | 0.750 | 43.59 | 43.17 | – | – | – | – | – | – | 44.700 | 0.010 | 42.71 | 42.44 |
| NGC 6251 | E | 0.024 | 40.43 | 40.35 | 42.77 | 42.75 | 42.79 | 41.58 | – | – | 42.873 | – | – | – |
| 3C 346 | N | 0.162 | 42.15 | 41.83 | 43.40 | 43.38 | 43.41 | 42.44 | – | – | 43.960 | 0.004 | 41.33 | – |
| 3C 345 | Q | 0.594 | 43.34 | 44.59 | 45.64 | 45.58 | 45.71 | 45.64 | 45.58 | 45.71 | – | – | – | – |
| 3C 349 | N | 0.205 | 42.48 | 41.10 | 41.82 | 41.52 | 41.92 | 43.87 | 43.82 | 43.91 | – | – | 41.56 | – |
| 3C 351 | Q | 0.371 | 43.06 | 41.05 | 41.92 | 41.74 | 42.08 | 44.80 | 44.77 | 44.82 | 46.005 | 0.001 | 42.84 | – |
| 3C 352 | N | 0.806 | 43.80 | 41.43 | – | – | – | – | – | – | 44.800 | 0.010 | – | 43.05 |
| 3C 380 | Q | 0.691 | 44.32 | 44.67 | 45.81 | 45.72 | 45.89 | 45.81 | 45.72 | 45.89 | 45.900 | 0.010 | 43.76 | 42.99 |
| 3C 381 | B | 0.1605 | 42.34 | 40.18 | 42.11 | 42.00 | 42.20 | 44.31 | 44.18 | 44.44 | 44.650 | 0.010 | 42.38 | 40.92 |
| 3C 382 | B | 0.0578 | 41.48 | 40.85 | – | – | – | – | – | – | 44.240 | 0.008 | 41.78 | 40.73 |
| 3C 386 | E | 0.0177 | 40.51 | 39.62 | – | – | – | – | – | – | 41.550 | 0.007 | 40.25 | – |
| 3C 388 | E | 0.0908 | 41.98 | 40.77 | 41.74 | 41.65 | 41.81 | 42.01 | – | – | 42.660 | 0.049 | 40.71 | 40.52 |
| 3C 390.3 | B | 0.0569 | 41.85 | 41.08 | 44.49 | 44.47 | 44.52 | 44.50 | 44.12 | 44.88 | 44.370 | 0.011 | 42.11 | 40.95 |
| 3C 401 | E | 0.201 | 42.65 | 41.19 | 42.74 | 42.69 | 42.79 | 43.05 | – | – | 43.170 | 0.125 | 41.06 | – |
| 3C 427.1 | E | 0.572 | 43.83 | 40.53 | 42.45 | – | – | 43.24 | – | – | 43.800 | – | – | – |
| 3C 433 | N | 0.1016 | 42.45 | 39.77 | 41.06 | 40.77 | 41.22 | 43.92 | 43.80 | 44.02 | 44.670 | 0.004 | 41.68 | – |
| 3C 436 | N | 0.2145 | 42.65 | 41.02 | 42.59 | 42.55 | 42.62 | 43.53 | 43.35 | 43.72 | 43.520 | 0.062 | 41.56 | – |
| 3C 438 | E | 0.290 | 43.35 | 40.87 | 42.67 | 42.39 | 42.84 | 43.14 | – | – | 43.270 | – | 41.47 | – |
| 3C 441 | N | 0.708 | 43.70 | 41.36 | – | – | – | – | – | – | 44.800 | 0.010 | – | 42.42 |
| 3C 442A | E | 0.027 | 40.71 | 38.21 | 41.10 | 40.98 | 41.20 | 40.78 | – | – | – | – | – | 40.56 |
| 3C 449 | E | 0.0171 | 40.16 | 39.08 | 40.35 | 40.17 | 40.49 | 40.97 | – | – | 40.358 | 0.084 | 39.21 | – |
| 3C 452 | N | 0.0811 | 42.23 | 40.99 | 41.69 | – | – | 44.00 | 43.91 | 44.10 | 44.130 | 0.010 | 41.35 | 41.44 |
| NGC 7385 | E | 0.0243 | 40.44 | 39.90 | – | – | – | – | – | – | – | – | – | – |
| 3C 454.3 | Q | 0.859 | 43.70 | 45.07 | 46.37 | 46.24 | 46.47 | 46.37 | 46.24 | 46.47 | – | – | – | – |
| 3C 455 | Q | 0.5427 | 43.41 | 40.72 | – | – | – | – | – | – | – | – | 43.07 | 42.81 |
| 3C 457 | N | 0.428 | 43.23 | 40.69 | 43.35 | 43.30 | 43.40 | 44.56 | 44.52 | 44.88 | – | – | 42.49 | – |
| 3C 465 | E | 0.0293 | 41.16 | 40.41 | 41.04 | 40.70 | 41.55 | 41.22 | – | – | 42.109 | 0.007 | 39.79 | – |