Model uncertainty in claims reserving within Tweedie’s compound Poisson models
This version: 13 October 2008)
Abstract
In this paper we examine the claims reserving problem using Tweedie’s compound Poisson model. We develop the maximum likelihood and Bayesian Markov chain Monte Carlo simulation approaches to fit the model and then compare the estimated models under different scenarios. The key point we demonstrate relates to the comparison of reserving quantities with and without model uncertainty incorporated into the prediction. We consider both the model selection problem and the model averaging solutions for the predicted reserves. As a part of this process we also consider the sub problem of variable selection to obtain a parsimonious representation of the model being fitted.
Keywords: Claims reserving, model uncertainty, Tweedie’s compound Poisson model, Bayesian analysis, model selection, model averaging, Markov chain Monte Carlo.
This is a preprint of an article to appear in
ASTIN Bulletin 39(1), pp.1-33, 2009.
1 Claims reserving
Setting appropriate claims reserves to meet future claims payment cash flows is one of the main tasks of non-life insurance actuaries. There is a wide range of models, methods and algorithms used to set appropriate claims reserves. Among the most popular methods there is the chain-ladder method, the Bornhuetter-Ferguson method and the generalized linear model methods. For an overview, see Wüthrich and Merz (2008) and England and Verrall (2002).
Setting claims reserves includes two tasks: estimate the mean of future payments and quantify the uncertainty in this prediction for future payments. Typically, quantifying the uncertainty includes two terms, namely the so-called process variance and the (parameter) estimation error. The process variance reflects that we predict random variables, i.e. it describes the pure process uncertainty. The estimation error reflects that the true model parameters need to be estimated and hence there is an uncertainty in the reliability of these estimates. In this paper, in addition to these two terms, we consider a third source of error/uncertainty, namely, we analyze the fact that we could have chosen the wrong model. That is, we select a family of claims reserving models and quantify the uncertainty coming from a possibly wrong model choice within this family of models.
Such an analysis is especially important when answering solvency questions. A poor model choice may result in a severe shortfall in the balance sheet of an insurance company, which requires under a risk-adjusted solvency regime an adequate risk capital charge. We analyze typical sizes of such risk capital charges within the family of Tweedie’s compound Poisson models, see Tweedie (1984), Smyth and Jørgensen (2002) and Wüthrich (2003).
Assume that are incremental claims payments with indices where denotes the accident year and denotes the development year. At time , we have observations
| (1.1) |
and for claims reserving at time we need to predict the future payments
| (1.2) |
see Table 1. Hence, the outstanding claims payment at time is given by
| (1.3) |
Its conditional expectation at time is given by
| (1.4) |
Hereafter, the summation is for . Therefore, we need to predict and to estimate . Assume that is an appropriate -measurable predictor for and -measurable estimator for . Then, is used to predict the future payments and is the amount that is put aside in the balance sheet of the insurance company for these payments.
Prediction uncertainty is then often studied with the help of the (conditional) mean square error of prediction (MSEP) which is defined by
| (1.5) |
If is -measurable, the conditional MSEP can easily be decoupled as follows, see Wüthrich and Merz (2008), section 3.1:
| (1.6) | ||||
It is clear that the consistent estimator which minimizes the conditional MSEP is given by and is used, hereafter, as the ”best estimate” for reserves. Assuming the model is parameterized by the parameter vector , can be decomposed as
| (1.7) | ||||
These are the two terms that are usually studied when quantifying prediction uncertainties in a Bayesian context, where the unknown parameters are modelled stochastically. That is, we obtain in the Bayesian context a similar decomposition as in the frequentist estimation (1.6). In the frequentist approach, the second term in (1.6) is often estimated by , see for example section 6.4.3 in Wüthrich and Merz (2008).
As discussed in Cairns (2000), in full generality one could consider several sources of model uncertainty, however unlike Cairns (2000) we focus on a specific class of models. We consider the setting discussed in Bernardo and Smith (1994) termed M Complete modelling. In such a setting the premise is that one considers a set of models in which the ”truth” exists but is unknown a priori. In this setting we demonstrate the risk associated with the model uncertainty which we analyze jointly as a decomposition into two main parts. The first involves the uncertainty in the parameterization of the model, this is a variable selection problem within a nested model structure in the same vein as discussed in Cairns (2000). It relates to finding a trade-off between parsimony and accuracy in the estimation. The second source of model uncertainty that we study involves the choice of a parameter which determines membership from a spectrum of possible models within the Tweedie’s compound Poisson family of models. We restrict the analysis to Tweedie’s compound Poisson models and justify this by assuming we are working in the M Complete setting. If we relaxed this assumption and therefore consider competing models not in this family, then the analysis would be difficult to interpret and analyze in the manner we develop in this paper. The second source of model uncertainty will be considered under both a model selection and a model averaging setting, given the first ”variable selection” uncertainty is resolved. As mentioned in Cairns (2000) achieving such an analysis requires advanced simulation methodology. Note, in future work we would also consider the M Open modeling framework of Bernardo and Smith (1994) which relaxes the belief that the truth lies in the set of models considered and hence introduces additional uncertainty associated with the family of models considered. The advanced sampling methodology required to study the M Open model setting will be briefly discussed.
The paper is organised as follows. In section 2, we present Tweedie’s compound Poisson model and section 3 considers parameter estimation in the model, using the maximum Likelihood and Bayesian Markov chain Monte Carlo approaches for a real data set. Having addressed the variable selection question in section 4, we then analyze claims reserve estimation and model uncertainty in both a frequentist and Bayesian setting in section 5. We finish with conclusions from our findings.
2 Tweedie’s compound Poisson model
We assume that belongs to the family of Tweedie’s compound Poisson models. Below we provide three different parameterizations for Tweedie’s compound Poisson models, for rigorous derivations we refer to Jørgensen and de Souza (1994), Smyth and Jørgensen (2002) and Wüthrich (2003).
Model Assumptions 2.1 (1st Representation)
We assume that are independent for and have a compound Poisson distribution
| (2.1) |
in which (a) and are independent for all , (b) is Poisson distributed with parameter ; (c) are independent gamma severities with the mean and the shape parameter . Hereafter, we denote as an indicator function.
2nd Representation. The random variable given in
(2.1) belongs to the family of Tweedie’s compound
Poisson models, see Tweedie (1984). The distribution of
can be reparameterized in such a way that it takes a form of the
exponential dispersion family, see e.g. formula (3.5) and Appendix A
in Wüthrich (2003):
has a probability weight at given by
| (2.2) |
and for the random variable has continuous density
| (2.3) |
Here , , the normalizing constant is given by
| (2.4) |
and the cummulant generating function is given by
| (2.5) |
where and
The parameters, in terms of the 1st representation quantities, are:
| (2.6) | ||||
| (2.7) | ||||
| (2.8) | ||||
| (2.9) |
Then the mean and variance of are given by
| (2.10) | ||||
| (2.11) |
That is, has the mean , dispersion and variance function with the variance parameter . The extreme cases and correspond to the overdispersed Poisson and the gamma models, respectively. Hence, in this spirit, Tweedie’s compound Poisson model with closes the gap between the Poisson and the gamma models. Often in practice, is assumed to be known and fixed by the modeller. The aim of this paper is to study Model Uncertainty, that is, we would like to study the sensitivity of the claims reserves within this subfamily, i.e. Tweedie’s compound Poisson models (which are now parameterized through ). This answers model uncertainty questions within the family of Tweedie’s compound Poisson models. In this paper the restriction on is taken in the context of practical application of these models to claims reserving, Wüthrich (2003) comments that the majority of claims reserving problems will be captured under this assumption. However, in general, in the exponential dispersion family can be outside of the range, e.g. produces a Gaussian density and leads to an inverse Gaussian model.
3rd Representation. Utilizing the above definitions, the distribution of can be rewritten in terms of , and as
| (2.12) |
and for
| (2.13) |
3 Parameter estimation
Our goal is to estimate the parameters , and based on the observations . In order to estimate these parameters we need to introduce additional structure in the form of a multiplicative model.
Model Assumptions 3.1
Assume that there exist exposures and a development pattern such that we have for all
| (3.1) |
Moreover, assume that and ,.
In addition, we impose the normalizing condition , so that the estimation problem is well-defined. That is we have unknown parameters that have to be estimated from the data . Next we present the likelihood function for this model and then develop the methodology for parameter estimation using the maximum likelihood and Bayesian inference methods.
3.1 Likelihood function
Define the parameter vector . Then the likelihood function for , , is given by
| (3.2) |
where we set for . The difficulty in the evaluation of the likelihood function is the calculation of which contains an infinite sum
| (3.3) |
where . Tweedie (1984) identified this summation as Wright’s (1935) generalized Bessel function, which can not be expressed in terms of more common Bessel functions. To evaluate this summation we follow the approach of Dunn and Smyth (2005) which directly sums the infinite series, including only terms which significantly contribute to the summation. Consider the term
where
Replacing the gamma functions using Stirling’s approximation and approximating by we get
which is also a reasonable approximation for small . Treating as continuous and taking the partial derivative w.r.t. gives
Hence, the sequence is unimodal in Solving , to find (approximately) the maximum of , results in the approximate maximum lying close to
| (3.4) |
This gives a surprisingly accurate approximation to the true maximum of , . Finally, the aim is to find such that the following approximation is sufficiently accurate for the use in the evaluation of the likelihood terms,
| (3.5) |
The fact that is monotonic and decreasing implies that is strictly convex in and hence the terms in decay at a faster rate than geometric on either side of . Dunn and Smyth (2005) derive the following bounds,
| (3.6) |
with
| (3.7) |
These bounds are typically too conservative since the decay is much faster than geometric. In practice, an adaptive approach balancing accuracy and efficiency is to continue adding terms either side of the maximum until the lower and upper terms satisfy the double precision constraints (or ) and . When evaluating the summation for , it was important to utilize the following identity to perform the summation in the log scale to avoid numerical overflow problems,
We made an additional observation when analyzing this model. For our data set, as approaches (i.e. when the distribution approaches the overdispersed Poisson model) the likelihood may become multimodal. Therefore, to avoid numerical complications in actual calculations, we restrict to . At the other extreme, when the number of terms required to evaluate may become very large, hence to manage the computation burden, we restrict . These limitations are also discussed in Dunn and Smyth (2005). For our data set, we checked that this restriction did not have a material impact on the results.
3.2 Maximum likelihood estimation
The maximum likelihood estimator (MLE) for the parameters is given by maximizing in under the constraints , , and . This leads to the MLEs and to the best estimate reserves for , given ,
| (3.8) |
A convenient practical approach to obtain the MLEs is to use the fact that at the maximum of the likelihood, are expressed through and according to the following set of equations, :
| (3.9) |
obtained by setting partial derivatives
| (3.10) |
equal to zero. Hence, after maximizing the likelihood in one then calculates the set of equations (3.9) for the remaining parameters utilizing the normalization condition .
Under an asymptotic Gaussian approximation, the distribution of the MLEs is Gaussian with the covariance matrix elements
| (3.11) |
where is Fisher’s information matrix that can be estimated by the observed information matrix
| (3.12) |
It is interesting to note that, . Also, it is easy to show (using (3.10) and (3.11)) that is orthogonal to all other parameters, i.e.
| (3.13) |
The next step is to estimate the parameter estimation error in the reserve as a function of the parameter uncertainty. We do this via propagation of error by forming a Taylor expansion around the MLEs, see England and Verrall (2002) formulae (7.6)-(7.8) and Wüthrich (2003) formulae (5.1)-(5.2),
| (3.14) | ||||
| (3.15) | ||||
Additionally, using the independence assumption on and (2.11), the process variance is estimated as
| (3.16) |
Then the conditional MSEP (1.6) is estimated by
| (3.17) | ||||
Note that, in practice, typically MLE is done for a fixed (expert choice) and hence model selection questions are neglected. In our context it means that the expert chooses and then estimates , and (see also Wüthrich (2003), section 4.1). The case corresponds to the overdispersed Poisson model and provides the chain-ladder estimate for the claims reserves (see Wüthrich and Merz (2008), section 2.4). It is important to note that, often the dispersion parameter is estimated using Pearson’s residuals as
| (3.18) |
where is the number of observations in and is the number of estimated parameters , (see e.g. Wüthrich and Merz (2008), formula (6.58)). Also note that for a given , given by (3.8) does not depend on and the estimators for the process variance (3.16) and estimation error (3.15) are proportional to . Next we present the Bayesian model which provides the posterior distribution of the parameters given the data. This will be used to analyze the model uncertainty within Tweedie’s compound Poisson models.
3.3 Bayesian inference
In a Bayesian context all parameters, , , and , are treated as random. Using Bayesian inference we adjust our a priori beliefs about the parameters of the model utilizing the information from the observations. Through the Bayesian paradigm we are able to learn more about the distribution of , , and after having observed .
Our a priori beliefs about the parameters of the model are encoded in the form of a prior distribution on the parameters Then the joint density of and is given by
| (3.19) |
Now applying Bayes’ law, the posterior distribution of the model parameters, given the data , is
| (3.20) |
Usually, there are two problems that arise in this context, the normalizing constant of this posterior is not known in closed form. Additionally, generating samples from this posterior is typically not possible using simple inversion or rejection sampling approaches. In such cases it is usual to adopt techniques such as Markov chain Monte Carlo (MCMC) methods, see for example Gilks et al. (1996) and Robert and Casella (2004) for detailed expositions of such approaches.
The Bayesian estimators typically considered are the Maximum a Postiori (MAP) estimator and the Minimum Mean Square Estimator (MMSE), that is the mode and mean of the posterior, defined as follows:
| (3.21) | ||||
| (3.22) |
We mention here that if the prior is constant and the parameter range includes the MLE, then the MAP of the posterior is the same as the MLE. Additionally, one can approximate the posterior using a second order Taylor series expansion around the MAP estimate as
| (3.23) |
This corresponds to approximated by the Gaussian distribution with the mean and covariance matrix calculated as the inverse of the matrix
| (3.24) |
which in the case of diffuse priors (or constant priors defined on a large range) compares with the Gaussian approximation for the MLEs (3.11)-(3.12).
In the Bayesian context, the conditionally expected future payment, for Model Assumptions 3.1, is given by
| (3.25) |
Denote the expected reserves, given the parameters by
| (3.26) |
Then, the best consistent estimate of reserves (ER) is given by
| (3.27) |
which is, of course, a -measurable predictor. Hence, the conditional MSEP is simply
| (3.28) |
This term, in the Bayesian approach for Tweedie’s compound Poisson model, is decomposed as, see also (1.7),
| (3.29) |
Hence, we obtain the familiar decoupling into average process variance and estimation error. However, in addition we incorporate model uncertainty within Tweedie’s compound Poisson model, which enters the calculation by the averaging over all possible values of the variance parameter .
3.4 Random walk Metropolis Hastings-algorithm within Gibbs
In this section we describe an MCMC method to be used to sample from the posterior distribution (3.20). The following notations are used: is the vector of parameters; is the uniform distribution on the interval ; and are the Gaussian density and distribution correspondingly with the mean and standard deviation at position .
Prior Structure: We assume that all parameters are independent under the prior distribution and all distributed uniformly with . The prior domains we used for our analysis were , , and . These are reasonable ranges for the priors in view of our data in Table 2 and corresponding to the MLEs in Table 3. Other priors such as diffuse priors can be applied with no additional difficulty. The choice of very wide prior supports was made with the aim of performing inference in the setting where the posterior is largely implied by the data. Subsequently, we checked that making the ranges wider does not affect the results.
Next we outline a random walk Metropolis-Hastings (RW-MH) within Gibbs algorithm. This creates a reversible Markov chain with the stationary distribution corresponding to our target posterior distribution (3.20). That is, we will run the chain until it has sufficiently converged to the stationary distribution (=posterior distribution) and in doing so we obtain samples from that posterior distribution. It should be noted that the Gibbs sampler creates a Markov chain in which each iteration of the chain involves scanning either deterministically or randomly over the variables that comprise the target stationary distribution of the chain. This process involves sampling each proposed parameter update from the corresponding full conditional posterior distribution. The algorithm we present generates a Markov chain that will explore the parameter space of the model in accordance with the posterior mass in that region of the parameter space. The state of the chain at iteration will be denoted by and the chain will be run for a length of iterations. The manner in which MCMC samplers proceed is by proposing to move the th parameter from state to a new proposed state The latter will be sampled from an MCMC proposal transition kernel (3.30). Then the proposed move is accepted according to a rejection rule which is derived from a reversibility condition. This makes the acceptance probability a function of the transition kernel and the posterior distribution as shown in (3.31). If under the rejection rule one accepts the move then the new state of the th parameter at iteration is given by , otherwise the parameter remains in the current state and an attempt to move that parameter is repeated at the next iteration. In following this procedure, one builds a set of correlated samples from the target posterior distribution which have several asymptotic properties. One of the most useful of these properties is the convergence of ergodic averages constructed using the Markov chain samples to the averages obtained under the posterior distribution.
Next we present the algorithm and then some references that will guide further investigation into this class of simulation methodology. Properties of this algorithm, including convergence results can be found in the following references Casella and George (1992), Robert and Casella (2004), Gelman et al. (1995), Gilks et al. (1996) and Smith and Roberts (1993).
Random Walk Metropolis Hastings (RW-MH) within Gibbs algorithm.
1. Initialize randomly or deterministically for the parameter vector (e.g. MLEs).
2. For
a) Set
b) For
Sample proposal from Gaussian distribution whose density is truncated below and above and given by
| (3.30) |
to obtain .
Accept proposal with acceptance probability
| (3.31) |
where is given by (3.20). That is, simulate and set if
Remark. The RW-MH algorithm is simple in nature and easily implemented. However, if one does not choose the proposal distribution carefully, then the algorithm only gives a very slow convergence to the stationary distribution. There have been several studies regarding the optimal scaling of proposal distributions to ensure optimal convergence rates. Gelman et al. (1997), Bedard and Rosenthal (2007) and Roberts and Rosenthal (2001) were the first authors to publish theoretical results for the optimal scaling problem in RW-MH algorithms with Gaussian proposals. For -dimensional target distributions with i.i.d. components, the asymptotic acceptance rate optimizing the efficiency of the process is 0.234 independent of the target density. In this case we recommend that the selection of are chosen to ensure that the acceptance probability is roughly close to 0.234. This number is the acceptance probability obtained for asymptotically optimal acceptance rates for RW-MH algorithms when applied to multidimensional target distributions with scaling terms possibly depending on the dimension. To obtain this acceptance rate, one is required to perform some tuning of the proposal variance prior to final simulations. An alternative approach is to utilize a new class of Adaptive MCMC algorithms recently proposed in the literature, see Atchade and Rosenthal (2005) and Rosenthal (2007), but these are beyond the scope of this paper.
3.5 Markov chain results and analysis
This section presents the results comparing both MLE and Bayesian estimates for the parameters of Tweedie’s compound Poisson model. It is also demonstrated how additional information in a Bayesian framework can be obtained through the complete knowledge of the target posterior distribution obtained from the MCMC algorithm described above. In this regard we demonstrate how this additional information can be exploited in the claims reserving setting to provide alternative statistical analysis not obtainable if one just considers point estimators. We also analyze model averaging solutions in section 5. These can be obtained by forming estimates using the information given by the full posterior distribution that we find empirically from the MCMC samples.
The maximum likelihood and MCMC algorithms were implemented in Fortran. The maximization routine for the MLEs utilizes the direct search algorithm DBCPOL (that requires function evaluation only) from the IMSL numerical library. Note that, gradient based optimization routines such as the BFGS algorithm can be more efficient, but the direct search algorithm we used was sufficient for our problem in terms of computing time ( seconds on a typical desktop PC111Intel CoreTM2 Duo, 2.13GHz processor.).
The algorithm was analyzed on synthetic data and found to provide correct estimates. In particular with uniform priors the MAP estimates of the parameters are the same as the MLEs, up to numerical errors. This was confirmed for different sized claims triangles. The actual data set studied in this paper is presented in Table 2. The data we study is the standard data set used in Wüthrich and Merz (2008) scaled by 10,000.
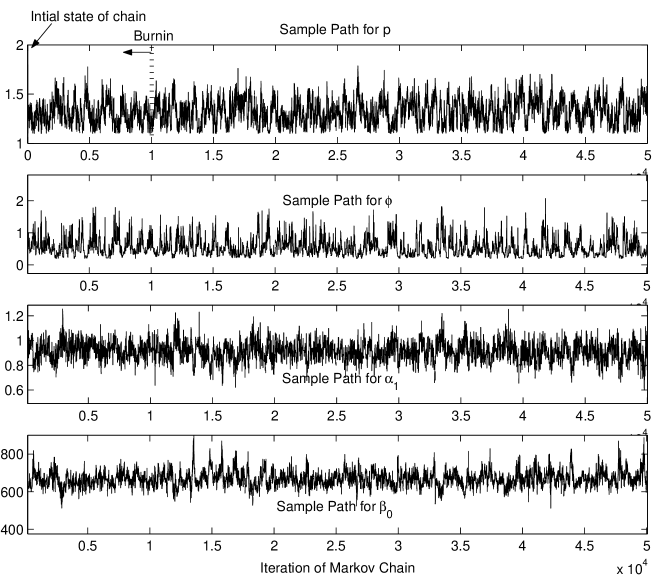
The results presented for the Bayesian approach were obtained after pretuning the Markov chain random walk standard deviations, to produce average acceptance probabilities of Then the final simulation was for iterations from a Markov chain (min111Intel CoreTM2 Duo, 2.13GHz processor.) in which the first iterations were discarded as burnin when forming the estimates. The pretuned proposal standard deviations are presented in Table 3. The first set of results in Table 3 demonstrates the MLE versus the Bayesian posterior estimator MMSE for all model parameters. Included are the [5%, 95%] predictive intervals for the Bayesian posterior distribution. The MLE standard deviations are calculated using (3.11). The numerical standard errors (due to a finite number of MCMC iterations) in the Bayesian estimates are obtained by blocking the MCMC samples post burnin into blocks of length 5000 and using the estimates on each block to form the standard error (these are given in brackets next to the estimates).
The next set of analysis demonstrates the performance of the MCMC approach in converging to the stationary distribution given by the target posterior . To analyze this, in Figure 1, we present the trace plots for the Markov chain for the parameters, . Also, in Figure 2, we demonstrate the marginal posterior distribution histograms and pair-wise posterior scatter plots for . The lower panels in Figure 2 are the scatter plots for the pair-wise marginal posteriors, the diagonal contains the marginal posteriors and the upper panels contains the correlations between parameters. These plots demonstrate strong linear correlations between several parameters. Some of these correlations are similar to MLE correlations calculated using (3.11). For example, we found that under the posterior distribution and , see Figure 2, are similar to and correspondingly. However, we also observed that under the posterior distribution and , see Figure 2, while corresponding MLE correlations are zero, see (3.13).
4 Variable selection via posterior model probabilities
In the development so far it has been assumed that variable selection is not being performed, that is we are assuming that the model is known and we require parameter estimates for this model. This is equivalent to specifying that the number of and parameters is fixed and known in advance. We now relax this assumption and will demonstrate how the variable selection problem can be incorporated into our framework. The procedure we utilize for the variable selection is based on recent work of Congdon (2006) and specifies the joint support of the posterior distribution for the models and parameters under the product space formulation of Carlin and Chib (1995).
In this section we consider the subset of nested models which create homogenous blocks in the claims reserving triangle for the data set in Table 2.
-
•
- saturated model.
-
•
with
-
•
with , ,
, . -
•
with , ,
, , , -
•
with , ,
, , , ,
, -
•
with , , , , , , , , ,
-
•
with
Now, to determine the optimal model, we first consider the joint posterior distribution for the model probability and the model parameters denoted where is the parameter vector for model Additionally we denote the prior bounds for as We assume a prior distribution for the model selection and a prior for the parameters conditional on the model . It is no longer possible to run the standard MCMC procedure we described in section 3.4 for this variable selection setting. This is because the posterior is now defined on either a support consisting of disjoint unions of subspaces or a product space of all such subspaces, one for each model considered. A popular approach to run Markov chains in such a situation is to develop a more advanced sampler than that presented above, typically in the disjoint union setting. This involves developing a Reversible Jump RJ-MCMC framework, see Green (1995) and the references therein. This type of Markov chain sampler is complicated to develop and analyze. Hence, we propose as an alternative in this paper to utilize a recent procedure that will allow us to use the above MCMC sampler we have already developed for a model The process we must follow involves first running the sampler in the simulation technique described in section 3.4 for each model considered. Then the calculation of the posterior model probabilities is performed using the samples from the Markov chain in each model to estimate (4.3).
Furthermore, our approach here removes the assumption on the priors across models, made by Congdon (2006), p.348,
| (4.1) |
and instead we work with the prior
| (4.2) |
That is, instead we use a class of priors where specification of priors for a model automatically specifies priors for any other model. This is a sensible set of priors to consider given our product space formulation and it has a clear interpretation in our setting where we specify our models through a series of constraints, relative to each other. In doing this we also achieve our goal of having posterior model selection insensitive to the choice of the prior and being data driven. The modified version of Congdon’s (2006), formula A.3, we obtain after relaxing Congdon’s assumption, allows the calculation of the posterior model probabilities using the samples from the Markov chain in each model to estimate
| (4.3) |
Here and for a proof, see Congdon (2006), formula A.3. Note that, the prior of parameters (given model) contributes in the above implicitly as are MCMC samples from the models posterior distribution. In the actual implementation we used and the burnin period Note, the prior probabilities for each model are considered diffuse and are set such that all models a priori are equiprobable, hence and is the prior for model ’s parameters evaluated at the Markov chain iteration. Once we have the posterior model probabilities we can then take the MAP estimate for the optimal model (variable selection) for the given data set. In this paper we do not consider the notion of model averaging over different parameterized models in the variable selection context. Instead we simply utilize these results for optimal variable selection from a MAP perspective for the marginal posterior .
In addition to this model selection criterion we also consider in the Bayesian framework the Deviance Information Criterion (DIC), see Bernardo and Smith (1994). From a classical maximum likelihood perspective we present the likelihood ratio (LHR) p-values.
Application of this technique to the simulated MCMC samples for each of the considered models produced the posterior model probabilities given in Table 4. This suggests that within this subset of models considered, the saturated model was the optimal model to utilize in the analysis of the claims reserving problem, . It is followed by model with . Additionally, the choice of was also supported by the other criteria we considered: DIC and LHR.
In future research it would be interesting to extend to the full model space which considers all models in the power set . This is a large set of models including all combinatorial combinations of model parameters for and . In such cases it is no longer feasible to run standard MCMC algorithms in each model since this will involve an impractical number of simulations. Hence, more sophisticated model exploration techniques will be required such as RJ-MCMC, see Green (1995) or the product space samplers of Carlin and Chib (1995).
We note here that we do not claim is the optimal model in all possible models, only in the subset we consider in this section. In saying this we acknowledge that we aim to work in the saturated model but consider it important to illustrate how variable selection can be performed in this class of models and also raise awareness that this will impact the model uncertainty analysis subsequently performed.
Hence, using these findings and the analysis of the MCMC results for model provided above, we may now proceed to analyze the claims reserving problem. Of interest to the aim of this paper is the sensitivity of the model choice parameter to the parameterization of the claims reserving triangle. This is particularly evident when one considers the MMSE estimate of the model specification parameter estimated under each model. In the most parsimonious, yet inflexible model the estimate obtained was , a very similar estimate was obtained in models and however, interestingly in the saturated model the estimate was which is almost at the other extreme of the considered range for which the parameter is defined.
5 Calculation of the claims reserves
We now demonstrate the results for several quantities in the claims reserving setting, utilizing the MCMC simulation results we obtained for the Bayesian posterior distribution under the variable selection model (saturated model). In particular, we start by noting that we use uniform prior distributions with a very wide ranges to perform inference implied by the data only. In this case, theoretically, the Bayesian MAP (the posterior mode) and MLEs for the parameters should be identical up to numerical error due to the finite number of MCMC iterations. A large number of MCMC iterations was performed so that the numerical error is not material. In general, the use of more informative priors will lead to the differences between the MAP and MLE. Some of the MMSE estimates (the posterior mean) were close to the MAP estimates, indicating that the marginal posterior distributions are close to symmetric. When the posterior is not symmetric, MMSE and MAP can be very different. Also, note that the uncertainties in the parameter MLEs are estimated using the asymptotic Gaussian approximation (3.11)-(3.12). In the case of constant priors, this should lead to the same inferences as corresponding Bayesian estimators if the posterior distributions are close to the Gaussian approximation, see (3.23)-(3.24). In addition, the MLEs for the reserves, estimation error and process variance, see section 3.2, are based on a Taylor expansion around parameter MLEs assuming small errors. In many cases the posterior is materially different from the Gaussian distribution, has significant skewness and large standard deviation leading to the differences between the MLEs and corresponding Bayesian estimators. Having mentioned this, we now focus on the main point of this paper which involves analysis of the quantities in Table 5 related to the model uncertainty within Tweedie’s compound Poisson models (introduced by fixing model parameter ) in a Bayesian setting.
It is worth noting that point estimates of model parameters are either in the frequentists approach MLEs or in a Bayesian approach the MAP or MMSE estimates. These are under the auspice that we wish to perform model selection (i.e. selection of ). The focus of this paper is to demonstrate the difference in results obtained for reserve estimates that can arise by performing model averaging instead of the typical approach of model selection, using a priori chosen . In this regard we perform estimation utilizing the full posterior distribution of the parameters and not just point estimators. This allows us to capture the influence of the model uncertainty (uncertainty in ), since in a Bayesian setting we can account for this uncertainty using the posterior distribution. In particular, the Bayesian analysis specifies the optimal (either in the MAP or the MMSE context) and it also provides a confidence interval for the choice of (see Figure 7), which corresponds to the choice of the optimal model within Tweedie’s compound Poisson models. Moreover, we demonstrate the impact on the claims reserve by varying from 1.1 to 1.9 (i.e. for a fixed model choice).
5.1 Results: average over
Initially it is worth considering the predicted reserve distribution for the estimator . This is obtained by taking the samples to from the MCMC simulation and calculating via (3.26). The histogram estimate is presented in Figure 3. In the same manner, we also estimate the distributions of for the individual cells of the claims matrix, presented as subplots in Figure 4. Note that the total observed loss in the upper triangle () is consistent with and estimated using the MCMC samples as () and () respectively. The maximum likelihood approach results in with standard deviation also conforming with the observed total loss.
Now we focus on quantities associated with the estimated distribution for to calculate the results, see Table 5, which can only be estimated once the entire posterior distribution is considered. These quantities are the key focus of this paper since they allow assessment of the conditional MSEP as specified in (3.28). In particular, we may now easily use the posterior probability samples obtained from the MCMC algorithm to evaluate the estimated reserve (ER), the process variance (PV) and the estimation error (EE) in the conditional MSEP. This provides an understanding and analysis of the behaviour of the proposed model in both the model averaging and model selection (i.e. selection of ) contexts whilst considering the issue of model uncertainty, the goal of this paper. The Bayesian estimates for ER, PV, EE and MSEP are presented in Table 6. The corresponding MLEs were calculated using (3.8), (3.16), (3.15) and (3.17) respectively and presented in Table 6 for comparison. The results demonstrate the following:
-
•
Claims reserves MLE, is less than Bayesian estimate by approximately 3%, which is the estimation bias of the claims reserve MLE (see also Wüthrich and Merz (2008), Remarks 6.15.
-
•
and are of the same magnitude, approximately 6-7% of the total claims reserves.
-
•
MLEs for and are less than corresponding Bayesian estimates by approximately 37% and 30%, respectively.
-
•
The difference between and is of the same order of magnitude as and and thus is significant.
Note that we use constant priors with very wide ranges, the MLE uncertainties are calculated using an asymptotic Gaussian approximation and numerical error due to the finite number of MCMC iterations is not material (also see the 1st paragraph, section 5). The observed significant differences between the MLEs and corresponding Bayesian estimators suggest that our posterior distributions are skewed and materially different from the Gaussian distribution.
We conclude this section with the distribution of , the total outstanding claims payment, see Figure 5. This is obtained from the MCMC samples of the parameters which we then transform to parameters from model representation 1, section 2, and simulate annual losses in . That is, these samples of are obtained from the full predictive distribution where is the distribution of given by (1.3) and (2.1). It takes into account both process uncertainty and parameter uncertainty. We note that while reserving by some measure of centrality such as may be robust, it will not take into account the distributional shape of . A viable alternative may be Value-at-Risk (VaR) or a coherent risk measure such as Expected Shortfall. In Table 7 we demonstrate estimates of the VaR for and at the and quantiles.
5.2 Results: conditioning on
As part of the model uncertainty analysis, it is useful to present plots of the relevant quantities in the model selection (selection of ) settings, see Figure 6, where we present , and as a function of . Figure 6 shows:
-
•
MLE of is almost constant, varying approximately from a maximum of to a minimum of while the MLE for was 602.63.
-
•
The Bayesian estimates for change as a function of Approximately, it ranged from a maximum of to a minimum of while the Bayesian estimator for was . Hence, the difference (estimation bias) within this possible model range is which is of a similar order as the process uncertainty and the estimation error.
-
•
Bayesian estimators for and increase as increases approximately from to and from to respectively, while the Bayesian estimators for and are and correspondingly. Hence, the resulting risk measure strongly varies in which has a large influence on quantitative solvency requirements. The MLEs for and are significantly less than the corresponding Bayesian estimators. Also, the difference between the MLE and the Bayesian estimators increases as increases.
For interpretation purposes of the above results it is helpful to use the following relations between model averaging and model selection quantities (easily derived from their definitions in Table 5):
| (5.1) | ||||
| (5.2) | ||||
| (5.3) |
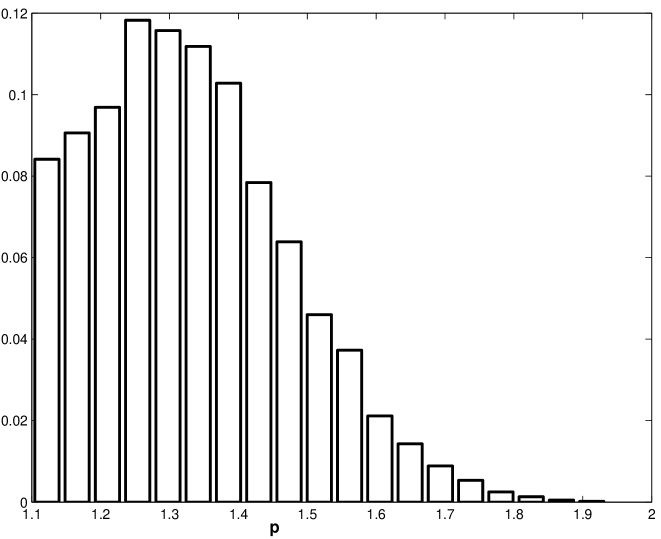
Here, the expectations are calculated with respect to the posterior distribution of . The histogram estimate of the later is presented in Figure 7 and highlights significant uncertainty in (model uncertainty within Tweedie’s compound Poisson model).
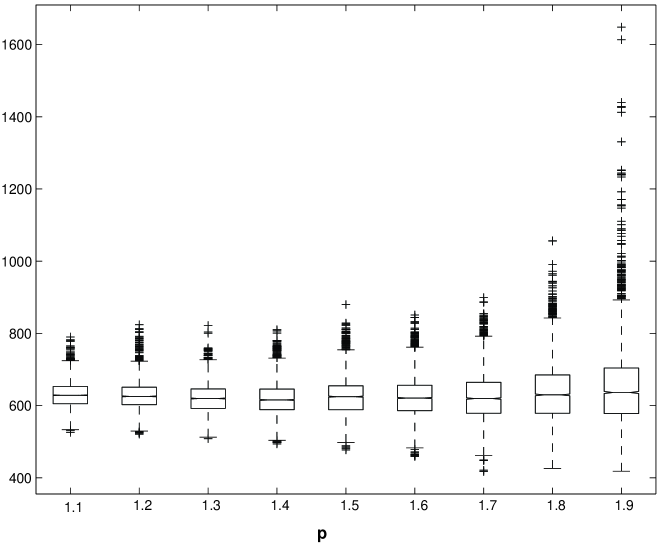
We also provide Figure 8 demonstrating a Box and Whisker summary of the distributions of for a range of values of This plot provides the first, second and third quartiles as the box. The notch represents uncertainty in the median estimate for model comparison, across values of and the whiskers demonstrate the smallest and largest data points not considered as outliers. The outliers are included as crosses and the decision rule to determine if a point is an outlier was taken as the default procedure from the statistical software package R.
The conclusion from this section is that if model selection is performed (i.e. is fixed by the modeller), the conditional MSEP will increase significantly if a poor choice of the model parameter is made. In particular, though the median is fairly constant for the entire range of the shape of the distribution of is clearly becoming more diffuse as . This will lead to significantly larger variance in the reserve estimate. If risk measures such as Value-at-Risk are used in place of the mean, it will result in reserves which are too conservative (if a poor choice of is made). Also, using the maximum likelihood approach may significantly underestimate the claims reserves and associated uncertainties.
5.3 Overdispersed Poisson and Gamma models
There are several popular claims reserving models, however we restrict our comparison to the overdispersed Poisson and gamma models since they fit into Tweedie’s compound Poisson framework when and respectively. Note that the overdispersed Poisson model and several other stochastic models lead to the same reserves as the chain ladder method but different in higher moments. The detailed treatment of these models can be found in e.g. England and Verrall (2002) or Wüthrich and Merz (2008), section 3.2.
The MLEs for the reserves and associated uncertainties within the overdispersed Poisson and gamma models are provided in Table 8. These results are obtained when the dispersion is estimated by using Pearson’s residuals (3.18) and when is estimated by obtained from the maximization of the likelihood. The results for the first case are also presented in Wüthrich and Merz (2008), Table 6.4. Firstly note that, the values of and are significantly different both for the overdispersed Poisson and gamma models. As we mentioned in section 3.2, for a fixed , the MLE for the reserves does not depend on while the estimation error, process variance and MSEP are proportional to . As one can see from Table 8, different estimators for the dispersion lead to the same estimators for the reserves but very different estimators for the uncertainties. Also note that, our MLE calculations for Tweedie’s distribution conditional on , i.e. Figure 6, are obtained using and are consistent with the corresponding results for the overdispersed Poisson and Gamma models when and respectively. Though, in the case of the overdispersed Poisson we had to use an extended quasi-likelihood to estimate . In Figure 6, we do not show the results based on but would like to mention that these are always above the MLEs and below the Bayesian estimators for the process variance and estimation error and are consistent with corresponding overdispersed Poisson and gamma model limits. Interestingly, the ratio is approximately for all considered cases of within a range.
The MLEs obtained using both and underestimate the uncertainties compared to the Bayesian analysis. Note that, while the MLEs for the uncertainties are proportional to the dispersion estimator, the corresponding Bayesian estimators are averages over all possible values of according to its posterior distribution. The uncertainty in the estimate for the dispersion is large which is also highlighted by a bootstrap analysis in Wüthrich and Merz (2008), section 7.3. This indicates that should also depend on the individual cells . However, in this case overparameterization needs to be considered with care and Bayesian framework should be preferred.
6 Discussion
The results demonstrate the development of a Bayesian model for the claims reserving problem when considering Tweedie’s compound Poisson model. The sampling methodology of a Gibbs sampler is applied to the problem to study the model sensitivity for a real data set. The problem of variable selection is addressed in a manner commensurate with the MCMC sampling procedure developed in this paper and the most probable model under the posterior marginal model probability is then considered in further analysis. Under this model we then consider two aspects, model selection and model averaging with respect to model parameter . The outcomes from these comparisons demonstrate that the model uncertainty due to fixing plays a significant role in the evaluation of the claims reserves and its conditional MSEP. It is clear that whilst the frequentist MLE approach is not sensitive to a poor model selection, the Bayesian estimates demonstrate more dependence on poor model choice, with respect to model parameter . We use constant priors with very wide ranges to perform inference in the setting where the posterior is largely implied by data only. Also, we run a large number of MCMC iterations so that numerical error in the Bayesian estimators is very small. In the case of the data we studied, the MLEs for the claims reserve, process variance and estimation error were all significantly different (less) than corresponding Bayesian estimators. This is due to the fact that the posterior distribution implied by the data and estimated using MCMC is materially different from Gaussian, i.e. more skewed.
Future research will examine variable selection aspects of this model in a Bayesian context considering the entire set of possible parameterizations. This requires development of advanced approaches such as Reversible Jump MCMC and variable selection stochastic optimization methodology to determine if a more parsimonious model can be selected under assumptions of homogeneity in adjacent columns/rows in the claims triangle.
Acknowledgements
The first author is thankful to the Department of
Mathematics and Statistics at the University of NSW for support
through an Australian Postgraduate Award and to CSIRO for support
through a postgraduate research top up scholarship. Thank you also
goes to Robert Kohn for discussions.
References
Atchade Y. and Rosenthal, J. (2005) On adaptive Markov chain Monte Carlo algorithms. Bernoulli 11(5), 815-828.
Bedard M. and Rosenthal J.S. (2008) Optimal scaling of Metropolis algorithms: heading towards general target distributions. The Canadian Journal of Statistics 36(4), 483-503.
Bernardo, J.M. and Smith, A.F.M. (1994) Bayesian Theory. John Wiley and Sons, NY.
Cairns, A.J.G. (2000) A discussion of parameter and model uncertainty in insurance. Insurance: Mathematics and Economics 27, 313-330.
Carlin, B. and Chib, S. (1995) Bayesian model choice via Markov chain Monte Carlo methods. Journal of the Royal Statististical Society Series B 57, 473-484.
Casella, G. and George, E.I. (1992) Explaining the Gibbs Sampler. The American Statistician 46(3), 167-174.
Congdon P. (2006) Bayesian model choice based on Monte Carlo estimates of posterior model probabilities. Computational Statistics and Data Analysis 50(2), 346-357.
Dunn, P.K. and Smyth, G.K. (2005) Series evaluation of Tweedie exponential dispersion model densities. Statistics and Computing 15, 267-280.
England P.D. and Verrall R.J. (2002) Stochastic claims reserving in general insurance. British Actuarial Journal 8(3), 443-510.
Gelman, A., Carlin, J.B., Stern, H.S. and Rubin, D.B. (1995) Bayesian Data Analysis. Chapman and Hall /CRC Texts in Statistical Science Series, 60.
Gelman, A., Gilks, W.R. and Roberts, G.O. (1997) Weak convergence and optimal scaling of random walks metropolis algorithm. Annals of Applied Probability 7, 110-120.
Gilks, W.R., Richardson, S. and Spiegelhalter, D.J. (1996) Markov Chain Monte Carlo in Practice. Chapman and Hall, Florida.
Green, P. (1995) Reversible jump Markov chain Monte Carlo computation and Bayesian model determination. Biometrika 82, 711-732.
Jørgensen, B. and de Souza, M.C.P. (1994) Fitting Tweedie’s compound Poisson model to insurance claims data. Scandinavian Actuarial Journal, 69-93.
Robert, C.P. and Casella, G. (2004) Monte Carlo Statistical Methods, 2nd Edition Springer Texts in Statistics.
Roberts, G.O. and Rosenthal, J.S. (2001) Optimal scaling for various Metropolis-Hastings algorithms. Statistical Science 16, 351-367.
Rosenthal, J.S. (2007) AMCMC: An R interface for adaptive MCMC. Computational Statistics and Data Analysis 51(12), 5467-5470.
Smith, A.F.M. and Roberts, G.O. (1993) Bayesian computation via the Gibbs sampler and related Markov chain Monte Carlo methods. Journal of Royal Statistical Society Series B 55(1), 3-23.
Smyth, G.K. and Jørgensen, B. (2002) Fitting Tweedie’s compound Poisson model to insurance claims data: dispersion modelling. Astin Bulletin 32, 143-157.
Tweedie, M.C.K. (1984) An index which distinguishes between some important exponential families. In Statistics: Applications in new directions. Proceeding of the Indian Statistical Institute Golden Jubilee International Conference, J.K. Ghosh and J. Roy (eds.), 579-604, Indian Statistical Institute Canada.
Wright, E.M. (1935) On asymptotic expansions of generalized Bessel functions. Proceedings of London Mathematical Society 38, 257-270.
Wüthrich, M.V. (2003) Claims reserving using Tweedie’s compound Poisson model. Astin Bulletin 33, 331-346.
Wüthrich, M.V. and Merz, M. (2008) Stochastic Claims Reserving Methods in Insurance, Wiley Finance.
Gareth W. Peters
CSIRO Mathematical and Information Sciences, Sydney, Locked
Bag 17, North Ryde, NSW, 1670, Australia
and
UNSW Mathematics and Statistics Department, Sydney, 2052,
Australia.
Email: peterga@maths.unsw.edu.au
Pavel V. Shevchenko (Corresponding Author)
CSIRO Mathematical and Information Sciences, Sydney, Locked
Bag 17, North Ryde, NSW, 1670, Australia.
Email: Pavel.Shevchenko@csiro.au
Mario V. Wüthrich
ETH Zurich, Department of Mathematics, CH-8092 Zurich, Switzerland.
Email: wueth@math.ethz.ch
| accident | development years | |||||||||
|---|---|---|---|---|---|---|---|---|---|---|
| year | 0 | 1 | … | … | ||||||
| observed random variables | ||||||||||
| to be predicted | ||||||||||
| Year | ||||||||||
|---|---|---|---|---|---|---|---|---|---|---|
| MLE | MLE stdev | Bayesian posterior | ||||
| MMSE | stdev | |||||
| 1.259 | 0.149 | 1.332 (0.007) | 0.143 (0.004) | [1.127;1.590] | 1.61 | |
| 0.351 | 0.201 | 0.533 (0.013) | 0.289 (0.005) | [0.174;1.119] | 1.94 | |
| 0.918 | 0.056 | 0.901 (0.004) | 0.074 (0.001) | [0.778;1.022] | 0.842 | |
| 0.946 | 0.051 | 0.946 (0.003) | 0.073 (0.001) | [0.833;1.072] | 0.907 | |
| 0.861 | 0.048 | 0.861 (0.003) | 0.068 (0.001) | [0.756;0.977] | 0.849 | |
| 0.891 | 0.049 | 0.902 (0.003) | 0.072 (0.002) | [0.794;1.027] | 0.893 | |
| 0.879 | 0.051 | 0.876 (0.003) | 0.070 (0.001) | [0.768;0.994] | 0.932 | |
| 0.842 | 0.048 | 0.843 (0.002) | 0.069 (0.001) | [0.736;0.958] | 0.751 | |
| 0.762 | 0.046 | 0.762 (0.003) | 0.066 (0.001) | [0.660;0.876] | 0.888 | |
| 0.763 | 0.047 | 0.765 (0.003) | 0.067 (0.001) | [0.661;0.874] | 0.897 | |
| 0.848 | 0.059 | 0.856 (0.003) | 0.090 (0.002) | [0.716;1.009] | 1.276 | |
| 669.1 | 27.7 | 672.7 (2.1) | 39.7 (0.7) | [610.0;740.0] | 296 | |
| 329.0 | 14.4 | 331.1 (1.0) | 20.6 (0.4) | [298.1;365.9] | 190 | |
| 77.43 | 4.38 | 78.06 (0.24) | 6.10 (0.06) | [68.58;88.29] | 75.4 | |
| 24.59 | 1.96 | 24.95 (0.08) | 2.64 (0.03) | [20.89;29.64] | 40.9 | |
| 16.28 | 1.55 | 16.65 (0.05) | 2.09 (0.03) | [13.44;20.30] | 40.6 | |
| 7.773 | 1.028 | 8.068 (0.024) | 1.356 (0.020) | [6.064;10.473] | 26.0 | |
| 5.776 | 0.937 | 6.115 (0.022) | 1.261 (0.016) | [4.246;8.347] | 24.1 | |
| 1.219 | 0.396 | 1.494 (0.006) | 0.609 (0.013) | [0.739;2.609] | 13.1 | |
| 1.188 | 0.476 | 1.622 (0.008) | 0.802 (0.016) | [0.674;3.070] | 15.1 | |
| 1.581 | 0.790 | 2.439 (0.021) | 1.496 (0.026) | [0.829;5.250] | 32.1 | |
| 0.71 | 4.19E-54 | 3.04E-43 | 1.03E-28 | 6.71E-20 | 2.17E-21 | 0.29 | |
| DIC | 399 | 649 | 600 | 535 | 498 | 507 | 398 |
| LHR | 1 | 2.76E-50 | 1.67E-40 | 3.53E-28 | 5.78E-21 | 3.03E-23 | 0.043 |
| Model Averaging | Model Selection for | |
|---|---|---|
| Estimated Reserves | ||
| Process Variance | ||
| Estimation Error |
| Model Averaging | ||
|---|---|---|
| Statistic | Bayesian Estimate | MLE Estimate |
| 624.1 (0.7) | 602.630 | |
| 37.3 (0.2) | 25.937 | |
| 44.8 (0.5) | 28.336 | |
| 58.3(0.5) | 38.414 | |
| Model Averaging | ||
|---|---|---|
| VaRq | ||
| VaR75% | 659.8 (0.9) | 650.6 (1.0) |
| VaR90% | 698.4 (1.2) | 680.4 (1.3) |
| VaR95% | 724.0 (1.5) | 701.7 (1.6) |
| Overdispersed Poisson | Gamma model | |||
|---|---|---|---|---|
| Statistic | ||||
| 604.706 | 604.706 | 594.705 | 594.705 | |
| 29.829 | 24.017 | 62.481 | 52.162 | |
| 30.956 | 24.925 | 92.826 | 77.496 | |
| 42.989 | 34.613 | 111.895 | 93.415 | |

.