Ultra-low Amplitude Variables in the LMC – Classical Cepheids, Pop. II Cepheids, RV Tau Stars and Binary Variables
Abstract
A search for variable stars with ultra-low amplitudes (ULA), in the millimag
range, has been made in the combined MACHO and OGLE data bases in the broad
vicinity of the Cepheid instability strip in the HR diagram. A total of 25
singly periodic and 4 multiply periodic ULA objects has been uncovered. Our
analysis does not allow us to distinguish between pulsational and ellipsoidal
(binary) variability, nor between LMC and foreground objects.
However, the objects are strongly clustered and appear
to be associated with the pulsational instability strips of LMC Pop. I and II
variables.
When combined with the ULA variables of Buchler et al. (2005) a total of
20 objects fall close to the
classical Cepheid instability strip. However, they appear to fall on parallel
period-magnitude relations that are shifted to slightly higher magnitude which
would confer them a different evolutionary status.
Low amplitude RV Tauri and Pop. II Cepheids have been uncovered that do not
appear in the MACHO or OGLE catalogs. Interestingly, a set of binaries seem to
lie on a PM relation that is essentially parallel to that of the
RV Tauri/Pop. II Cepheids.
Subject headings:
stars: oscillations (including pulsations), (galaxies:) Magellanic Clouds, (stars: variables:) Cepheids, stars: variables: other, stars: Population II, instabilities, (stars:) binaries: general, (stars:) binaries (including multiple): closeSubmitted to ApJ
1. Introduction
In a previous paper (Buchler et al. , 2005), we searched for periodic variability in the light curves of selected LMC stars in MACHO Field 77. The stars were required to lie in and around the Cepheid instability strip in the HR diagram. We found seven stars with a periodic behavior of less than 0.006 mag. and labeled them ultra-low amplitude (ULA) Cepheids.
In this paper, we extend our analysis to all stars that are common to the OGLE II and III (Udalski et al, 1999) and the MACHO (Alcock et al., 1999) data bases. The stellar selection is defined in terms of the OGLE stars that are located in a parallelogram in the HR diagram defined by and . This region has been chosen by visual inspection to include the instability strip and colors 0.15 blueward and redward. It contains a mixture of non-oscillatory giants of spectral type F, and variable stars such as Cepheids, W Vir stars, and ellipsoidal variables and other binaries. The region has been converted from Johnson and Cousins into MACHO blue magnitude (MB) and red magnitude (MR) using the transforms given in Alcock et al. (1999). Position-matched stars were examined in both the MACHO and OGLE data bases.
The standard LMC Cepheids have already been identified both in the MACHO, EROS and the OGLE data bases separately for amplitudes greater than about 0.01 mag. (Beaulieu et al. , 1995; Welch et al. , 1995; Udalski et al, 1999; Kanbur et al. , 2003). Our goal here is to concentrate on ULA objects.
Columns: OGLE and MACHO IDs, I band mag, color, period, frequency, MR and OGLE I band Fourier amplitudes. See text for cols. 9 and 10. Object SC2 357794 lies considerably above the Cepheid P–M relation (, ) and is a strange Cepheid candidate.
| OGLE | MACHO | I | (V-I) | ||||||
|---|---|---|---|---|---|---|---|---|---|
| SC6 57397 | 78.6463.64 | 15.220 | 0.444 | 2.3629 | 0.42320 | 0.0102 | 0.0091 | RBI | |
| SC8 76141 | 79.5746.15 | 13.994 | 0.846 | 7.8600 | 0.12723 | 0.0090 | 0.0057 | RBI | |
| SC11 325504 | 79.4779.17 | 13.772 | 0.821 | 6.4537 | 0.15495 | 0.0027 | 0.0028 | RBI | |
| SC15 5854 | 17.3199.23 | 15.496 | 0.267 | 1.0674 | 0.93685 | 0.0080 | 0.0115 | RBI | |
| SC13 223889 | 1.4295.12 | 14.452 | 0.891 | 5.5415 | 0.18046 | 0.0030 | 0.0039 | RBI | |
| SC1 335392 | 81.8881.40 | 14.679 | 0.835 | 10.3895 | 0.09625 | 0.0036 | 0.0028 | RBI | |
| SC1 330647 | 81.8758.16 | 15.307 | 0.276 | 15.029 | 0.06654 | 0.0036 | 0.0030 | RBI | |
| SC13 178852 | 19.4299.298 | 14.896 | 0.745 | 2.5337 | 0.39467 | 0.0027 | 0.0038 | RI | x |
| SC5 416555 | 77.7189.9 | 14.161 | 0.431 | 7.7750 | 0.12862 | 0.0026 | 0.0019 | RI | x |
| SC15 196983 | 1.3568.30 | 14.855 | 0.523 | 3.0663 | 0.32613 | 0.0029 | 0.0016 | BI | x |
| SC2 6920 | 7.8026.17 | 13.946 | 0.871 | 7.4876 | 0.13355 | 0.0042 | 0.0035 | RBI | |
| SC19 64022 | 12.10317.10 | 13.783 | 0.975 | 9.2242 | 0.10841 | 0.0033 | 0.0043 | RBI | |
| SC9 127569 | 79.5378.48 | 14.818 | 0.817 | 9.5378 | 0.10485 | 0.0035 | 0.0029 | RBI | |
| SC11 300879 | 79.4775.9 | 13.654 | 0.884 | 12.600 | 0.07937 | 0.0063 | 0.0067 | RBI | |
| SC14 7197 | 1.3561.6 | 14.580 | 0.799 | 5.0807 | 0.19682 | 0.0048 | 0.0045 | RBI | |
| SC7 344553 | 80.6351.14 | 13.886 | 0.915 | 8.3764 | 0.11938 | 0.0049 | 0.0025 | RBI | |
| SC20 181340 | 12.10922.11 | 14.873 | 0.832 | 11.970 | 0.08354 | 0.0049 | 0.0040 | RBI | |
| SC21 140323 | 6.6697.11 | 14.136 | 0.801 | 8.3250 | 0.12012 | 0.0041 | 0.0030 | RBI | |
| SC13 191166 | 19.4302.323 | 14.450 | 0.804 | 12.1561 | 0.08226 | 0.0032 | 0.0029 | RBI | x |
| SC2 357794 | 81.8392.8 | 13.109 | 1.006 | 4.2964 | 0.23275 | 0.0059 | 0.0013 | S RBI | |
| SC4 296029 | 77.7428.36 | 14.819 | 0.676 | 2.2250 | 0.44953 | 0.0024 | 0.0022 | RBI | * |
| SC4 323401 | 77.7430.18 | 14.505 | 0.759 | 3.3116 | 0.30187 | 0.0042 | 0.0033 | RI | * |
| SC3 153959 | 77.7789.25 | 14.116 | 0.901 | 9.9817 | 0.10018 | 0.0045 | 0.0034 | RBI | * |
| SC3 35239 | 77.7668.981 | 14.149 | 0.768 | 4.3373 | 0.23056 | 0.0054 | 0.0032 | RI | * |
| SC4 176301 | 77.7306.43 | 14.566 | 0.617 | 6.7609 | 0.14791 | 0.0109 | 0.0025 | RBI | * |
Fourier analysis is known to be very good at detecting periodicity in data sets even in the presence of large noise. We have therefore performed a Fourier analysis of the light curves in the combined data base in the three bands MACHO MR and MB and OGLE I with the MUFRAN code (multi-frequency analysis, Kolláth 1990). The OGLE V band data set is generally sparse and less useful in the detection of ULA variables. The analysis is performed in the 0 – 0.99 d-1 frequency range, but the plotted frequency range in the subsequent figures is 0.004 – 0.99 d-1, so as to avoid both the yearly and the daily aliases. One has to be careful not to miss a potential longer period that can occur in some ellipsoidals (Mennickent et al. , 2003). We have sifted obvious outlying points from the light curves prior to analysis. In this paper all quoted amplitudes refer to Fourier amplitudes. They are determined with MUFRAN with a sinusoidal linear least-squares fit to the light curve using the frequency from the dominant Fourier peak.
We first reduce the set of over 3000 objects to those in which there are coincidences among the 8 largest Fourier peaks in MR and OGLE I. For the standard, large amplitude Cepheids the peaks are very sharp, and these variable stars are thus readily identified. In the case of the ULA stars, the Fourier peaks MR amplitudes fall well below 0.01 mag, but nevertheless there are coincidences among the MR and I peaks. Each of these cases has to be examined individually to ascertain that the detected variability is not spurious. For this purpose we also use the MB data.
We mention in passing that the typical MR, MB and OGLE I window functions have a very large sharp central peak with yearly side peaks at least 45% lower, but otherwise are very dull.
We note one peculiarity with the Fourier spectra which is a result of the extremely large 1 day alias of the data: all significant peaks of frequency occur with an alias at , i.e., with peaks placed symmetrically around the frequency 0.5 d-1. The peaks can be of comparable amplitude. The ambiguity of the period determination can generally be resolved by a comparison of the peaks in MR, MB, OGLE I and V. When the symmetrically placed peak is absent, which happens when the original peak is barely above the noise, it likely is an indication that the frequency is spurious.
The objects we have found have been grouped into a singly periodic and a multiperiodic set, and will present them separately.
2. Singly Periodic Objects
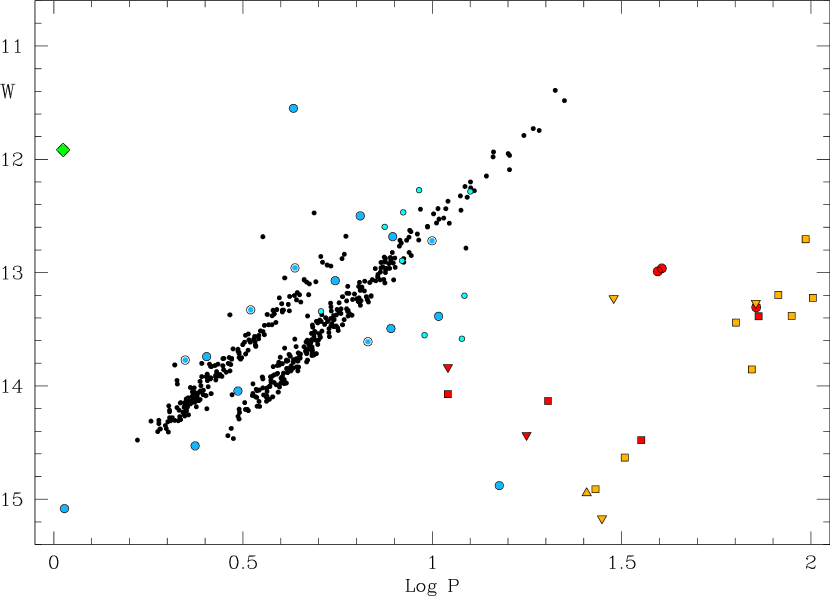
Figure 1 displays all the singly periodic variables that we have uncovered in a period–magnitude (PM) diagram. is the Wesenheit function, a reddening-free magnitude estimate. We now attempt to identify the nature of these objects.
The black dots in Fig. 1 fall on two parallel bands which correspond to the fundamental and overtone classical Cepheids. They are included in the figures for reference purposes. All these Cepheids have I band amplitudes greater than 0.015 mag.
The red and orange symbols below the classical Cepheids have relatively large amplitudes. We will return to them below.
The 25 ULA variables we have found are listed in Table 1. All objects have I band amplitudes less than 0.0067, except for SC15 5854 which has an amplitude of 0.0115. The first two columns of Table 1 give the MACHO and OGLE names, respectively, followed by the average I magnitude and (V–I) color, and the period, , frequency , and the Fourier amplitudes in MR and in OGLE I. The frequency (and period) is optimized in a linear squares Fourier fit to the MR data starting with the highest MR spectral peak.
The penultimate column denotes the bands in which there is a strong common peak in the Fourier spectra. By strong we mean that its amplitude stands out by at least a factor of two above the noise level. The asterisk in the last column denotes stars that were already discussed by Buchler et al. (2005).
We have plotted the ULA variables as light blue and cyan circles. For the four ULA objects that are branded with an X, the evidence for very low amplitude periodicity is a little less strong in the sense that it does not satisfy all our criteria. We will return to them shortly.
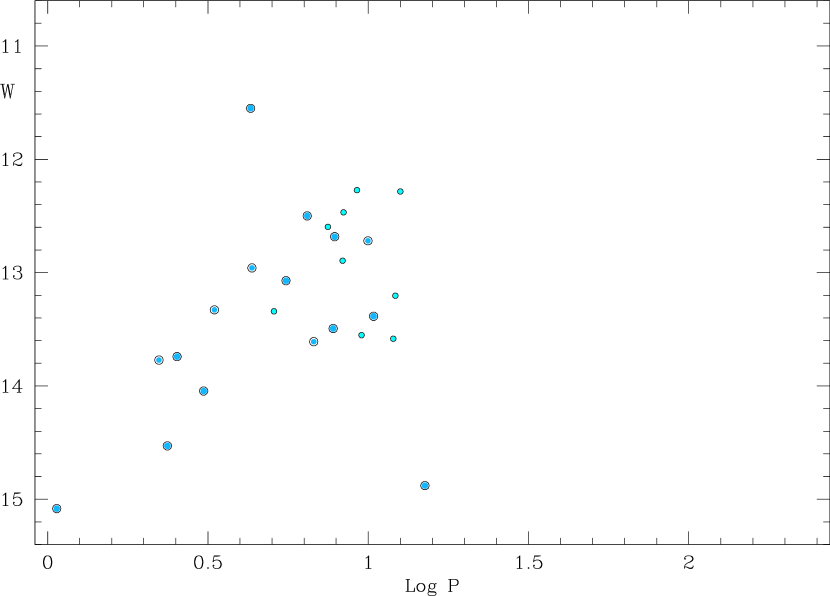
Because of the observational noise we have no way of distinguishing ULA pulsating stars from ellipsoidal variables. However, we shall argue that there are very few ellipsoidals in our sample. For that purpose we present Figure 2 which locates, unencumbered, only the ULA variables in the whole range we have analyzed, namely the range corresponding to the chosen parallelogram in the HR diagram (see §1) and the frequency range from 0.004 to 0.99 d-1, i.e., [d] = 0.0044 – 2.40. The way the ULA objects cluster near the instability strip in the PM diagram suggests that a large majority of the objects are intrinsic variables and are associated with either the classical Cepheids or, the lower lying ones, the Pop. II Cepheids.
In the OGLE data (Udalski et al, 2008) each frame was processed with the DoPhot photometry program. In this way independent PSF profile photometry of each object was derived, supplemented with astrometric information (current X,Y position) obtained via PSF fitting. As a result proper motions can be inferred. In fact, unpublished OGLE-III data suggests that 9 objects show proper motion, which in turn suggests that they are foreground stars. They are represented as smaller cyan filled circles in Figs. 1 and 2, and are branded with a dagger in column 10 of Table 1. However, if they are indeed foreground stars in the solar vicinity that overlap in the CMD with the LMC instability strip (Soszyński et al. , 2002) it is nevertheless curious that 6 of them, additionally, appear so near the LMC classical Cepheid PM relations, and the other 3 cluster just below.
If they are foreground stars, one would think that they are some sort of main-sequence ellipsoidal binary in the solar vicinity. Generally, spectra can be used to tell giants from dwarfs and to derive radial velocities, so potentially foreground or LMC status could be investigated by spectral observations, along with radial velocity variations to check binarity vs. pulsation.
For completeness, we note that we have also found one egregious large amplitude variable in the database, viz. SC8 81586 (79.5626.10). Despite the relative sparsity of its OGLE and MACHO data and the noisiness of its MACHO data this object has a sharply defined period of = 1.0589 d, and relatively large amplitudes ( = 0.024, = 0.025, = 0.036). It is depicted as a green diamond in the upper left side in Fig. 1.
2.1. Fourier Spectra and Light Curves of the Singly Periodic Ultra-low Amplitude (ULA) Objects
Plots of the results of our Fourier analysis of each of these objects would take up too much space in this paper. We therefore give just a few representative examples.
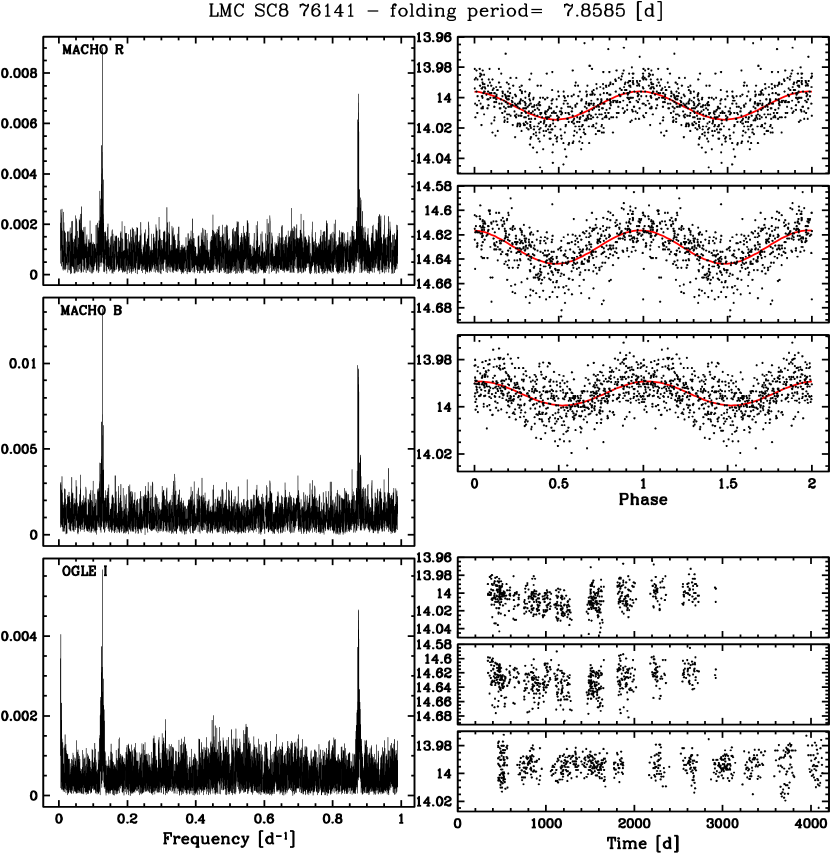
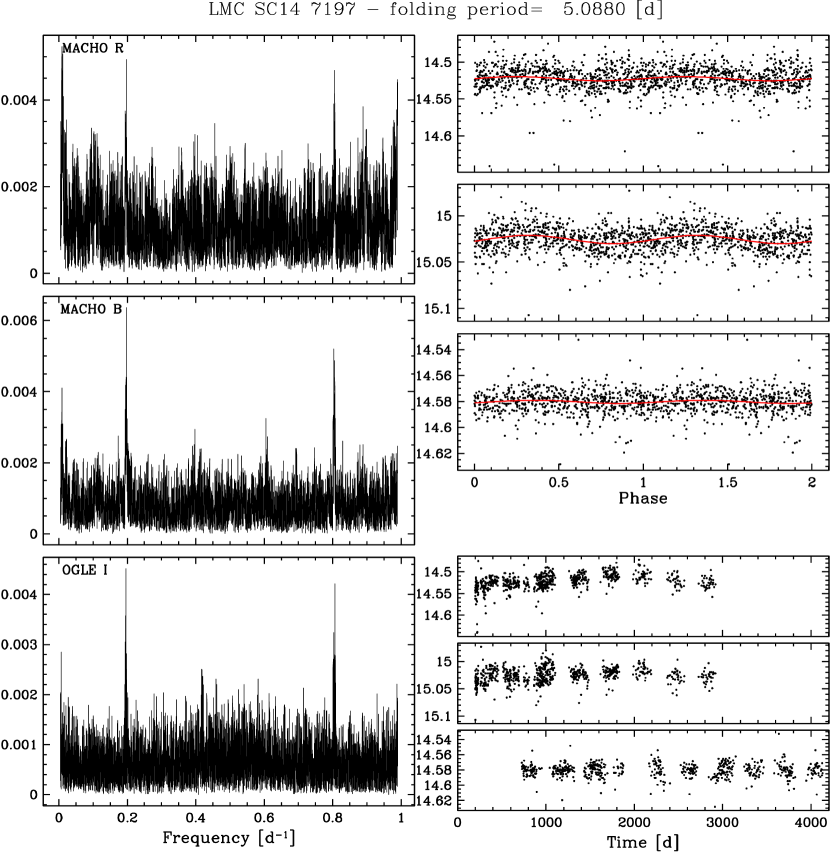
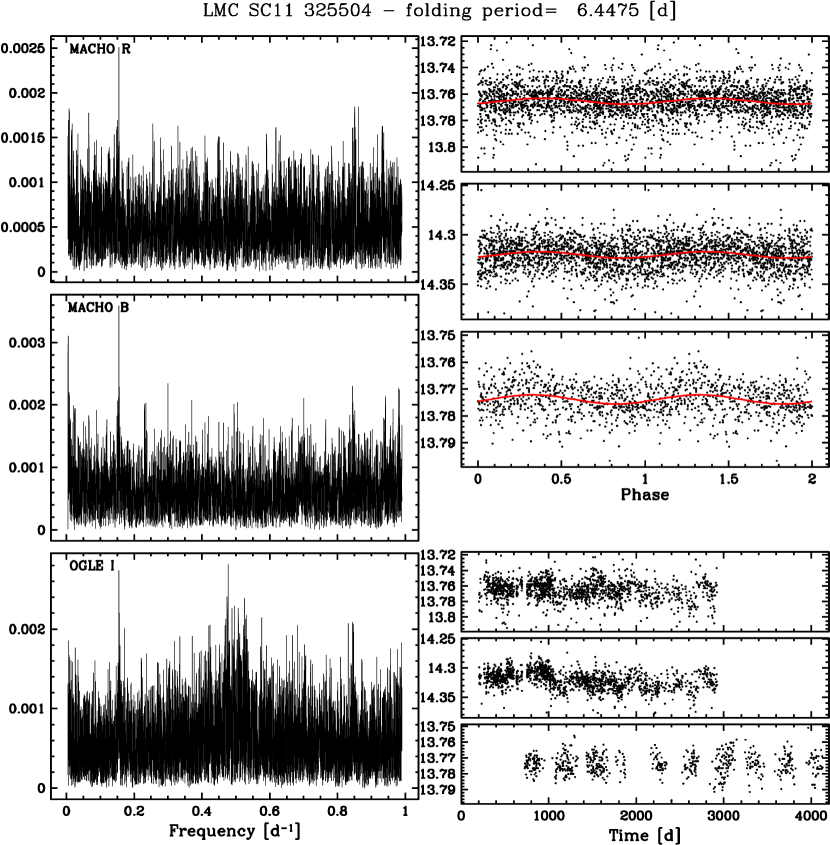
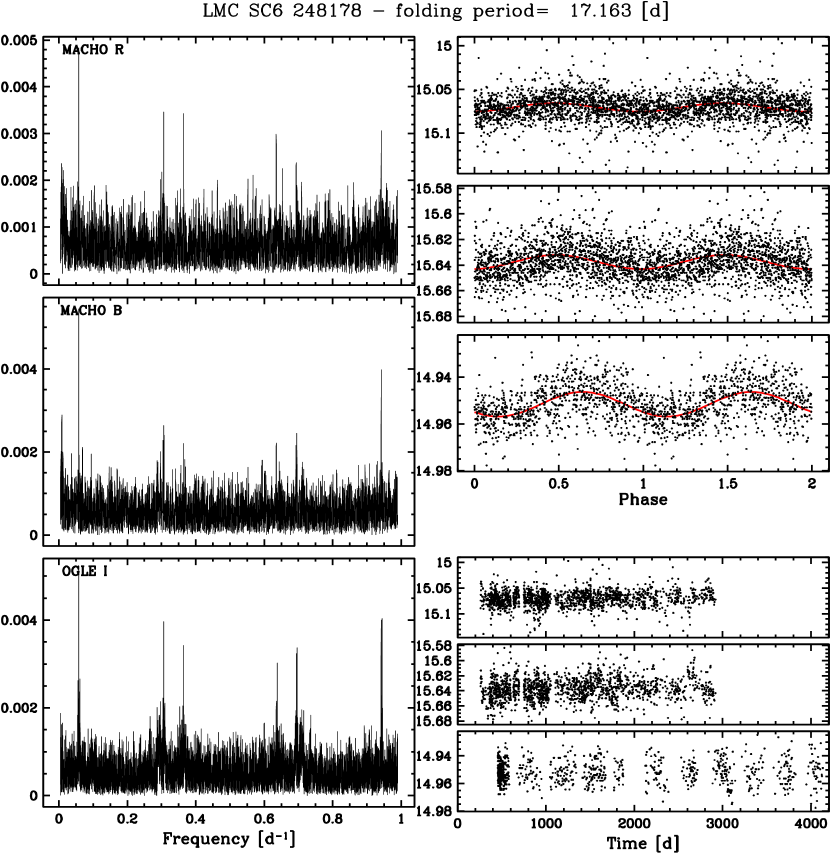
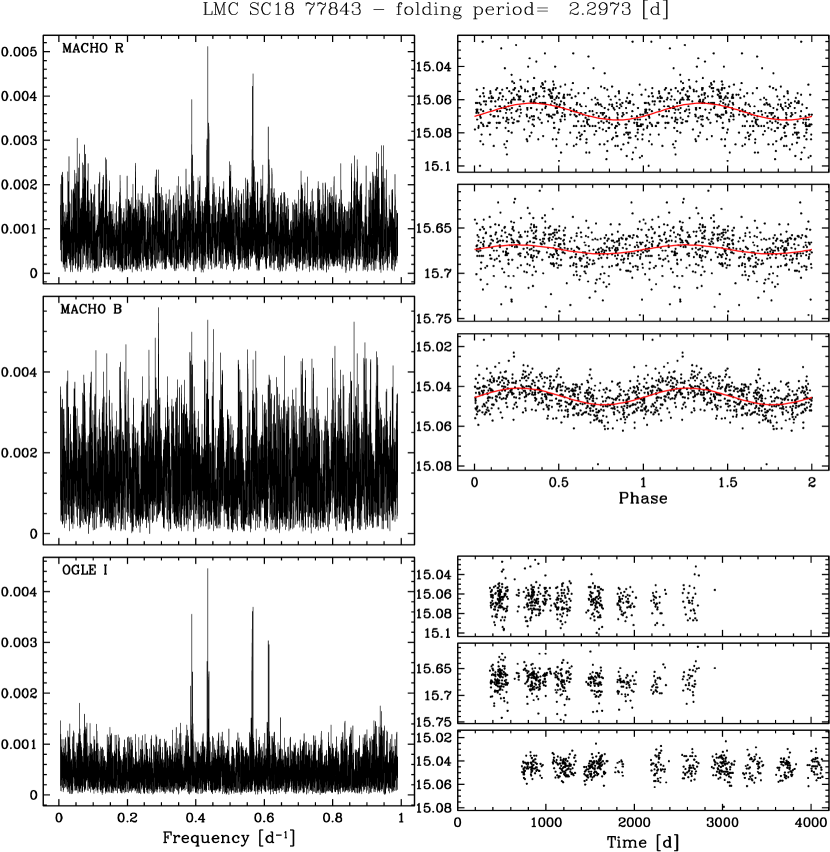
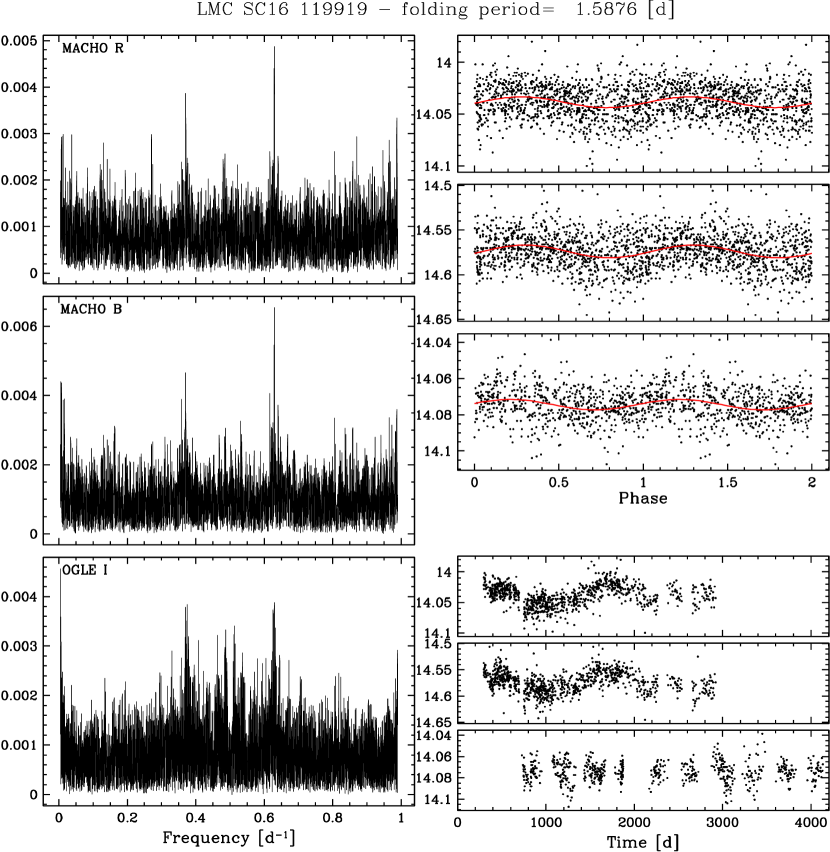
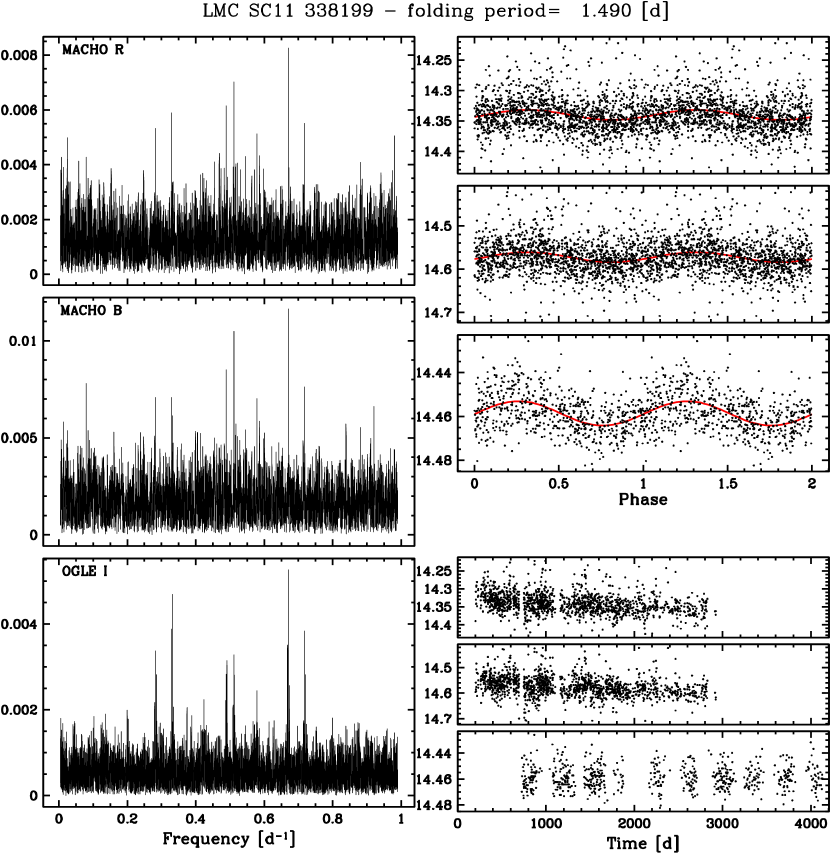
Our figures are in a standard format and contain: (1) Panels with the amplitude Fourier spectra for the MR, MB and OGLE I, respectively, plotted for a frequency range of 0.004 to 0.99 d-1. (2) Panels with the actual data points on the bottom right; because the OGLE observations start three and 3/4 years (1376.5 days) after the MACHO observations we have shifted them backwards in time in the OGLE panel for better visualization. (3) Panels on the top right side that display the light curves folded with the period that is indicated on top of the figure; the MACHO and OGLE data have been phased by taking the 1376.5 d shift into account. The solid red curves in the top right panels represent single frequency harmonic fits to the phased and folded MR MB, and OGLE I data. In some cases we have made small adjustments to the folding period to improve the phasing.
The analyses of SC8 76141, SC14 7197, and SC11 325504 are exhibited in Figs. 3 – 5. They are among the top 16 objects of Table 1 and they satisfy all our criteria for variability, viz. clear peaks in all 3 bands, a strong 1 day alias, good consistent phasing of the folded light curves.
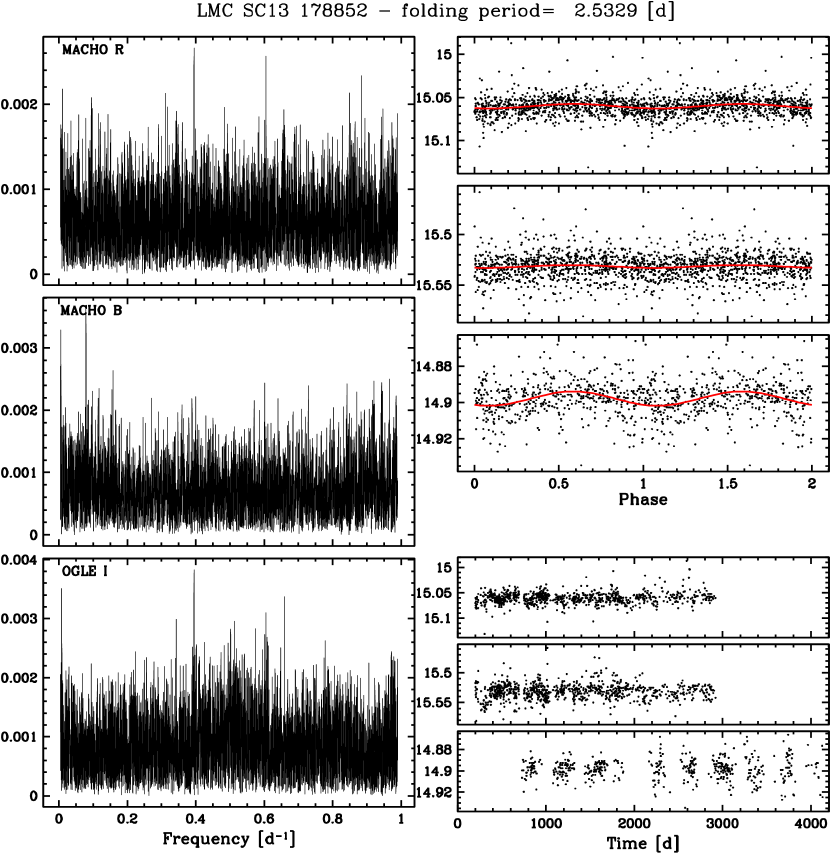
Finally, we wish to give two examples of variability at the confidence limit. Fig. 6 displays the analysis of SC13 178852. The OGLE I data have a very convincing spectrum with a dominant peak at 0.3947 d-1. While the corresponding peak is indeed the largest in MR and MB, one would perhaps not have claimed variability on the basis of the MACHO or the OGLE data alone. However, it is unlikely that the same object would show common peaks, however weak if the variability were not real. Note also that the MR spectrum shows the 1-f alias and that there is a strong hint of it in the OGLE I spectrum. Furthermore, the folded light curves show in-phase variability.
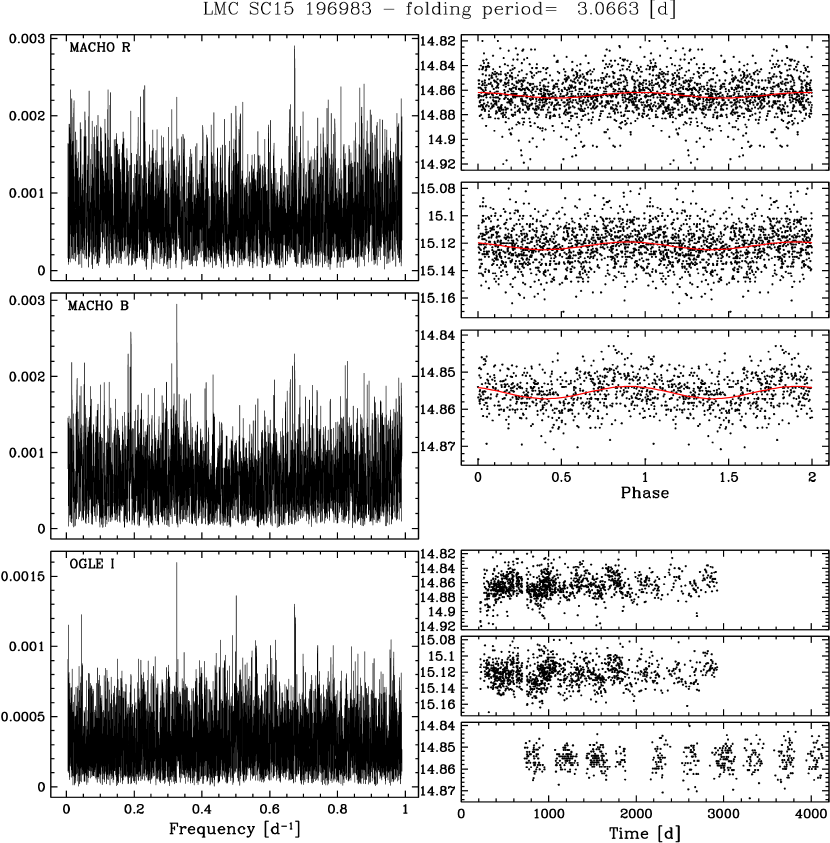
In Fig. 7 we present perhaps our weakest case (SC15 196983) for variability. OGLE I and MB have their dominant peak at fo =0.3261 d-1. OGLE I has a strong 1 day alias peak at 0.6739, which is also present in MB albeit just barely. However this is the prominent peak in MR where the fo peak is hidden in the ’grass’. We have chosen the fo peak as the actual frequency of this object for two reasons: first because it is the dominant peak in the OGLE I data which have the cleanest spectrum, and second, because the other peak gives a bad phasing between the folded MACHO and OGLE data.
2.2. Discussion
Since many of the objects lie in crowded fields the question arises as to the reliability of our assignments. The variability analysis and the periods that have been determined are immune to contamination by neigboring objects unless those objects have variability themselves or our object is part of a binary, for example.
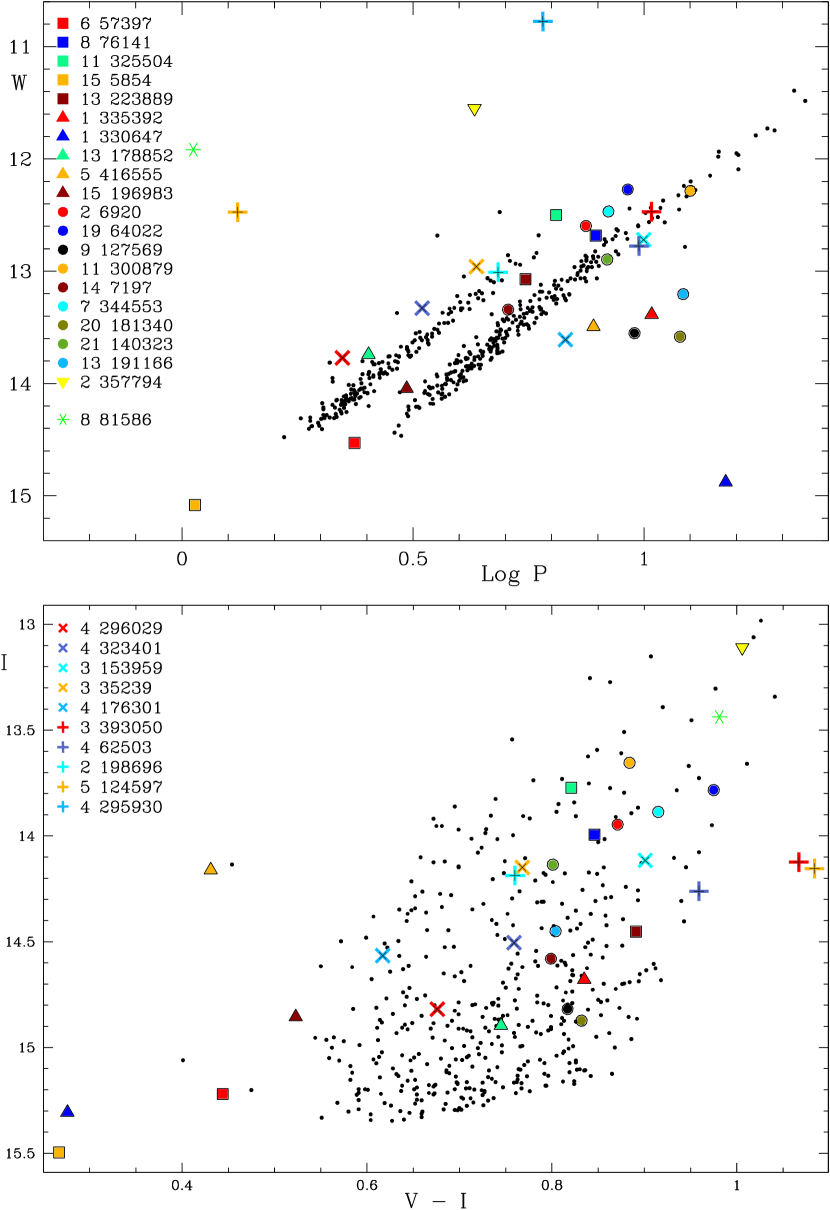
On the other hand, contamination by a neighboring object will affect the magnitude and the color of our objects. We have looked in some detail at the 3 objects SC4 62503, SC5 124597 and SC4 295930, for example. The first two are isolated objects, but the third one is a messy clump, so it is possible (but not necessary) that the photometry of this last object is poor. This will apply to both the OGLE and MACHO data. V–I for this object is 1.38, way outside the typical range (see the CM plot of Fig 8. A further look at SC4 295930 in I-MR, V-MB and V-I reveals that I is anomalously bright, by at least 0.5 mag. Consequently, it should be shifted down in the PM plot and could well be a regular classical Cepheid of very low amplitude rather than a strange Cepheid.
We now turn to Fig. 8. The top panel is a blowup of the PM (, ) plot of Fig. 1, and the bottom panel is the corresponding CM (V–I, I) plot. All the objects that are listed in Table 1 and in Buchler et al. (2005) are identifiable in the figure. The squares, diamonds, filled circles and upright triangles indicate the newly found ULAs. The filled circles locate the potential foreground objects. The Xs denote the 5 variables that are in common with the previous work of Buchler et al. (2005) which concentrated on MACHO Field 77. The crosses are their additional variables that lie marginally outside the cut that defines this paper’s data base (see §1). For reference we have again plotted the classical Cepheids as small black dots.
These ULA objects are certainly a mixture of pulsating stars with perhaps a few ellipsoidals that can also have amplitudes in the millimag range. Of course, the ULA Cepheids have to satisfy the known PM relations, but it is difficult to distinguish between these two types of low amplitude variability.
One notes that 20 objects of Table 1 fall into the classical Cepheid range, in both the PM and the CM diagrams. Most of the ULA objects fall outside of or near the edges of the F and O1 instability strips. That ULA Cepheids would be at the edges of the instability strip is consistent with theory (Buchler & Kollath, 2002; Buchler et al. , 2005).
However one might claim that the figure indicates that the ULA objects form two separate, parallel fundamental and overtone PM relations in which case they would be physically distinct from the regular Cepheids (perhaps on the first crossing of the instability strip rather than on the second or third crossings on the blue loop). The color-magnitude diagram, unfortunately has too much scatter to provide any discriminating information.
One object, SC15 5854, with a period of 1.0674 d lies in the continuation of the Cepheid PM relation and falls into the CM range of the Cepheids, albeit quite beyond the tip.
There is a cluster of 6 stars that falls below the Cepheid PM relation with periods 2–3 times longer than that of classical Cepheids of the same magnitude. Three of them are possibly foreground stars, as discussed in §2. Again, we cannot be sure that these objects are not ellipsoidals, but it seems unlikely because of the clustering in PM. Furthermore, 4 of them (SC9 127569, SC20 181340, SC1 335382, and SC13 191166) also cluster in CM. This suggests that they are pulsators rather than ellipsoidals. What is their nature? They are unlikely to be classical Cepheids because they have too small a brightness for their period, and potential contamination by neighboring objects would move them even lower in the PM diagram. It is possible that these stars are also ULA Population II stars. However, SC5 416555, which is very blue is perhaps an ellipsoidal.
The star SC2 357794, marked with an inverted triangle in Fig. 8, falls into the proper CM range, but it has a period a factor of 5 smaller than the fundamental Cepheid period, i.e., the period the star would have if it pulsated in the F mode. The theoretical work of Buchler et al. (1997) has shown that some Cepheids can pulsate in a surface mode with a period that is about a factor of 4–5 shorter than the corresponding fundamental period. This object therefore is possibly a strange Cepheid (Buchler & Kollath, 2001). But one cannot rule out that the light curve might be contaminated by a bright nearby star in which case it could be a regular ULA Cepheid as we already suggested for object SC5 124597 that Buchler et al. (2005) had identified as a strange Cepheid candidate.
Object SC1 330647 is a little offset with 15 and and lies in the W Vir instability region (see Fig. 1. It could be a ULA W Vir star although its V–I color is very blue.
We conclude that most if not all of the ULA singly periodic objects in the data set are Pop. I and Pop. II Cepheids, with the caveat that some might be foreground stars or ellipsoidals.
2.3. Other, Larger Amplitude Variable Objects
We now turn to the larger amplitude singly periodic stars that are exhibited in Table 2. The objects that we identify as probable binaries are marked in orange and the probable Pop. II or RV Tau in red in Fig. 1.
Their identifiers, their average I magnitudes, Wesenheit magnitudes and their periods (or cycling times) are given in Table 2. The first two columns give the MACHO and OGLE names. All these stars have I band Fourier amplitudes in the range 0.01 to 0.25. An exception is the ULA SC3 201554 with harmonic peak amplitudes of 0.0065 and 0.0075, that is shown in yellow. The objects that are displayed as triangles have regular light curves. One object, SC4 53483, has a ’crested top’ light curve that is typical of some W Vir stars. The remainder show behavior with cycle to cycle alternations. These alternations are regular (squares) for some and some semi-regular (circles).
The period association is sometimes ambiguous by a factor of 2 when alternations are present. We have not chosen the period with the highest Fourier peak, but somewhat arbitrarily the one that gives visually the folded light curve with the least scatter.
One notes that all but 2 points would fall on 2 parallel, relatively tight PM relations that are separated by 0.3 (factor of 2 in P). The binaries (orange) fall predominantly on the right sequence, and the Pop. II/RV tau stars (red) predominantly on the left one.
Actually, from a physical point of view, for the pulsating stars the shorter period is more relevant as it corresponds to the linearly excited pulsational mode, whereas the longer period arises through period doubling that is caused by nonlinear effects (Buchler & Kovacs (1986), Kovacs & Buchler (1987)).
For the binaries, the reverse situation holds. Here there are also two sequences separated by 0.3 in because the ”no alt” stars can adopt a period equal to half the orbital period (there are two maxima per orbit).
But, why does the binary sequence exist? We will argue that it is because stars on the blue loops have a certain size at a given luminosity and color, and if they have a companion that is capable of causing ellipsoidal variations, it must be at a small multiple of the stellar radius. This radius increases with luminosity (I) and color (V-I). The conversion to will tend to take out the V-I variation along tracks at given luminosity. If we remember that for both orbits and pulsation, , and that the period of the fundamental pulsation mode is not too different from the orbital period at the stellar surface, we can see that qualitatively the binary sequence should be parallel to the pulsation sequence: more detailed computations would be needed to estimate the exact shift in . The stars on the binary sequence should therefore be in the LMC.
Columns: OGLE and MACHO IDs, I band mag, period, I band Fourier amplitude, star type. In the case of alternating cycles, the period has been chosen to visually give the best folded light curve, rather than to correspond to the Fourier peak with the highest amplitude.
| OGLE ID | MACHO ID | P[d] | Type of star | ||||
|---|---|---|---|---|---|---|---|
| SC21 85305 | 6.6575.25 | 15.065 | 14.071 | 10.99 | alt | Pop. II | |
| SC8 52612 | 79.5622.20 | 14.638 | 13.835 | 10.99 | 0.038 | no alt | Pop. II |
| SC7 295173 | 78.6223.44 | 15.036 | 14.435 | 17.74 | 0.037 | no alt | Pop. II |
| SC4 53483 | 77.7306.73 | 14.902 | 14.133 | 20.21 | crested | Pop. II | |
| SC4 287444 | 77.7426.59 | 15.288 | 14.911 | 26.97 | alt | binary | |
| SC1 325044 | 81.8758.27 | 15.533 | 15.170 | 28.06 | 0.015 | no alt | binary |
| SC6 462158 | 80.6710.17 | 14.113 | 13.226 | 30.14 | 0.014 | no alt | binary |
| SC10 137113 | 2.4902.4632 | 15.175 | 14.633 | 32.22 | alt | ||
| SC10 105184 | 79.4896.51 | 15.225 | 14.478 | 35.61 | alt | Pop. II | |
| SC5 92493 | 78.6949.2259 | 14.090 | 12.989 | 39.4 | semireg | Pop. II | |
| SC3 274381 | 77.7911.4 | 14.105 | 12.963 | 40.4 | semireg | Pop. II | |
| SC14 57979 | 19.3694.19 | 14.662 | 13.441 | 63.40 | alt | binary | |
| SC11 338244 | 79.4659.3417 | 14.972 | 13.854 | 69.82 | alt | binary | |
| SC11 338203 | 79.4780.27 | 14.569 | 13.306 | 71.7 | semireg | Pop. II | |
| SC9 263456 | 79.5504.13 | 14.684 | 13.267 | 71.78 | 0.057 | no alt | binary |
| SC6 40874 | 78.6461.2152 | 14.361 | 13.385 | 72.76 | alt | Pop. II | |
| SC8 181816 | 78.5856.2363 | 14.383 | 13.197 | 81.99 | alt | binary | |
| SC14 100796 | 1.3810.19 | 14.038 | 13.382 | 88.95 | alt | binary | |
| SC9 237168 | 79.5501.13 | 13.845 | 12.706 | 96.90 | alt | binary | |
| SC14 100798 | 1.3810.30 | 14.323 | 13.226 | 101.26 | alt | binary | |
| SC3 201554 | 77.7794.46 | 15.527 | 14.9457 | 25.57 | 0.007 | binary |
3. Multiperiodic variables
Columns: OGLE and MACHO identifiers, I magnitude, V–I color, significant frequencies, corresponding MR Fourier amplitudes. (The last object’s amplitude is a little larger than our ULA criterion). A dagger in the last column denotes potential proper motion.
| OGLE | MACHO | I | (V-I) | |||||||||
|---|---|---|---|---|---|---|---|---|---|---|---|---|
| SC6 248178 | 78.6699.27 | 14.951 | 0.885 | 0.05819 | 0.36484 | 0.30657 | 0.0048 | 0.0034 | 0.0034 | |||
| SC18 77843 | 11.9838.21 | 15.045 | 0.853 | 0.43528 | 0.38817 | 0.0050 | 0.0039 | |||||
| SC16 119919 | 81.8998.12 | 14.074 | 0.881 | 0.63018 | 0.00072 | 0.0048 | 0.0159 | |||||
| SC11 338199 | 79.4659.3384 | 14.459 | 0.433 | 0.67103 | 0.51146 | 0.71783 | 0.57911 | 0.0083 | 0.0070 | 0.0055 | 0.0051 |
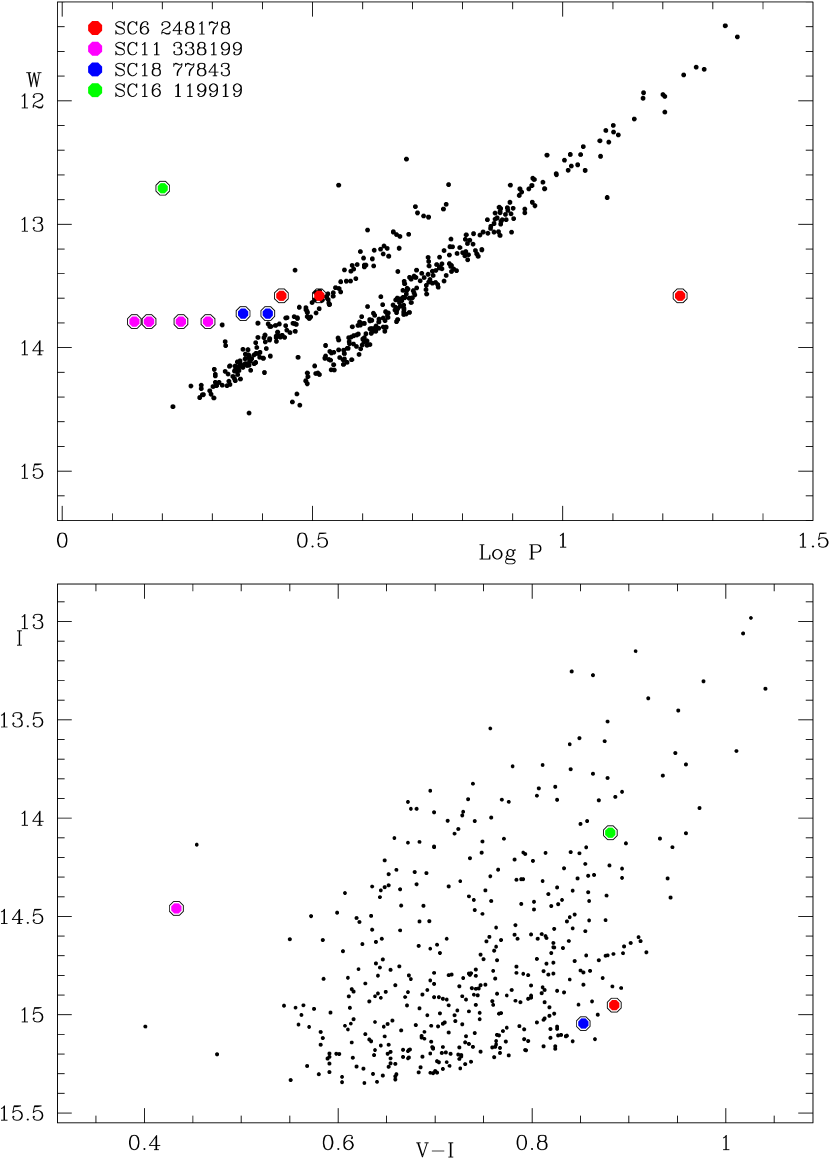
Four of the ULA stars have multiple periods. They are displayed in the PM plot of Fig. 9. Again for reference we have superposed the Cepheids as small black dots. The bottom panel displays the corresponding (I, V-I) plot. The properties of these objects appear in Table 3.
* LMC SC6 248178: The results of the analysis are displayed in Fig. 10. Table 3 indicates that this star has its largest frequency peak at = 0.05819 d-1, i.e., 17.185 d, and two close frequencies, = 0.36484 and = 0.30657 d-1. One notes that . Even though the 3 amplitudes are all in the low millimag range, the 3 peaks stand out very clearly in MR, MB and OGLE I. Peaks 2 and 3 suggest that if this star is a Cepheid it may be a higher order double-mode pulsator with a large period ratio of = 0.84028. If the long period of 17.185 d were due to an unseen binary companion that would not explain the observed frequency lock.
* LMC SC18 77843: The analysis of this object appears in Fig. 11. There are two peaks with a period ratio of 0.89177 which is larger than that of a double mode Cepheid that pulsates in the O1 and O2 modes. The star also lies somewhat to the left of the PM relation, both when plotted with I and with the Wesenheit magnitude , consistent with the expected positions of higher order modes.
* LMC SC16 119919: This star is a 1.59 d period variable with an extremely long period (1380 d) modulation (Fig. 12). Looking at the light curve points one would think that we have mismatched the OGLE object with the wrong MACHO object. However the spectral peaks and the phased, folded light curves suggest otherwise.
The 1.59 d period is much shorter than expected for a Cepheid of similar magnitude and color. Similarly, the long 1380 d is hard to explain. It could be a binary with a very bright companion, although the amplitude of the long period variation would be very large for ellipsoidal motion. The period ratio is also at odds with that of the blue multi periodic variables that Mennickent et al. (2003) discovered.
* LMC SC11 338199: This star is multiperiodic with 4 frequencies that show up simultaneously in MR, MB and OGLE I (Fig. 13). No other peaks seem to be significant. All four periods are consistent with low order radial pulsation modes, but it is not obvious why they they should all be excited for a star of this brightness. However, there is always the possibility that the light curves of this object are contaminated by a neighboring star, in which case it would fall into a brightness regime where one might expect AI Velorum type multimode pulsation.
There is recent evidence for proper motion in this star (Udalski et al, 2008, unpublished OGLE-III results). If SC11 338199 is a foreground star that would make it even brighter and its nature harder to explain.
4. Summary
Fourier analysis of the light curves of LMC stars in the very broad vicinity of the Cepheid instability strip part yielded 25 new singly periodic and 4 new multi-periodic variables with ultra-low amplitudes (ULA) ( 0.01 mag). The advantage of our approach has been that, for many of these objects, it would be difficult to claim variability on the basis of either the MACHO or the OGLE data only. In addition, we have found RV Tauri and Pop. II Cepheids that do not appear in either the MACHO or OGLE catalogs.
If we include the objects of Buchler et al. (2005) we have 20 ULA objects that fall close to the fundamental (F) and overtone (O) Cepheid PM relations. From Fig. 8 it appears that these stars might form separate sequences that are slightly above and parallel to the classical F and O LMC Cepheids. If this effect turns out to be real it will pose an interesting challenge to explain the nature of these objects. There is evidence that 9 of these ULA stars show proper motions and that they could be foreground stars, but that raises other questions as to their nature. Even if we accept them as foreground this still leaves enough (14 instead of 20) objects to suggest separate PM relations.
Combining this and previous work (Buchler et al. , 2005) we now have 3 stars that are strange Cepheid candidates (Buchler & Kollath, 2001), although the light curve of one of them, SC4 295930, could be contaminated by a very bright red star which would place it erroneously above the PM relation.
Six closely clustered objects fall below the classical Cepheid PM relation (see Fig. 8). They could be ULA Pop. II Cepheids or ellipsoidals, although 3 of them could be foreground stars. A further, very blue object, SC1 330647, could be a ULA W Vir star. Interestingly, a set of binaries appear to lie on essentially a PM relation parallel to that of the RV Tauri/Pop. II Cepheids. Finally, we have uncovered 4 objects that show multiple modes of ultra-low amplitude.
References
- Alcock et al. (1999) Alcock, C. and the MACHO Consortium 1999, PASP 111, 1539
- Beaulieu et al. (1995) Beaulieu, J.P., Grison, P. et al. 1995 AA 303, 137
- Buchler et al. (2005) Buchler, J.R., Wood, P.R., Keller, S. & Soszynski, I. 2005, ApJ631, L151.
- Buchler & Kollath (2001) Buchler, J. R. & Kolláth, Z., 2001, ApJ255, 961
- Buchler & Kollath (2002) Buchler, J. R. & Kollath, Z 2002, ApJ573, 324.
- Buchler & Kovacs (1986) Buchler, J. R. & Kovács, G. 1987, ApJ320, L57
- Buchler et al. (1997) Buchler, J.R., Yecko, P.E. & Kolláth, Z. 1997, AA 326, 669
- Kanbur et al. (2003) Kanbur. S. M., Ngeow et al. 2003, AA 411, 361.
- Kolláth (1990) Kolláth, Z. 1990, The program package MUFRAN, Konkoly Observatory Occasional Technical Notes No. 1
- Kovacs & Buchler (1987) Kovács, G. & Buchler, J. R. 1987, ApJ334, 971
- Mennickent et al. (2003) Mennickent, R.E., Pietrzynski, G., Diaz, M, Gieren, W. 2003, A&A399, L47
- Soszyński et al. (2002) Soszyński et al., Acta Astr. 52, 143
- Stellingwerf (1997) Stellingwerf, R.F. 1978, ApJ, 224, 953
- Udalski et al (1999) Udalski A., et al. 1999, Acta Astr. 49, 223
- Udalski et al (2008) Udalski A., et al. 2008, Acta Astr. 58, 69
- Welch et al. (1995) Welch, D.L. et al. 1995, in “Astrophysical Applications of Stellar Pulsation”, Eds. R.S. Stobie & P.A. Whitelock, ASP Conf. Ser. 83, 232